Transcription
8th Grade Mathematics Unpacked ContentsFor the new Standard Course of Study that will be effective in all North Carolina schools in the 2018-19 School Year.This document is designed to help North Carolina educators teach the 8th Grade Mathematics Standard Course of Study. NCDPI staff arecontinually updating and improving these tools to better serve teachers and districts.What is the purpose of this document?The purpose of this document is to increase student achievement by ensuring educators understand the expectations of the new standards. Thisdocument may also be used to facilitate discussion among teachers and curriculum staff and to encourage coherence in the sequence, pacing,and units of study for grade-level curricula. This document, along with on-going professional development, is one of many resources used tounderstand and teach the NC SCOS.What is in the document?This document includes a detailed clarification of each standard in the grade level along with a sample of questions or directions that may beused during the instructional sequence to determine whether students are meeting the learning objective outlined by the standard. These itemsare included to support classroom instruction and are not intended to reflect summative assessment items. The examples included may not fullyaddress the scope of the standard. The document also includes a table of contents of the standards organized by domain with hyperlinks to assistin navigating the electronic version of this instructional support tool.How do I send Feedback?Please send feedback to us at feedback@dpi.state.nc.us and we will use your input to refine our unpacking of the standards. Thank You!Just want the standards alone?You can find the standards alone at ics/scos/.
North Carolina 8th Grade StandardsStandards for Mathematical PracticeExpressions &FunctionsEquationsThe Number SystemKnow that there arenumbers that are notrational and approximatethem by rational numbers.NC.8.NS.1NC.8.NS.2Work with radicals andinteger yze and solve linearequations and inequalities.NC.8.EE.7Define, evaluate, andcompare functions.NC.8.F.1NC.8.F.2NC.8.F.3Use functions to modelrelationships betweenquantities.NC.8.F.4NC.8.F.5Analyze and solve pairs ofsimultaneous linearequations.NC.8.EE.8GeometryUnderstand congruenceand similarity usingphysical models,transparencies, orgeometry software.NC.8.G.2NC.8.G.3NC.8.G.4Statistics & ProbabilityInvestigate patterns ofassociation in Analyze anglerelationships.NC.8.G.5Understand and apply thePythagorean Theorem.NC.8.G.6NC.8.G.7NC.8.G.8Solve real-world andmathematical problemsinvolving volume ofcylinders, cones, andspheres.NC.8.G.9NC Department of Public Instruction28th Grade Unpacking Document Rev. June 2018
Standards for Mathematical PracticePractice1. Make sense of problems andpersevere in solving them.2. Reason abstractly andquantitatively.3. Construct viable argumentsand critique the reasoning ofothers.4. Model with mathematics.5. Use appropriate toolsstrategically.6. Attend to precision.7. Look for and make use ofstructure.8. Look for and expressregularity in repeated reasoning.NC Department of Public InstructionExplanations and ExamplesIn grade 8, students solve real world problems through the application of algebraic and geometric concepts. Students seekthe meaning of a problem and look for efficient ways to represent and solve it. They may check their thinking by askingthemselves, “What is the most efficient way to solve the problem?”, “Does this make sense?”, and “Can I solve the problemin a different way?”In grade 8, students represent a wide variety of real world contexts through the use of real numbers and variables inmathematical expressions, equations, and inequalities. They examine patterns in data and assess the degree to which thepattern models a line. Students contextualize to understand the meaning of the number or variable as related to the problemand decontextualize to manipulate symbolic representations by applying properties of operations.In grade 8, students construct arguments using verbal or written explanations accompanied by expressions, equations,inequalities, models, and graphs, tables, and other data displays (i.e. box plots, dot plots, histograms, etc.). They furtherrefine their mathematical communication skills through mathematical discussions in which they critically evaluate their ownthinking and the thinking of other students. They pose questions like “How did you get that?”, “Why is that true?” “Does thatalways work?” They explain their thinking to others and respond to others’ thinking.In grade 8, students model problem situations symbolically, graphically, tabularly, and contextually. Students formexpressions, equations, or inequalities from real world contexts and connect symbolic and graphical representations.Students solve systems of linear equations and compare properties of functions provided in different forms. Students usescatterplots to represent data and describe associations between variables. Students need many opportunities to connectand explain the connections between the different representations. They should be able to use all of these representationsas appropriate to a problem context.Students consider available tools (including estimation and technology) when solving a mathematical problem and decidewhen certain tools might be helpful. For instance, students in grade 8 may translate a set of data given in tabular form to agraphical representation to compare it to another data set. Students might draw pictures, use applets, or write equations toshow the relationships between the angles created by a transversal.In grade 8, students continue to refine their mathematical communication skills by using clear and precise language in theirdiscussions with others and in their own reasoning. Students use appropriate terminology when referring to the numbersystem, functions, geometric figures, and data displays.Students routinely seek patterns or structures to model and solve problems. In grade 8, students apply properties togenerate equivalent expressions and solve equations. Students examine patterns in tables and graphs to generateequations and describe relationships. Additionally, students experimentally verify the effects of transformations and describethem in terms of congruence and similarity.In grade 8, students use repeated reasoning to understand algorithms and make generalizations about patterns. Studentsuse iterative processes to determine more precise rational approximations for irrational numbers. They analyze patterns ofrepeating decimals to identify the corresponding fraction. Students flexibly make connections between covariance, rates, andrepresentations showing the relationships between quantities.Return to: Standards38th Grade Unpacking Document Rev. June 2018
The Number SystemKnow that there are numbers that are not rational and approximate them by rational numbers.NC.8.NS.1 Understand that every number has a decimal expansion. Building upon the definition of a rational number, know that an irrational number is definedas a non-repeating, non-terminating decimal.ClarificationChecking for UnderstandingIn 6th grade students were introduced to integers and rational numbers. In 7thCreate a graphic organizer to show the relationships within the real numbergrade, students formalized the definition of rational numbers. Students build onsystem, including natural numbers, whole numbers, integers, rationalthis knowledge to complete their understanding of the Real Number System bynumbers and irrational numbers. Include examples that are exclusively withinrecognizing irrational numbers and their relationship to rational numbers.each type of number.Students understand that an irrational number, when represented as a decimalis non-repeating and non-terminating and that irrational numbers cannot bewritten as a rational number. It is important for students to understand thatdistinction between fractional form and a rational number, as irrational numbers3𝜋are often written in fractional form. For example, , is an irrational number4written in fractional form. Students are able to identify irrational numbers.Return to: StandardsKnow that there are numbers that are not rational and approximate them by rational numbers.NC.8.NS.2 Use rational approximations of irrational numbers to compare the size of irrational numbers and locate them approximately on anumber line. Estimate the value of expressions involving: Square roots and cube roots to the tenths. 𝜋 to the hundredths.ClarificationStudents estimate the value of an irrational number and use that estimate tocompare an irrational number to other numbers and to place irrational numberson a number line.Students estimate expressions containing square roots and cube roots to atleast the tenths place. Students should estimate expressions containing 𝜋 tothe hundredths place.This standard connects strongly to NC.8.EE.1, where students write thesolutions to equations of the form 𝑥 2 𝑝 and 𝑥 3 𝑝 as square or cubed roots.Checking for Understanding37Graph the following on a number line: , 2, 1. 3̅, , 28 32Estimate the following expressions to the tenths. 54a) 10 3b) c)3 2182d) 75Estimate the following expressions to the hundredths.a) 12𝜋b) 4𝜋 103𝜋d) 16 4𝜋c)2Return to: StandardsNC Department of Public Instruction48th Grade Unpacking Document Rev. June 2018
Expressions and EquationsWork with radicals and integer exponents.NC.8.EE.1 Develop and apply the properties of integer exponents to generate equivalent numerical expressions.ClarificationChecking for UnderstandingStudents first worked with whole number exponents in 6th grade. At this grade level,Rewrite the following expressions so that each expression doesstudents will build upon that knowledge to understand the properties of integer exponentsnot contain an exponent.2322and numerical bases and patterns of repeated multiplication and division.a) 2b) 652Students use their understanding of exponents as repeated multiplication to develop and3 2c) 60d)create equivalent expressions and justify the following properties:24 53 54 53 4 57e) (32 )(34 )f) (43 )25312 25 22 3 53 4 5 1 g) ( )h) ( ) ( )5453454 (53 )4 53 4 512j) 127 12 7(32 )i) (32)(33) 53 23 (5 2)3 (10)30 5 111 5 3 3 5125Eighth grade is the first time students raise negative numbers to a power. Studentsrecognize that negative numbers raised to an even power produce different products whenparenthesis are used. For example, –42 and (–4)2 have products of –16 and 16 respectively.Students are not expected to know the names of the properties of exponents.Return to: StandardsWork with radicals and integer exponents.NC.8.EE.2 Use square root and cube root symbols to: Represent solutions to equations of the form x2 p and x3 p, where p is a positive rational number. Evaluate square roots of perfect squares and cube roots of perfect cubes for positive numbers less than or equal to 400.ClarificationChecking for UnderstandingThis standard introduces the inverse relationship between squares and square rootsList all of the possible values for x in the following equation: 𝑥 3 2163and cubes and cube roots. Students should understand that:A. 216B. 216 𝑝 is defined as the positive solution to 𝑥 2 𝑝.C. 6D. 72 3 𝑝 is defined as the solution to 𝑥 3 𝑝.Represent solutions to equations of the form x2 p and x3 p, where p is aEvaluate the following expression: 196positive rational number.In 8th grade, p is limited to be a positive rational number. In NC.8.NS.2, students learnto estimate a square root or cube root to the tenths place.Evaluate square roots of perfect squares and cube roots of perfect cubes forSolve for 𝑟 in the following equation: 𝑟 2 81positive numbers less than or equal to 400.Student should know the definition of a perfect square and that:2 𝑎2 𝑎3 𝑎3 𝑎This is the first instance students will have seen an equation with potentially 2 solutions.Return to: StandardsthNC Department of Public Instruction8 Grade Unpacking Document Rev. June 20185
Work with radicals and integer exponents.NC.8.EE.3 Use numbers expressed in scientific notation to estimate very large or very small quantities and to express how many times as much one is than theother.ClarificationChecking for UnderstandingStudents use their knowledge of the base ten number system andWrite the following into scientific notation:exponents to rewrite numbers using scientific notation. Studentsa) The distance between the sunb) The distance between the suninterpret scientific notation generated when using technology.and the Earth is 93,000,000and Neptune is 2,795,000,000Students compare numbers written in scientific notation and expressmiles.miles.the multiplicative relationship between the numbers.c) A type of fairyfly is the smallestd) An average bacterium is aboutFor example: Which of the following represents a largerknown flying insect and is only0.00004 inches long.number?0.0059 inches long.a) 1.5 109b) 7.5 107Solution: 1.5𝑥109is the larger numberFor your answer, how many times larger is your answer then thesmaller number?Solution: 1.5 109is 20 times larger than 7.5 107Notice that 1.5 is .2 times 7.5. Looking at just the 10s, 109is 100 timeslarger then 107 .(0.2)(100) 20Students should see more than just a division problem but should seethe multiplicative relationships that are unique to scientific notation.Use the information from above to answer the following questions:e) In astronomy, the distance between the sun and the Earth is known as 1 AU, orastronomical unit. Measured in AUs, what is the distance between the sun andNeptune?f) If average sized bacteria were placed in a straight line, how many of bacteriawould be needed to equal the length of the smallest known flying insect, afairyfly?Return to: StandardsWork with radicals and integer exponents.NC.8.EE.4 Perform multiplication and division with numbers expressed in scientific notation to solve real-world problems, including problems where bothdecimal and scientific notation are used.ClarificationChecking for UnderstandingStudents use the laws of exponents to multiple and divideWrite the answer to the following in both scientific and decimal notation.expressions containing numbers written in scientific and decimala) Patrice works at a museum giving tours. b) Jensen is building a snow fort. Eachnotation to solve real-world problems.Patrice would like to know how manyblock in the fort weighs about 1words she speaks in a year giving tourskilogram. Jensen hopes to makeat her job. The average person speaksabout 40 blocks for the fort. If aabout 150 words per minute. Patrice ledsnowflake weighs about 3𝑥10 3tours that were 25 minutes long, 6 timesgrams, approximatelyper day. About how many words wouldhow many snowflakes will be in thePatrice have spoken in a year?fort?NC Department of Public Instruction68thReturn to: StandardsGrade Unpacking Document Rev. June 2018
Analyze and solve linear equations and inequalities.NC.8.EE.7 Solve real-world and mathematical problems by writing and solving equations and inequalities in one variable. Recognize linear equations in one variable as having one solution, infinitely many solutions, or no solutions. Solve linear equations and inequalities including multi-step equations and inequalities with the same variable on both sides.ClarificationChecking for UnderstandingIn 7th grade, students learned to solve multistep one-variableDetermine the number of solutions for each of the following. If there is only one solution,equations and inequalities, with the variable on one side. In 8thdetermine the solution.12grade, students will build upon this understanding to solve onea) (2𝑝 9) 𝑝 5b) 5 3𝑞 4 (4.5𝑞 1.5)23variable equations and inequalities with the same variable on1212c) 8 2(𝑛 3) 𝑛 7 3𝑛d)𝑔 1 𝑔 2 (4 )both sides.5555Students recognize and explain when linear equations haveone solution, infinitely many solutions, or no solution withoutcompleting the solving process.Linear inequalities may have infinitely many solutions or noIn the following equation, a and b represent integers.solution. For example,2𝑥 𝑎 5 𝑏𝑥𝑥 5 2𝑥 8 𝑥 has no solution.What values of 𝑎 and 𝑏 would create an equation with just one solution?Students justify their answer with mathematical reasoning,What values of 𝑎 and 𝑏 would create an equation with no solutions?including the use of the properties of equality.What values of 𝑎 and 𝑏 would create an equation with infinitely many solutions?Solve the following and graph the solutions on a number line:5 2𝑦𝑦 3a) 3𝑥 2 9 5𝑥b) c)231ℎ 9 8 ( ℎ 2)3d)1542(13 20𝑥) 14 4𝑥Two companies are competing for a contract to make the programs for the high schoolfootball games. Howie’s Printing charges a 19.99 fee for printing and 0.25 for each programprinted. Mint Print charges a 29.99 fee for printing and 0.10 for each program printed.For what number of printed programs will Howie’s Printing cost more than Mint Print?a) Write and solve an inequality to describes this situation.b) Describe what your solution means.c) If you anticipate needing 75 programs for a football game, which company is thecheaper choice?Return to: StandardsNC Department of Public Instruction78th Grade Unpacking Document Rev. June 2018
Analyze and solve pairs of simultaneous linear equations.NC.8.EE.8 Analyze and solve a system of two linear equations in two variables in slope-intercept form. Understand that solutions to a system of two linear equations correspond to the points of intersection of their graphs because the point of intersectionsatisfies both equations simultaneously. Solve real-world and mathematical problems leading to systems of linear equations by graphing the equations. Solve simple cases by inspection.ClarificationChecking for UnderstandingStudents find the solution to a system of two linear equations by graphing. InPlant A and Plant B are on different watering schedules. This affects their rate8th grade, the linear equations will be limited to slope-intercept form.of growth. Plant A started at a height of 4 inches and grows 2 inches per week.Plant B started at 2 inches and grows at 4 inches per week.Understand that solutions to a system of two linear equationsa) Create a table that represents the height of each plant for each week.correspond to the points of intersection of their graphs because theb) Plot the graph of each table on the same coordinate plane.point of intersection satisfies both equations simultaneously.c) Where do the graphs of each plant growth intersect?Students can explain and demonstrate that the solution to the system ofd) What does this intersection represent?equations must be a solution to each of the equations of the system. Bye) Write an equation to represent each plant’s growth per week.comparing the graphs of a system to the corresponding equations in thef) What is the relationship between the point of intersection and thesystem, students can discover characteristics of systems that have noequation for each plant’s growth?solutions, one solution, and infinite solutions.Solve real-world and mathematical problems leading to systems of linearequations by graphing the equations. Solve simple cases by inspection.Students write a system of equations to represent a word problem. Wordproblems will be presented in a way that students can write the equationdirectly into slope-intercept form. Students recognize the structure of equationsand by inspection recognize when the equations will produce one solution, nosolution or infinitely many solutions.Find the solution to each of the following system of equations.23a) 𝑏 𝑎 1b) 𝑦 𝑥 431𝑏 𝑎 7373𝑦 𝑥 17Return to: StandardsNC Department of Public Instruction88th Grade Unpacking Document Rev. June 2018
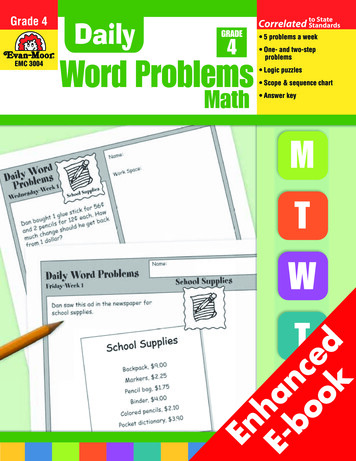
FunctionsDefine, evaluate, and compare functions.NC.8.F.1 Understand that a function is a rule that assigns to each input exactly one output. Recognize functions when graphed as the set of ordered pairs consisting of an input and exactly one corresponding output. Recognize functions given a table of values or a set of ordered pairs.ClarificationChecking for UnderstandingThis standard starts to develop the definition of a function as a rule thatWhich of the following are functions? Explain your reasoning for each.produces a unique output for each input. This understanding has beenB.C. (-5,2), (3,-5), (-3,2),A.building through students work with ratio and proportional relationships.(0,6), (-3,-2), (-5,6)In 8th grade, functions will be represented as tables, graphs, and equations.Function notation is not an expectation in 8th grade.Recognizing functions from graphs, tables, or a set of ordered pairs.Students identify graphs, tables or a set of ordered pairs that represent afunction. These graphs, tables, and ordered pairs can represent nonlinearfunctions as well as linear functions. Students justify their reasoning using thedefinition of a function and characteristics from different representations of thefunction. If the students are exposed to the vertical line test, the students areexpected to explain why it works.Return to: StandardsDefine, evaluate, and compare functions.NC.8.F.2 Compare properties of two linear functions each represented in a different way (algebraically, graphically, numerically in tables, or by verbaldescriptions).ClarificationChecking for UnderstandingThis standard focuses on comparing linear functions that may be represented Sandra is looking to buy decorative doughnuts for a party. She is consideringin different ways.two local bakers. She looks up two bakers online to find how much each oneKeeping consistent with other function standards:charges. Here arethe advertisements Linear functions represented algebraically must be given in slopeshe saw online.intercept form. Functions represented with a verbal description must be able to bea) What is the ratewritten directly into slope-intercept form.of change andStudents may convert functions to different representations to assist in theirthe boxing feecomparison.for eachdoughnut shop?Students describe the comparison of linear functions qualitatively (with words)b) If the total cost was Sandra’s biggest concern, whoand quantitatively (with numbers) by discussing and analyzing:should she buy from? Justify your answer Interceptsmathematically. Rates of change Points of intersection Other points important to the contextReturn to: StandardsNC Department of Public Instruction98thGrade Unpacking Document Rev. June 2018
Define, evaluate, and compare functionsNC.8.F.3 Identify linear functions from tables, equations, and graphs.ClarificationStudents identify a linear function from a variety of representations, includingtables, equations and graphs. As with all functions, students should view alinear function as describing a relationship between quantities. A linearfunction is unique from other functions because of the characteristics of itsrelationships, namely having a constant additive rate of change.Identifying a linear function comes from considering the rate of changebetween points that are a part of the function. Students build anunderstanding of linear functions by: Knowing that the rate of change of the function is the ratio of changein the output to the change in the input. Finding the rate of change between all points and showing that theserates of change are equivalent. Finding the rate of change between equally spaced points andshowing that these rates are the same and form an additive pattern foreach quantity (constant additive rate of change).1For example: Compare the function 𝑦 𝑥 3 with the function2𝑦 𝑥 2 1 to determine if the functions represent a linear relationship.Sample answer: Using a table to compare.1𝑦 𝑥2 1𝑦 𝑥 32xyxy0-3012-23104-1637609821In the first function, 𝑦 𝑥 3, the x’s increase by 2, the y’s increase by2the constant pattern of 1. This gives a constant additive rate of changeof 1 unit of y for each 2 units of x. This function is a linear function.Note: As long as the x’s change by a constant additive pattern, the y’s willchange at a constant additive pattern.In the second function, 𝑦 𝑥 2 1, as the x’s increase by 3, the y’sincrease but not at a constant additive pattern. This function is nonlinear.Students develop ways to see these patterns in the rate of change in bothtables and graphs and understand how a constant additive rate of changewould be represented in a linear equation. Students may see other patterns inthe rates of change as other families of functions have different patterns.In 8th grade, students identify all mathematical functions that are not linear asnonlinear functions.Checking for UnderstandingJanice and Kim noticed that both proportional relationships and linear functionsform a straight line when graphed. Janice claims that all linear functions arealso proportional relationships. Kim disagreed and tells Janice that she has itbackwards, that all proportional relationships are linear functions.a) Who is correct? Explain.b) A counterexample is when a specific example is given that disproves aclaim. Create a counterexample to disprove the false claim. Explain howyour example disproves the claim.Devon is looking at the following table. He is supposed to determine if the tablerepresents a linear function. Devon believesxythat it is a linear function because the numbers-30in the y column form a pattern of decreasing by-1-55 from one row to the next.0-10However, this table does not represent a linear1-15function.a) Explain to Devon why the table does not represent a linear function.b) Describe how you could change the values in the table so that it wouldrepresent a linear function.Determine if the functions listed below are linear or non-linear. Explainyour reasoning.4.1. 𝑦 2𝑥 2 32. 𝑦 0.25 0.5(𝑥– 2)3. 𝑦 𝑥(3 𝑥) 1Return to: StandardsNC Department of Public Instruction108thGrade Unpacking Document Rev. June 2018
Use functions to model relationships between quantities.NC.8.F.4 Analyze functions that model linear relationships. Understand that a linear relationship can be generalized by 𝑦 𝑚𝑥 𝑏. Write an equation in slope-intercept form to model a linear relationship by determining the rate of change and the initial value, given at least two (x, y)values or a graph. Construct a graph of a linear relationship given an equation in slope-intercept form. Interpret the rate of change and initial value of a linear function in terms of the situation it models, and in terms of the slope and y-intercept of its graph ora table of values.ClarificationChecking for UnderstandingxyAnalyzing linear functions is a major focus for 8th grade. In previous grades,Write an equation that models the linear relationship in the-28students have worked with proportional relationships, which are a subset oftable.02linear functions. This means that some of the properties of a proportional1-1relationship can be generalized to linear functions, while some properties arespecific to proportional relationships.Understand that a linear relationship can be generalized by 𝒚 𝒎𝒙 𝒃.In previous grades, students created tables, graphs, and equations fromproportional relationships. Students can build from this previous knowledge tothe larger generalization of linear functions.In 7th grade, students learned that in a proportionalrelationship, the y-coordinate when 𝑥 1 is the unitrate and built an understanding of the equation of aproportional relationship (see NC.7.RP.2).Write an equation that models the linear relationship in thegraph.1In 8th grade, students build on thisunderstanding to develop the linearequation in slope-intercept form.The initial small triangle starts withsides of 1 and m. As the triangle isscaled by a factor of 𝑥, the sides ofthe new triangle become 𝑥 and 𝑚𝑥.However, in order to find thecoordinate that is on the line, the ycoordinate must be increased by b, since the triangle is starting off the x-axis.This give the coordinate of (𝑥, 𝑚𝑥 𝑏). This means that when the input is 𝑥,the output is 𝑚𝑥 𝑏, producing the function, 𝑦 𝑚𝑥 𝑏. The samegeneralization can be seen in the table.In 8th grade, the only required form of a linear equation is slope-interceptform. Students will not be asked to work with other forms of a linear equationor be asked to change the other forms to slope-intercept form.NC Department of Public InstructionWrite an equation for the line that has a rate of change of and passes though2the point (-2, 5).The company charges 45 a day for the car as well as charging a one-time 25fee for the car’s navigation system (GPS). Write a function for the cost indollars, c, and the number of days, d, the car was rented.118th Grade Unpacking Document Rev. June 2018
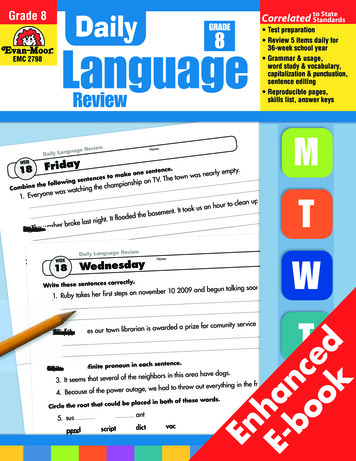
Use functions to model relationships between quantities.NC.8.F.4 Analyze functions that model linear relationships. Understand that a linear relationship can be generalized by 𝑦 𝑚𝑥 𝑏. Write an equation in slope-intercept form to model a linear relationship by determining the rate of change and the initial value, given at least two (x, y)values or a graph. Construct a graph of a linear relationship given an equation in slope-intercept form. Interpret the rate of change and initial value of a linear function in terms of the situation it models, and in terms of the slope and y-intercept of its graph ora table of values.ClarificationChecking for UnderstandingChildren’s pictures are hung in a line as seen inWrite an equation in slope-intercept form to model a linear relationshipthe picture. Pictures that are hung next to eachby determining the rate of change and the initial value, given at leastother share
8th Grade Mathematics Unpacked Contents For the new Standard Course of Study that will be effective in all North Carolina schools in the 2018-19 School Year. This document is designed to help North Carolina educators teach the 8th Grade Mathematics Standard C