Transcription
Downloaded from journal.pda.org on June 22, 2018Life Cycle Assessment of Reusable and DisposableCleanroom CoverallsEric Vozzola, Michael Overcash and Evan GriffingPDA J Pharm Sci and Tech 2018, 72 236-248Access the most recent version at doi:10.5731/pdajpst.2017.007864
Downloaded from journal.pda.org on June 22, 2018RESEARCHLife Cycle Assessment of Reusable and DisposableCleanroom CoverallsERIC VOZZOLA*, MICHAEL OVERCASH, and EVAN GRIFFINGEnvironmental Clarity, Reston, VA PDA, Inc. 2018ABSTRACT: Cleanroom garments serve a critical role in such industries as pharmaceuticals, life sciences, andsemiconductor manufacturing. These textiles are available in reusable and disposable alternatives. In this report, theenvironmental sustainability of cleanroom coveralls is examined using life cycle assessment technology. Thecomplete supply chain, manufacture, use, and end-of-life phases for reusable and disposable cleanroom coverallsare compared on a cradle-to-end-of-life cycle basis. Three industry representative coveralls are examined: a reusablewoven polyethylene terephthalate (PET) coverall, a disposable flash spunbonded high-density polyethylene (HDPE)coverall, and a disposable spunbond-meltblown-spunbond polypropylene (SMS PP) coverall. The reusable cleanroomcoverall system shows substantial improvements over both disposable cleanroom coverall systems in all environmentalimpact categories. The improvements over the disposable HDPE coverall were 34% lower process energy (PE), 23% lowernatural resource energy (NRE), 27% lower greenhouse gas (GHG) emissions, and 73% lower blue water consumption. Theimprovements over the disposable SMS PP coverall were 59% lower PE, 56% lower NRE, 57% lower GHG emissions,and 77% lower blue water consumption. In addition, the reusable system shows a 94 –96% reduction in solid waste to thelandfill from the cleanroom facility. Between the two disposable cleanroom coveralls, the flash spunbonded HDPE coverallshows a measurable environmental improvement over the SMS PP coverall.KEYWORDS: Cleanroom coveralls, Life cycle assessment, Reusable textiles, Disposable textiles, Energy reduction,Environmental sustainability.LAY ABSTRACT: Pharmaceutical drugs are manufactured and handled in controlled environments called cleanroomsto ensure the safety and quality of products. In order to maintain strict levels of cleanliness, cleanroom personnel arerequired to wear garments such as coveralls, hoods, and gloves that restrict the transfer of particles from the personto the environment. These garments are available in reusable and disposable types. Cleanroom operators consider anumber of factors when selecting between reusable and disposable garments, including price, comfort, and environmental sustainability.In this report, the environmental sustainability of reusable and disposable cleanroom coveralls is examined using atechnique called life cycle assessment. With this technique, environmental parameters such as energy use andgreenhouse gas emissions are quantified and compared for three market representative cleanroom coveralls, from rawmaterial extraction through manufacturing, use, and final disposal. Reusable coveralls were found to substantiallyoutperform disposable coveralls in all environmental parameters examined. This is an important conclusion thatsupports cleanroom companies that select reusable coveralls to be more sustainable.IntroductionCleanroom garments are worn to maintain a controlled, low level of contamination in a manufacturing* Corresponding author: Environmental Clarity 2505Fauquier Ln, Reston, VA 20191. Telephone: 954-6292418; e-mail evozzola@environmentalclarity.comdoi: 10.5731/pdajpst.2017.007864236environment, serving a critical role in industries suchas pharmaceutical and semiconductor manufacturing.For example, a typical 1000 ft3 indoor room may containover 200 million particles greater than 1 micrometer indiameter. A cleanroom of this size may be required tocontain fewer than 20,000 such particles (1).According to the McIlvaine Company (Northfield, IL)(2), the cleanroom hardware and consumables industrygenerated over 10 billion in annual revenues in 2011,PDA Journal of Pharmaceutical Science and Technology
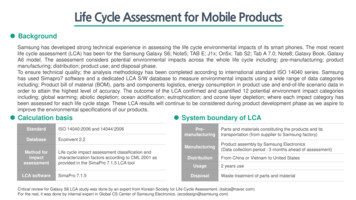
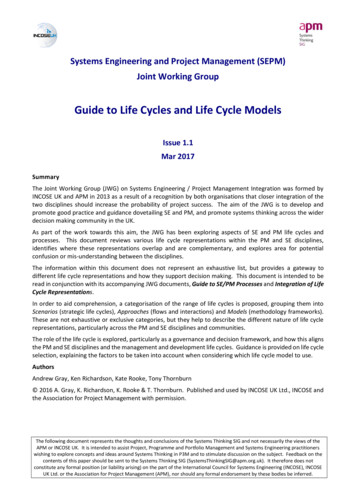
Downloaded from journal.pda.org on June 22, 2018ter environmental profiles than the disposable systems.However, the analysis of these available life cycle datais often limited by the transparency and depth of information in these respective reports. Additionally, the previous reports focus on the healthcare industry, which hasdifferent requirements and practices than the cleanroomindustry.Figure 1Life cycle scope for product analysis.which includes over 1 billion in revenues from reusable and disposable clothing. Revenues from reusableand disposable coveralls were about equal. Eudy (3)found that the decision to use reusable or disposablegarments in a cleanroom depends on a number offactors, including the product being manufactured, themanufacturing processes employed, economics, andenvironmental performance.The most common technique used to evaluate theenvironmental benefits and impacts of products is alife cycle assessment (LCA). The International Standards Organization, in ISO 14040 (4), provides bestpractice guidelines for LCA. Relevant environmentalaspects of the life cycle include raw material extraction and acquisition, energy and material production,product manufacturing, use, end-of-life treatment, andfinal disposal. The backbone of LCA is the life cycleinventory (LCI), an analysis of material and energyflows resulting from all phases of the product lifecycle. Each manufacturing plant or node in the supplychain is referred to as a gate-to-gate (GTG) life cycleinventory. The GTG LCIs are added together to give acradle-to-gate (CTG) life cycle inventory. The CTGLCI is the summation of GTG LCIs from naturalmaterials in the earth to the final product, such as acleanroom garment. The full life cycle inventory of acleanroom garment encompasses a full cradle-to-end-oflife (CTEOL) profile as illustrated in Figure 1.A number of comparative life cycle studies of reusableand disposable textiles have been performed over thepast two decades. McDowell (5), Carre (6), van deBerghe and Zimmer (7), and Overcash (8) comparedreusable and disposable surgical gowns. Jewell andWentsel (9) compared reusable and disposable hospital isolation gowns, automotive wipers, and restaurantnapkins. All five of these life cycle studies found thatthe reusable textile systems provided substantially betVol. 72, No. 3, May–June 2018This paper is an LCA of reusable and disposablecleanroom garments. All data are transparent and nonproprietary. Full life cycle inventories and the extensive LCA are available from Environmental Clarity.The authors believe this is the most comprehensiveenvironmental comparison of cleanroom coveralls yetproduced.Goal and ScopeThe goal of this LCA was to compare market representative reusable and disposable cleanroom coveralls.The basis of comparison, or functional unit, was 1000garment uses. Inventory and impact assessment metrics used to evaluate environmental performance wereprocess energy consumption, natural resource energyconsumption, greenhouse gas (GHG) emissions, waterconsumption (blue water), and solid waste from cleanroom facilities.In this study a cleanroom coverall was defined as asingle-piece, long-sleeve, extra-large zip-up garment.The coverall did not include a hood, gloves, or booties. Three market representative cleanroom coverallswere selected for comparison based on input from theAmerican Reusable Textile Association (ARTA). Onereusable coverall was investigated, a 370 g (0.816 lb)woven polyethylene terephthalate (PET) coverall.Two disposable coveralls were investigated, a 158 g(0.348 lb) nonwoven spunbonded high-density polyethylene (HDPE) coverall and a 225 g (0.496 lb)nonwoven spunbond-meltblown-spunbond polypropylene (SMS PP) coverall. The life cycle inventoriesdid not represent specific coverall brands but wereconsidered representative of coveralls commonly usedin large-scale cleanroom operations. For both reusableand disposable coverall uses, 60% were supplied aslaundered to cleanroom standards and the remaining40% were supplied as laundered and sterilized garments. This was judged to be representative of themarket by ARTA.The scope was cradle to end of life. The use phaseincluded laundry with municipal wastewater treat237
Downloaded from journal.pda.org on June 22, 2018ment, sterilization for a portion of the coveralls, andtransportation. The end-of-life (EOL) phase includedlandfill for disposable coveralls and reuse in otherindustries for reusable coveralls.Disposable cleanroom coveralls were assumed to havethe fabric, the fabric supply chain, and the cut, sew,and trim operations in China. Reusable cleanroomcoveralls were assumed to have these operations in theU.S. and Mexico. These assumptions were made basedon data from previous surgical gown life cycle studiesby Carre (6) and van de Berghe and Zimmer (7).Reusable and disposable coveralls have substantiallydifferent EOL pathways. The coveralls are syntheticpolymer fabrics and ultimately, whether reusable ordisposable, will be landfilled. The EOL boundary forreusable cleanroom coveralls included the generalpractice of donating these textiles to countries whereuse as coveralls or other garments continues. Thispractice creates an environmental benefit equal to theenergy avoided by not manufacturing these garments.However, by conventional life cycle standards thecredit associated with this benefit is attributed to theclinic or distributing company that collects and reusesthe coveralls. Therefore, the collection and reuse activities and credits were outside of the boundary ofthis study. The eventual landfill activities were alsooutside of the boundary of this study.The cleanroom coverall life cycle data were separatedinto six categories to allow transparent comparison:1. Coverall manufacturing CTG,2. Packaging manufacturing CTG,3. Use phase laundry GTG,4. Use phase gamma sterilization GTG,5. Use phase transport, and6. End-of-life.MethodologyThe total energy for each GTG LCI was subdividedinto six subcategories:1. Electricity,2382. Steam—typically used in the heating range of 25–207 C (77– 405 F),3. Dowtherm—typically used in the heating range of207– 400 C (405–752 F),4. Non-transport direct use of fuel—typically used inthe heating range above 400 C (752 F),5. Transport fuel, and6. Heat potential recovery—reflecting significant heatintegration in plants and is a negative energy value,which lowered the net or total plant manufacturingenergy.In this study the energy data were provided for twotypes of total energy:1. Process energy—the direct energy consumed by theprocess in each of the supply chain chemical andmaterial plants. This energy relates to the distinctive unit processes such as reactors and distillationcolumns required for each GTG LCI. The processenergy is determined directly in relation to the unitprocesses and reflects the direct process energy aspurchased at plants; and2. Natural resource energy (NRE)—the total cumulative energy of all fuels used to produce each of thesix process energies listed above. The natural resource energy is calculated from the process energyby including the higher heating value (HHV) offuel combusted per unit of energy transferred to theprocess, that is, efficiency, plus the energy used todeliver fuel to the point of use, often known aspre-combustion energy or delivered energy. Thefactors used for efficiency and pre-combustion areshown in Table I as scale-up factors and can thus beused to convert, in a transparent fashion, processenergy into natural resource energy. These factorscan be changed by the reader and a clear effect seenon the results.The life cycle impact assessment (LCIA) combinedthe LCI process emissions and the emissions of energygeneration in order to evaluate total impact on theenvironment. One of the impact categories studied wasGHG emissions, also known as global warming potential (GWP), expressed as carbon dioxide equivalent(CO2eq). The GHG emissions can be estimated byusing the representative ratio of 0.06 kg CO2eq/MJPDA Journal of Pharmaceutical Science and Technology
Downloaded from journal.pda.org on June 22, 2018TABLE IScale-Up Factors from Process Energy to Natural Resource Energy (NRE)Scale-Up FactorsPrecombustion Factors,MJ Fuel Extracted perMJ Delivered (The Excessis Consumed in Delivery)Generation/CombustionFactors, MJ HHV FuelDelivered per MJEnergy to .15**1.25Non-transport direct1.15**1.00use of fuelTransport fuel1.201.00Heat potential recovery1.15**1.25Coal1.20Natural gas1.10Crude oil1.20* Half coal, half nuclear with no delivery; ** half fuel oil, half natural gas.Total Scale UpFactor (PrecombustionTimes Generation/Combustion)3.441.441.441.151.201.44NRE [0.476 pounds per kilowatt-hour (lb/kWh)] combustion. Note that in the results tables, a more detailedcalculation with conversion factors specific to eachenergy type was used. The GHG emissions includedemissions from all combustion processes for energyproduction plus any process emissions of GHGs expressed as units of CO2eq (methane 25, nitrousoxide 298, carbon dioxide 1).the LCI) to which an industry may discharge wastewater that is subsequently treated to the required levels. It was further assumed that industry and municipalities are in compliance with these permits, as thesewaters are returned to surface water resources. Thusfor most chemical and materials manufacturing GTGLCI, the water utilization assessment categories ofdirect relevance are the following:Another impact category studied was water consumption. For coveralls, water use occurred in the manufacturing supply chain and the laundry phase. The lifecycle evaluation of water consumption in individualmanufacturing plants must be more transparent thansimply a catalogue of water supplied to or wastewatersent from such facilities. Water utilized in manufacturingGTG LCIs included water utilized in steam heating andcooling water circulations, water that came in directcontact with chemical reactions and separations, andwater consumed or produced in chemical reactions.1. Gray water—the water, if any, used to dilute pollutants in a wastewater treatment plant to producean effluent meeting the regulated standard concentrations for discharge to surface water. The assumption of compliance with wastewater treatmentplant permit requirements means that gray water iszero for many manufacturing processes, since regulated standards for water discharge are alreadymet. In other words, much manufacturing water useis rented water, as it is returned in acceptablecondition after use and discharged to surface waters and is thus not consumed; andThese categories of water were utilized to establishwater use based on principles developed by Aviso etal. (10) for water footprint assessment. The criticalassumption for this water assessment was that contaminated water is sent to treatment plants that use physical and biological means to restore the water to regulatory standards for safe human contact and areaccounted for in the LCI. These federal and statestandards are used to issue permits for discharge tosurface waters in the U.S. These standards also applyto municipal wastewater treatment plants (included inVol. 72, No. 3, May–June 20182. Blue water—the water evaporated or incorporatedinto the product. These losses are water not directlyavailable locally to replenish surface waters. Thereturn of water due to rainfall from this evaporatedwater is not considered sufficient for the waterbalance of the manufacturing plant and thus isconsidered blue water or consumed water.The analysis of water consumption of each manufacturing plant GTG LCI also included the requisite239
Downloaded from journal.pda.org on June 22, 2018wastewater treatment plant for achieving regulateddischarge standards. This manufacturing plant boundary allowed the water consumption to include onlyblue water, and thus was substantially less than watermetered to the plant, the typical method for evaluatingwater consumption.At this level of transparency and detail the reader mustcarefully look at each type of information and systemto understand the full life cycle results. This level ofdata also allows the reader to more easily utilize thesedata for other analyses, such as varying the coverallmaterials, weights, or frequency of uses. In addition,each coverall manufacturer can choose to modify theseresults for its specific products.Basis for Reusable Cleanroom Coverall LCIThe functional unit was 1000 coverall uses in cleanrooms. The number of reusable coveralls manufacturedwas determined by the average number of cycles. Basedon a survey of ARTA members, sterilized coveralls areused for about 40 cycles, and non-sterilized coveralls areused for about 60 cycles, prior to being removed fromservice. Note that in practice, non-sterilized coveralls areoften used for 75 to 100 or more cycles. However, for thepurposes of this LCA, a use rate of 60 cycles wasselected as a conservative estimate of non-sterilized coverall life. Also based on a survey of ARTA members,40% of reusable coverall uses were supplied as sterilizedand the remaining 60% of uses were not sterilized. Theharmonic mean was used to calculate an average reuserate of 50 cycles per coverall. Thus 20 new coverallswere manufactured to provide 1000 coverall uses, but1000 coveralls were evaluated through the reuse cycle.The components for the reusable cleanroom coverallsystem were as follows:1. Manufacture and transport of 20 reusable cleanroom coveralls, CTG2. Manufacture and transport of primary, secondary,and tertiary (PST) packaging, 1000 coverall uses, CTG6. Gamma sterilization process for 40% of 1000 coverall uses (400 sterilization cycles), CTG7. Manufacture of radioactive source of cobalt-60 for400 sterilization cycles, CTG8. EOL phase, reuse in other textile industries, GTG,disposal was excluded9. Use phase transportation, GTGBasis for Disposable Cleanroom Coverall LCIThe functional unit for cleanroom coveralls was 1000coverall uses, which for the disposable system was1000 new coveralls. The components for the disposable cleanroom coverall systems were as follows:1. Manufacture and transport of 1000 disposablecleanroom coveralls, CTG2. Manufacture and transport of PST packaging for1000 coveralls, CTG3. Laundry process for 1000 coveralls, CTG (because manufactured coveralls do not meet cleanroom standards)4. Production of water used for laundry process for1000 coveralls, CTG5. Wastewater treatment of the organic burden fromthe laundry process for 1000 new coveralls, CTG6. Gamma sterilization process for 40% of 1000coveralls (400 sterilization cycles), CTG7. Manufacture of the radioactive source of cobalt-60 for 400 sterilization cycles, CTG8. EOL phase, landfill process for 1000 coveralls,GTG9. EOL phase, landfill process for biological soilfound on 1000 used coveralls, GTG3. Laundry process for 1000 coverall uses, CTG10. Use phase transportation, GTG4. Production of water used for laundry process for1000 coverall uses, CTGResults5. Wastewater treatment of the organic burden fromthe laundry process for 1000 coverall uses, CTGAll results are reported for a functional unit of 1000cleanroom coverall uses. The results from the LCI and240PDA Journal of Pharmaceutical Science and Technology
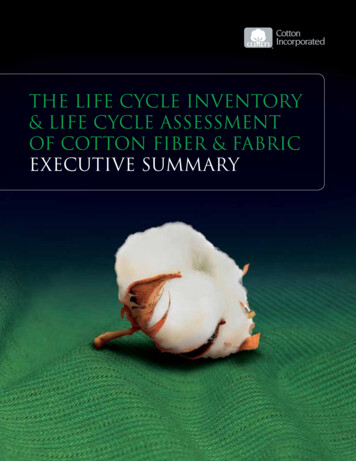
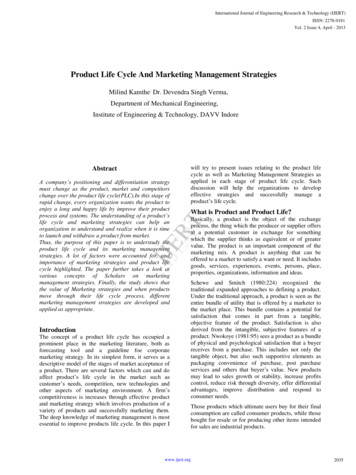
Downloaded from journal.pda.org on June 22, 2018TABLE IICradle-to-End-of-Life (CTEOL) Evaluation of Reusable (50 Uses/Coverall) and Disposable CleanroomCoverallsCTEOL eductionfrom SelectingReusableProcess energy, MJ (kWh)/1000 uses4560 (1270)6930 (1930) 11,100 (3080)34–59%Natural resource energy, MJ (kWh)/1000 uses8380 (2330) 10,900 (3030) 19,200 (5330)23–56%517 (1140)712 (1570) 1220 (2690)27–58%Carbon footprint, kg (lb) CO2eq/1000 usesWater consumption, blue water*, kg (lb)/1000 uses 80.7 (178)304 (670)345 (761)73–77%Cleanroom facility solid waste generation10.2 (22.5)**171 (377)238 (525)94–96%for disposal, kg (lb)/1000 uses* Solid waste includes disposable coveralls, biological waste, and plastic and paper packaging. Note that corrugatedboxboard was not included as solid waste for any coveralls as it was considered 100% recycled.** In this life cycle study, 100% of reusable cleanroom coveralls were reused in other industries at the EOL stage andtherefore not included as solid waste. The EOL recycle rate had a small impact on the life cycle inventory; if 100%of reusable cleanroom coveralls were instead landfilled, the cleanroom facility solid waste generation was 17.6 kg(38.8 lb) per 1000 coverall uses, a 90 –93% reduction in solid waste compared to the disposable systems.LCIA are summarized in Table II, Figure 2, and Figure3. The energy consumption, GHG emissions, waterconsumption, and solid waste disposal for the reusablecleanroom coverall CTEOL system was substantiallylower than either of the disposable systems (Table II).Coverall Manufacturing CTGReusable and disposable cleanroom coveralls eachhave one principal fabric material and a zipper. Thefabric and zipper are assembled into a coverall with acut, sew, and trim operation.The reusable coverall CTG LCI consisted of the following on a 1000 use basis: 7.04 kg (15.5 lb) woven PET fabric CTG LCI 0.356 kg (0.785 lb) nylon 6 pellet for zipper CTGLCI 7.40 kg (16.3 lb) cut, sew, and trim GTG LCISome reusable cleanroom coveralls contain less than1% by weight carbon fiber additive as an anti-staticagent. The carbon fiber was considered to be an ancillary input and was excluded from this study. Inclusion of carbon fiber is expected to have an impact ofless than 0.2% on LCA parameters such as GHGemissions.Vol. 72, No. 3, May–June 2018The disposable HDPE coverall CTG LCI consisted ofthe following on a 1000 use basis: 151 kg (333 lb) flash spunbonded HDPE fabricCTG LCI 6.75 kg (14.9 lb) nylon 6 pellet for zipper CTGLCI 158 kg (348 lb) cut, sew, and trim GTG LCIThe disposable polypropylene (PP) coverall consistedof the following on a 1000 use basis: 215 kg (474 lb) SMS PP fabric CTG LCI 9.76 kg (21.5 lb) nylon 6 pellet CTG LCI 225 kg (496 lb) cut, sew, and trim GTG LCITable III includes a comparison of the cleanroom coverall and supply chain manufacturing CTG. The reusablecoveralls used substantially less energy in the manufacturing stage, as only one reusable coverall was manufactured for every 50 disposable coveralls.Packaging Manufacturing CTGReusable and disposable cleanroom coveralls require avariety of packaging to deliver the products to clean241
Downloaded from journal.pda.org on June 22, 2018Figure 2CTEOL NRE evaluation of reusable and disposable cleanroom coveralls.rooms. In this LCA, the packaging containers andinserts were measured from practice. It was recognized that variations in the packaging materials occuracross the broad range of supply companies. The packaging materials analyzed in the study were representative materials and thus allow an understanding of thelife cycle issues of cleanroom coverall packaging. Thepackaging was subdivided into primary, secondary,and tertiary:and secondary packaging. Note that wood palletsare not considered a material input or output due tocommon reuse and recycling patterns.The reusable coverall packaging CTG LCI consistedof the following on a 1000 use basis: 7.50 kg (16.5 lb) HDPE outer bag CTG LCI usedin primary packaging1. Primary—The bags, wraps, and labels used to preserve and identify the cleanroom coveralls until thepoint of use. 2.74 kg (6.04 lb) low-density polyethylene (LDPE)sheet CTG LCI used in secondary and tertiarypackaging2. Secondary—The containers used to ship and handlethe coveralls that already have primary packaging. 0.840 kg (1.85 lb) corrugated box CTG LCI usedin secondary packaging3. Tertiary—The pallets and pallet wrap used to shipand handle the coveralls that already have primary 0.245 kg (0.540 lb) plastic tote CTG LCI used insecondary packaging242PDA Journal of Pharmaceutical Science and Technology
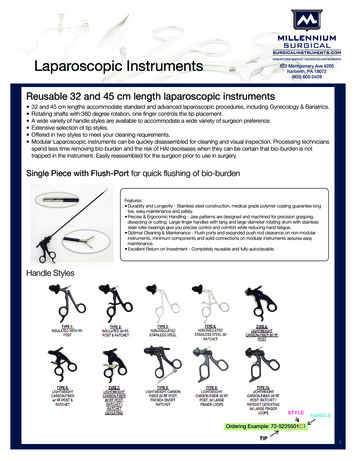
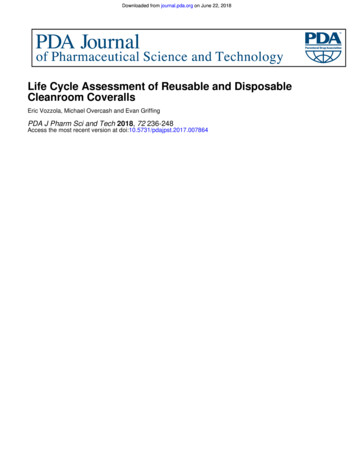
Downloaded from journal.pda.org on June 22, 2018Figure 3CTEOL blue water evaluation of reusable and disposable cleanroom coveralls.The two disposable coverall packaging materials wereidentical on a 1000 use basis: 33.6 kg (74.1 lb) corrugated box CTG LCI used insecondary packaging 9.70 kg (21.4lb) HDPE outer bag CTG LCI used inprimary packagingeralls. This is due to a substantial reduction incorrugated boxboard, because the reusable coverallsare transported in reusable plastic totes with eachuse.Use Phase 3.12 kg (6.88 lb) insert paper CTG LCI used inprimary packaging 0.0280 kg (0.0617 lb) LDPE sheet used in tertiarypackagingTable III includes a comparison of the cleanroomcoverall packaging manufacturing CTG results. Thepackaging energy and GWP for reusable coverallswere less than one-half of that for disposable covVol. 72, No. 3, May–June 2018The cleanroom coverall use phase includes laundryand sterilization of reusable and disposable coverallsbecause the manufacturing of coveralls does not meetcleanroom standards. The weight of the coverall wasthe only factor that differentiated overall energy consumption in the use phase. The typical laundry processfor cleanroom coveralls is a combination of washingand drying, consuming energy as electricity andnatural gas on a 1000 use basis. The laundry waterconsumption, chemical consumption, and energy consumption were assumed to be constant per unit weightcoverall. Thus, the weight of the coverall was a major243
Downloaded from journal.pda.org on June 22, 2018TABLE IIISummary of Natural Resource Energy (NRE) Consumption and GHG Emissions for Cleanroom CoverallCradle-to-End-of-Life (CTEOL) by Life Cycle ComponentNRE ConsumptionMJ (kWh)/1000% of CTEOLCoverall UsesNRE1. Coverall and supply chainmanufacturing CTGReusable PETDisposable HDPEDisposable PP2. Packaging manufacturingCTGReusable PETDisposable HDPEDisposable PP3. Laundry process CTGReusable PETDisposable HDPEDisposable PP4. Sterilization process CTGReusable PETDisposable HDPEDisposable PP5. Use phase transportReusable PETDisposable HDPEDisposable PP6. EOLReusable PETDisposable HDPEDisposable PP1790 (497)6130 (1700)12,900 (3580)355 (98.6)792 (220)792 (220)5560 (1540)2370 (658)3380 (939)17.4 (4.83)7.41 (2.06)10.6 (2.94)661 (184)1530 (425)2030 (564)0 (0)86.1 (23.9)123 (34.2)factor in the LCI data for the laundry process. Thelaundry process was evaluated with field data formetered water consumption and measured chemicaloxygen demand (COD) in wastewater. The laundryprocess uses about 13,000 mass parts water to 1000mass parts laundry. Over 99% of this water is sent toa wastewater treatment plant and returned to regulatedlevels acceptable for human exposure. Therefore, onlythe evaporative losses, or blue water, were included asa water impact. The evaporative losses were measuredin the field at two sites as the difference between wetcoveralls and dry coveralls before and after drying andwere approximately 0.25% by weight of the overalllaundry system water consumption. The wet coverallscontained about 3% water by weight. Measurement of244215667GHG Emissions% of CTEOLkg (lb) CO2eq/1000Coverall UsesGHG115 (254)414 (913)823 (1810)4.27.34.122.8 (50.3)48.4 (107)48.4 (107)662218336 (741)143 (315)204 (450)0.210.0680.0557.914111.08 (2.38)0.461 (1.02)0.657 (1.45)42.1 (92.8)99.9 (220)132 (291)00.790.640 (0)6.19 (13.6)8.35 .870.69COD at a reusable cleanroom coverall laundry facilitydetermined a wastewater COD of about 300 ppm. Thewastewater treatment plant CTG LCI used the CODload as the link to the energy consumption and effluents from the process. This was based on the microbialtreatment mechanisms and the analysis of JimenezGonzalez and Overcash (11).The coverall laundry CTG LCI consisted of the following on a 1000 kg (2200 lb) laundered basis: 13,000 kg (28,700 lb) metered water CTG LCI䡩Note evaporative losses of water, blue water,were 32.5 kg (71.7 lb)PDA Journal of Pharmaceutical Science and Technology
Downloaded from journal.pda.org on June 22, 2018 3.89 kg (8.58 lb) COD treatment CTG LCI 1000 kg (2200 lb) coveralls to laundry processGTG LCIForty percent of cleanroom coveralls are sterilizedafter the laundry process, based on the industry use ofsuch coveralls. The typical sterilization process forreusable and disposable cleanroom coveralls is gammasterilization with radioactive cobalt-60. The CTG LCIfor gamma sterilization is conducted using field procedures and nuclear decay equations as discussed byZyball (12), Sinco (13), and da Silva Aquino (14).The coverall sterilization CTG LCI consisted of thefollowing on a 1000 kg (2200 lb) sterilized basis: 0.000153 kg (0.000337 lb) cobalt-60 source CTGLCI5. One-way transport of coveralls from the cleanrooms to the landfill or point of reuse (EOL)Within the supply chain for cleanroom coverall manufacture, most GTG LCIs were assigned a defaulttransport distance of 531 km (330 miles), as the U.S.average distance for shipping industrial chemicalsbased on the Statistical Abstract of the United States:1997 (U.S. Census Bureau). Use phase transports wereincluded in the use phase transport CTG and areshown in the transport category in Figure 2. Transportimpacts associated with manufacturing were includedin the coverall and packaging manufacturing results.Transport impacts associated with EOL landfilling wereincluded in the EOL results.The reusable coverall use phase transport LCI consisted of the following on a 1000 use basis: 8.39 kg (18.5 lb) coveralls and packaging transported 6960 km (4320 miles) by truck from manufacturer to cleanroom 626 kg (1380 lb) coveralls and packaging transported 113 km (70.2 miles) by truck for round-triptransport to laundry facility 250 kg (551 lb) coveralls and packaging transported
Cleanroom Coveralls ERIC VOZZOLA*, MICHAEL OVERCASH, and EVAN GRIFFING Environmental Clarity, Reston, VA PDA, Inc. 2018 ABSTRACT: Cleanroom garments serve a critical role in such industries aspharmaceuticals, life sciences, and semiconductor manufacturing. These textiles are available in reusable and disposable alternatives. In this report, the