Transcription
Technical University of MunichSchool of Life Sciences WeihenstephanChair of Wood ResearchLife Cycle Assessment of a Reusable Takeaway ContainerSubmitted in fulfillment of the requirements for the course:“Creation of a Life Cycle Assessment Study Using LCA Software”Maria PlasoianuStudent-ID: 03718974Examiner: Dr. rer. agr. Omar HijaziDate Submitted: August 31, 2021
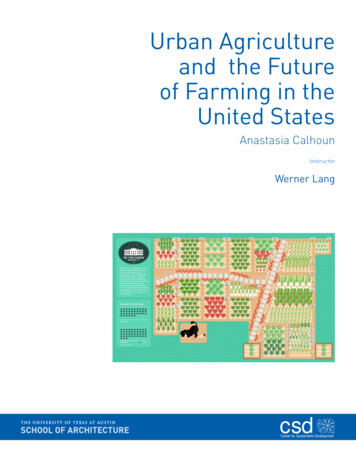
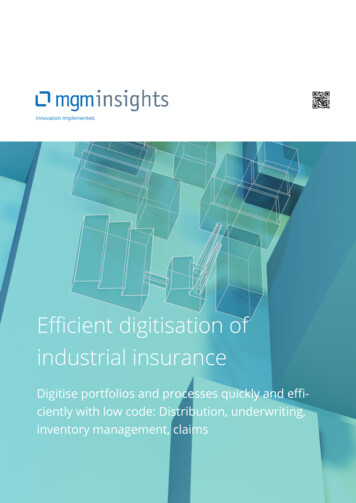
1. IntroductionThe consumption of takeaway food has increased rapidly over the past years. Especially sincethe COVID-19 pandemic, it has been more popular than ever (Mahy, 2021). While takeawayfood is a convenient option for many, there are some environmental concerns associated withit. Normal plastic takeaway containers are made only for a single use, adding 59% to the annualplastic trash in Germany (NABU, 2020). An attempt to fight plastic pollution is being made bythe European Union and its 2019 directive on the “reduction of the impact of certain plasticproducts on the environment”, which states that single-use plastic will be no longer allowed forsale unless there is no adequate, reusable alternative (Directive (EU) 2019/904). As a responseto this directive and the underlying issue, an increasing number of start-ups has been foundedover the last years, offering a simple solution: reusable takeaway containers (RTC) to borrowand return to the restaurant, in exchange for a small deposit. “Relevo”, “Vytal” and “Rebowl”,just to name a few, are some of the above-mentioned start-ups in Germany. While there isscientific literature about the concerns of single-use plastic containers, only few assess the fullLife Cycle (LCA) of these (Gallego-Schmid et al., 2019). At the same time, while Life Cyclesof reusable containers do exist, most of them focus on containers made from PP, PET or PT,often originating from countries like the US or China (e.g. Woods and Bakshi, 2014; Pottingand van der Harst, 2015; Vercalsteren et al., 2010). The fact that many RTCs are made fromthese three materials makes those studies very meaningful. Nevertheless, a number of start-upsfocuses on the use of alternative materials that are produced locally, which makes theconduction of a LCA about them necessary, too.2. Goal of the StudyIn a first step, this study aims at assessing the life cycle of RTCs made from styrene-acrylonitrile(SAN) with a Thermoplastic Elastomere (TPE) lid, which are manufactured and sold inGermany (Fig. 1). Since not only the demand for takeaway food, but also for a more sustainablefuture are on the rise, and since an increasing number of these kinds of relatively new start-upsare being established, it is important to be able to quantify the environmental impacts andbenefits they offer.Secondly, the environmental impact of RTCs made from SAN will be compared to theenvironmental impact of single-use containers (Aluminium takeaway container and Extrudedpolystyrene takeaway container) as well as a Polypropylene (PP) reusable food saver(Tupperware) from the EU. This step is designed to quantify the benefit of the use of RTCs2
compared to single-use containers. Furthermore, it is supposed to demonstrate whether SANholds any benefit compared to PP.Fig. 1: The container with lid to be analyzed.The intended study specifically refers to containers made from SAN paired with a TPE lid,which are manufactured, sold and used in Germany. The respective materials stem from theNetherlands and Germany. This study can be transferred to similar materials stemming fromthe EU and being distributed and used locally. However, it cannot be transferred to stronglydiffering materials with a different manufacturing processes, or transportation distances whichare much longer.The necessary data has been collected through collaboration with the manufacturer of thecontainers “Ornamin” as well as the start-up “Relevo”, which distributes the containers topartnering restaurants. This study is designed to address four groups: 1. Consumers who are onthe lookout for a more sustainable alternative to takeaway food, 2. Restaurants that are hesitantabout whether to collaborate with these kinds of start-ups and are also looking for a moresustainable option, 3. Arising start-ups which are unsure about which kind of material for thecontainers to choose (e.g. SAN vs. PP), and 4. Producers who want to know which part(s) ofthe production process are the most (least) impactful and yet to be improved.3. Scope DefinitionThe product system to be studied is the production, distribution, packaging, usage and end oflife of a 670ml bowl (SAN) with lid (TPE) from Ornamin. The Functional Unit (FU) is theproduction, use and disposal of a container storing a meal for one person (670ml).The impact categories to be considered are abiotic depletion potential of elements (ADPe.),abiotic depletion potential of fossil resources (ADPf.), acidification potential (AP),eutrophication potential (EP), global warming potential (GWP), human toxicity potential(HTP), marine aquatic ecotoxicity poten- tial (MAETP), freshwater aquatic ecotoxicity3
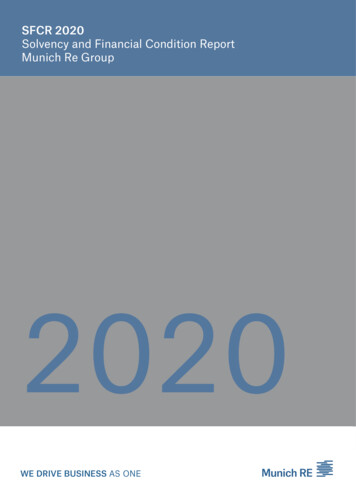
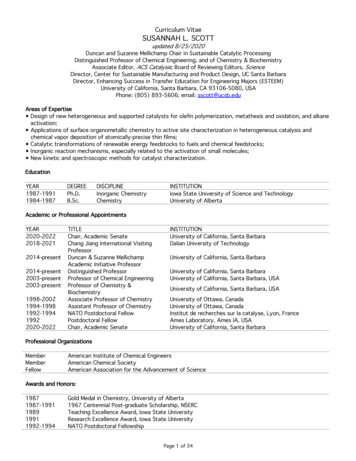
potential (FAETP), ozone depletion potential (ODP), photochemical oxidants creation potential(POCP) and the terrestrial ecotoxicity potential (TETP). The container size, FU and impactcategories are identical with the ones from the LCA to be compared, in order to assure a propercomparison (Gallego-Schmid et al, 2019). The LCI data is mainly primary data from theproviders to reach a high representativeness. Some background data from the LCA softwarehas been used, too. For a high representativeness of the background data, comparisons withother literature have been made.The LCA software used is OpenLCA 1.10.3 with the Ecoinvent 3.5 database. The LCA is donein accordance with the official guidelines on LCAs ISO14040 and ISO14044. The default“Allocation at the Point of Substitution” setting has been chosen, meaning that it follows theattributional approach (source: Ecoinvent). The LCIA model “CML-IA baseline” has beenchosen in accordance with the comparing study. The system boundaries of the study are shownin Fig. 2. The following items are included: Raw Materials:o Styrene-Acrylonitrile Copolymer (SAN, for the container)o Acrylonitrile-Butadiene-Styrene Copolymer (ABSC; similar to TPE, for the lid)o Cardboard and paper for packagingProduction:o Injection molding (container and lid)Transport:o Raw materials to production site (materials for container and lid separately)o Containers with lid to start-up location (distributor)o Distribution to restaurantso Used containers back to production site for recyclingUse:o Washing with industrial dishwasherEnd of Life:o On-site recycling of the containerso Disposal of packaging materialsFor the lid, ABSC was used instead of TPE, since the Ecoinvent database did not contain theraw material TPE. Therefore, literature using the same database was successfully searched forpossible materials representing TPE (Johansson, 2018). Furthermore, the database did notcontain the recycling process of SAN and TPE, wherefore a similar material (PolyethyleneTerephthalate) was taken into account. The transport of the individual consumer to and fromthe restaurant to pick up and return the RTC is not considered. This corresponds with the study4
of comparison (Gallego-Schmid et al, 2019). Lastly, no data for the use of industrialdishwashers was given, for which reason the same inputs and amounts as in the comparativestudy were taken into account. These are: electricity, water, soap, salt and rinsing agent(Gallego-Schmid et al., 2019). The foreground system consists solely of data from themanufacturer, since it was the main source of data (Fig. 2). While the process “Packaging”appears in the system boundary, it is not taken into consideration in the life cycle inventory datasheet (Tab. 1), since it is done by hand and therefore not further relevant for the assessment ofenvironmental impacts.Fig. 2: System Boundary for the container with lid.4. Life Cycle Inventory AnalysisThe following life cycle stages have been considered in this study: Raw Materials, Transport,Production, Use and End of life (see Tab. 1).The raw materials are SAN (called “styrene-acrylonitrile copolymer” in the Ecoinventdatabase) for the container and TPE (called “acrylonitrile-butadiene-styrene copolymer” inEcoinvent) for the lid. They both refer to Europe, and the quantities for each are given by theproducer. The SAN is supplied from Hoek, The Netherlands, and the TPE is supplied fromWesel, Germany. The packaging materials paper and cardboard are available in the Ecoinventdatabase as “paper, woodfree, uncoated” and “corrugated board box”. For both, the market forEurope has been selected, as it also includes the average transport from the paper/board boxfactory to the using end (in this case, the RTC production site). The amounts are again providedby the producer.There are four types of transport included in this study:5
1. The transport of the raw materials to the production site, which consists of 368 km for theSAN and 213km for the TPE, both with a 40t truck.2. Transport of the finished product from production site (Minden, Germany) to the start-up(Munich, Germany), resulting in a distance of 638 km with a 40t truck.3. Transport of the RTC from the start-up location to partnering restaurants. Primary data wasobtained and a mean distance of 346.3 km calculated. The chosen vehicle is a 12t truck, whichis an estimated value based on official information from DHL.4. Transporting the used RTC back to the initial production site (Minden), where the materialsare 100% recycled in-house. All necessary information about the distances and almost allinformation about the trucks were provided by the producer and start-up, which is why it hasquite a high certainty. The EURO6 emission standards are considered here.Life Cycle StageMaterial NameValue&UnitSourceRaw MaterialsSAN121.5ginternalTPE49.59gRaw ansportRaw Materials: Transport toproduction site with lorry, 40t55.27467kg*kmFinished container with lid:Transport to start-up location withlorry, 40tFinished container with lid:Distribution to partnering restaurantswith lorry, 12tUsed container with lid: Transportback to prduction site for recyclingwith lorry, 40t152.79743kg*kmProductionUse (machinedishwashing)End of Lifeinternalinternal82.93691kg*kmfrom start-up152.79743kg*kminternalContainer Injection molding:ElectricityLid Injection molding: Electricity0.37906MJBackground dataElectricity57.5JSoap0.2gSalt0.2gRinsing agent0.03gTap water0.2LRecycling SAN121.5gRecycling TPE49.59gPaper, recycling56.25gCardboard, recycling12.1544g0.15471MJComparative study(Gallego-Schmid et al,2019)internalBackground dataTab. 1: Life cycle inventory data for all life cycle stages.6
For the production, the method of injection molding is used for both the container and lid. Here,the given values from the producer and the process in the Ecoinvent database could not bematched well, which is why the default values for the injection molding of 121.5 49.59g ofmaterial are being used. This might lead to slightly different outcomes, for which reason thisstep is to be seen as an exemplary one in the first part of the study, and it will not be emphasizedmuch in the second comparison part.Since no representative primary data for the use of the RTCs was available, the same values asfor the reusable containers of the comparative study have been taken on. These includeelectricity, soap, salt (“sodium chloride, powder”), rinsing agent (“sodium tripolyphosphate”)and tap water. Again, since this is not primary data, it is prone to some uncertainty. For the endof life of the product, the RTCs are sent back to the producer, where they are fully recycled intoindustrial pipes in-house. The paper and cardboard are both recycled by the start-up. While thisinformation comes from internal data, the Ecoinvent recycling processes are custom and applyto the whole world (GLO), which can also cause some uncertainty.A detailed document containing all elementary flows can be found in the Appendix.Finally, a sensitivity analysis has been conducted, to see how strong certain impacts changewhen the inputs are changed. The parameters tested are the sizes of the container and lid. Sincethe manufacturer offers the RTCs in multiple sizes, it is interesting to look at the differences inimpact intensities. If the results change a lot, it could be an indicator that purely the materialsitself are having a high impact. If the results do not change proportionately to the increase ofmaterials, it could be an indicator that rather the processes around the materials (e.g. theproduction machines, energy, etc) are an issue.5. Life Cycle Assessment and ComparisonThe eleven impact categories considered are abiotic depletion potential of elements (ADPe.),abiotic depletion potential of fossil resources (ADPf.), acidification potential (AP),eutrophication potential (EP), global warming potential (GWP), human toxicity potential(HTP), marine aquatic ecotoxicity potential (MAETP), freshwater aquatic ecotoxicity potential(FAETP), ozone depletion potential (ODP), photochemical oxidants creation potential (POCP)and the terrestrial ecotoxicity potential (TETP).7
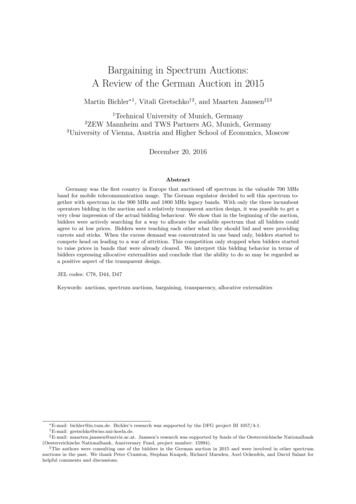
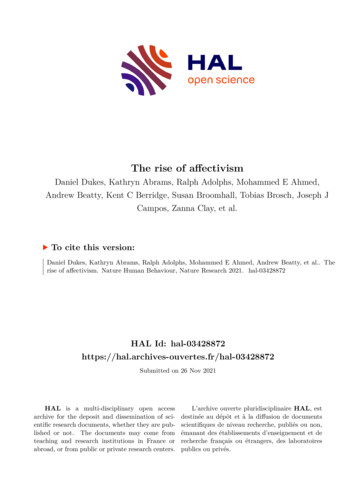
As shown in the following figure (Fig. 3), SAN itself has the strongest impact on four out ofthe eleven impact categories: ADPf., AP, GWP and POCP. Its impact gets as high as more thantwice the impact of most of the other processes. Compared to the ADPf. of the study by GallegoSchmid et al. (2019), the SAN container has a much higher impact than any of the single-useor reusable PP container (10,274,000 J compared to just above 2,000 J for the PP and below800 J for the single-use ones). The acidification potential (AP) is also much higher for the SANcontainer (1206 mg SO2 eq) compared to the others (all below 400 mg SO2 eq). Similar resultsappear for the GWP (517 g CO2 eq compared to values below 60 g CO2 eq) and POCP (108.6mg C2H4 eq compared to values below 60 mg C2H4 eq).Fig. 3: the impact of SAN production on different impact categories.8
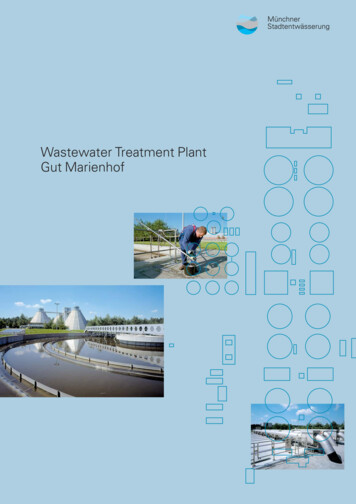
The end of life of the container, as shown in Fig. 4, has a big impact on three out of the elevencategories: FAETP, HTP and MAETP. For the FAETP, the end-of-life treatment of thecontainer is about four times higher than any of the other processes. The MAETP is even aboutfive times higher than the remaining processes, showing how high the impacts are on both freshand marine water. In contrast to the comparison study, these values are also higher. The valuefor the waste treatment of PP is about 120 g 1,4-DB eq, while in this case it is 401 g 1,4-DB eq.Fig. 4: The impact of RTCs waste treatment on different impact categories.Injection Molding has the highest impact in two and the second-highest impact in four of theimpact categories. Figure 5 shows the two highest impacts (ODP and EP). In addition to these,it holds the second-largest impacts on ADPe, AP, FAETP and HTP. Nevertheless, it still has ahigher impact than the production processes in the comparison study (e.g. a AP value of 828.4mg SO2 eq compared to values under 300).9
Fig. 5: The impact of Injection Molding on different impact categories.Lastly, transport with a 12t truck and the soap for the dishwasher yield the highest impact onADPe and TETP, respectively (Figure 6 and 7). Again, both values are higher than in thecomparison study (Gallego-Schmid et al, 2019).Fig. 6: The impacts of different processes on Abiotic Depletion Potential.Fig. 7: The impacts of different processes on Terrestrial Ecotoxicity Potential.A detailed list of all contributing factors to the eleven impact categories (in %) as well as adetailed impact analysis list can be found in the Appendix (Apx. 2 and 3).10
6. InterpretationWhen looking at the outputs of the LCA, it becomes clear that certain processes have a higherenvironmental impact than others. Out of all raw materials for instance, SAN and TPE have arelatively high impact, while paper and cardboard have a quite small impact. At the same time,the transport with a 12t truck has some impact, while the 40t truck has very little impact. Thiscould be an indicator for decision-makers to switch to 40t trucks for all processes. Furthermore,soap has a high impact on TETP, while the other segments of the dishwashing process havevery little to no impact. Perhaps using a more environmentally friendly soap could decrease theTETP drastically. A list of the detailed impact contributions can be found in Apx. 2.To get an even clearer understanding of which processes have a relatively high impactcompared to others, groupings of the different Life Cycle Stages were analyzed in OpenLCA.The following table shows which stages are the most impactful:Impact CategoryLife Cycle Stage with the highest impactADPe.Raw MaterialsADPf.Raw MaterialsAPRaw MaterialsEPRaw MaterialsGWPRaw MaterialsHTPEnd of LifeMAETPEnd of LifeFAETPEnd of LifeODPProductionPOCPRaw MaterialsTETPUseTab. 2: Most impactful Life Cycle Stages for each impact category.From this table it becomes clear that Raw Materials have the largest impact. Additionally, thereare much higher impacts of raw materials and production, compared to the Gallego-Schmid etal. study. While this sounds discouraging at first, one needs to keep in mind that SAN is a muchsturdier material than the ones of single-use containers. As for the much higher impacts of SANcompared to the reusable PP container, further research would need to be done.To find out how much impact the raw materials themselves have, a sensitivity analysis has beendone. In this analysis, the RTC (container lid) is being compared to a RTC twice its size(measured in weight). The detailed results are available in Apx. 4. In the following figure, theimpact changes for each impact category can be seen:11
Fig. 8: Sensitivity analysis outcome.The results clearly show that for most categories, the impact does not change proportionatelyto the change in materials. The only categories in which it does change by 30-40% are FAETP,HTP and MAETP, which are all the categories in which the End of Life is the most impactful.This could be an indicator that for the End-of-Life processes, the pure amount of material isdecisive over the impact, while other processes of the End of Life (such as energy, machinery,etc) do not play as big of a role. On the other side, for all other impact categories it means thatthe change in actual raw material is not very decisive over the impacts at all.In chapter 5 one could see that the environmental impacts of SAN containers are about 3-4xhigher than the ones of PP reusable containers. While these are very high values, one shouldnot forget about the lifespan of these containers. The analyzed PP container can be reused about43 times before having to be disposed of (Gallego-Schmid et al., 2018). At the same time, thePP container needs to be used between 1 and 208 times to outweigh the environmentaladvantage of single-use containers in each of the impact categories (Gallego-Schmid et al.,2019). The SAN container, however, can be reused about 1000 times since it is very durableduring dish washing (G.E.T. Marketing, 2017). That means that the SAN container can be usedabout 23 times more often than the analyzed PP container, making it more sustainable despiteits higher impacts. With this knowledge, it can easily be deduced that the consumption of SANRTCs is, by far, more sustainable than the single-use containers compared to.12
7. Conclusion and RecommendationsThis LCA study was supposed to answer a few questions: Whether the analyzed RTC is moresustainable than single-use containers, and whether it is more sustainable than the reusable PPcontainer. Furthermore, it was meant to show which of the processes regarding the RTC are themost impactful and could be improved. The first answer is: yes, the analyzed container isdefinitely more sustainable than the single-use alternatives, despite the higher impacts at firstglance. But when considering the much longer lifespan of RTCs, it is becoming clear that theyare indeed much more efficient. The second answer is positive as well: the RTC is moresustainable than the PP container from the comparison study. While the environmental impactsof the RTC are about three to four times higher, the lifespan of the RTC is about 23 timeshigher. Lastly, it has been shown which of the processes and Life Cycle Stages are the mostand least impactful (see chapter 5 and 6).As already mentioned in chapter 4, the lack of some primary data leads to uncertainty. Forexample, in Fig. 5, the impacts of Injection Molding are represented as very high, also incontrast to the comparison study. Yet, the impacts might have been smaller if the parametersfor energy, that are identical with the real value, could have been chosen. It is unlikely that theresults would differ to a high extent, but it is for sure something that creates some uncertainty.In general, the lack of data in some parts of the study creates an issue due to uncertainty of howthe results would look like if better primary data was given. This is something worth analyzingin future studies. Moreover, it is important to note that this study compares SAN RTCsspecifically with the PP Tupperware container described in the comparison study. Thiscomparison is not representable for all PP containers, since they might differ in sturdiness orthickness, and can therefore have a longer lifespan (e.g. 1200 reuses for the virgin PP containersfrom GreenGrubbox. Data source: internal data through personal contact).All in all, this study gives an overall insight into reusable containers made from SAN and TPE,as well as their environmental impacts and benefits. Further, more in-depth analyses throughfurther studies could help create more accurate data and further close the research gap.13
BibliographyAlejandro Gallego-Schmid, Joan Manuel F. Mendoza, Adisa Azapagic (2019). Environmental impactsof takeaway food containers. Journal of Cleaner Production, 211, 417-427.Allocation at the point of substitution. Ecoinvent. (n.d.). oint-of-substitution.html.Directive EU (2019/904) of the European Parliament and of the Council of 5 June 2019 on thereduction of the impact of certain plastic products on the environment.Gallego-Schmid, A., Mendoza, J.M.F., Azapagic, A. (2018). Improving the environmentalsustainability of reusable food containers in Europe. Sci. Total Environ. 628, 979-989.ISO, 2006a. ISO14040:2006. Environmental Management - Life Cycle Assessment - Principles andFramework. ISO standards, Geneva (Switzerland).ISO, 2006b. ISO14044:2006. Environmental Management - Life Cycle Assessment - Requirementsand Guidelines. ISO standards, Geneva (Switzerland).Johansson, K. (2018). Life cycle assessment of two end-of-life tyre applications: artificial turfs andasphalt rubber. Ragn Sells, 1-72.Kunststoffabfälle in Deutschland. NABU. (n.d.). d-recycling/22033.html.Mahy, E. (2021, August 30). Taste for takeaways Outlasts Covid lockdowns. BBC rketing, G. E. T. (n.d.). PC vs SAN Plastic TUMBLERS: What's the difference? PC vs SAN PlasticTumblers: What's the Difference? reneacrylonitrile-plastic-tumblers.Potting, J., van der Harst, E. (2015). Facility arrangements and the environmental performance ofdisposable and reusable cups. Int J Life Cycle Assess 20, 1143–1154.Vercalsteren, A., Spirinckx, C. & Geerken, T. (2010). Life cycle assessment and eco-efficiencyanalysis of drinking cups used at public events. Int J Life Cycle Assess 15, 221–230.Woods, L., Bakshi, B.R. (2014). Reusable vs. disposable cups revisited: guidance in life cyclecomparisons addressing scenario, model, and parameter uncertainties for the US consumer. IntJ Life Cycle Assess 19, 931–940.14
AppendixApx. 1 – Outputs per impact category15
16
Apx. 2 – Contribution of Processes17
18
19
Apx. 3 – Impact Category Results20
Apx. 4 – Sensitivity Analysis Results21
Life Cycle Assessment of a Reusable Takeaway Container Submitted in fulfillment of the requirements for the course: "Creation of a Life Cycle Assessment Study Using LCA Software" Maria Plasoianu Student-ID: 03718974 Examiner: Dr. rer. agr. Omar Hijazi Date Submitted: August 31, 2021