Transcription
The Life Cycle Inventory& Life Cycle Assessmentof Cotton Fiber & FabricExecutive SummaryALCA Executive Summary
Life Cycle Assessment of Cotton Fiber and Fabric was prepared for VISION 21,a project of The Cotton Foundation and managed by Cotton Incorporated,Cotton Council International and The National Cotton Council. The researchwas conducted by Cotton Incorporated and PE International. 2012 Cotton IncorporatedAll rights reserved; America’s Cotton Producers and Importers
Contents2Overview4Methodology12Results and Discussion22Next Steps24References25Appendix
Overview2LCA Executive Summary
Life Cycle Assessment (LCA) is a systematic evaluationof the potential environmental impact and resource utilization of a product, starting at the raw material stage andending with disposal at the end of the product’s life.A fundamental component of LCA is the Life Cycle Inventory or LCI. An LCI isa quantification of the relevant energy and material inputs and environmentalrelease or emissions data associated with product creation and use. The primarypurpose of this project was to compile a robust and current LCI dataset for global cotton fiber production and textile manufacturing. A secondary objective wasto use the LCI data to conduct a complete Life Cycle Impact Assessment (LCIA)of a hypothetical knit shirt and woven pant to better understand the environmental impact of cotton textiles so the cotton industry can effectively direct researchand resources towards reducing future impacts.The Cotton Foundation commissioned PE International to perform these studiesaccording to the principles of the International Organization for Standardization(ISO) 14040 series of standards for Life Cycle Assessment (ISO, 2006). Becausethe LCI will be published in proprietary and open source LCA databases, the entire study was reviewed by a third-party Critical Review Team comprised of agricultural, LCA, and textile experts. The LCI data have also been submitted to TheCarbon Trust, a not-for-profit company in the United Kingdom, for certificationand to bring additional third-party review and credibility to the data. The projectwas managed by The National Cotton Council of America, Cotton Incorporated,and Cotton Council International.LCA Executive Summary3
Methodology4LCA Executive Summary
The LCI consists of primary and secondary data collectedin the following categories: cotton fiber production, textilemanufacturing, transportation, garment creation, use,and end-of-life. Primary data were collected by C otton Incorporated through partnerships with researchers, industry, and co-operators. The data are representativeof the crop years 2005 through 2009 and textile manufacturing in 2009–2010. Primary data were supplementedwith l iterature and industry averages (secondary data).The LCA model was originally created using the GaBi 4 software system developed by PE International, and the analysis was updated when the GaBi softwarewas upgraded to version 5 in 2011. (GaBi 4, 2006; GaBi 5, 2011). The databaseswithin the GaBi software were the source of the secondary LCI data upon whichenergy production, raw and process materials, transport, and wastewater treatment were modeled. These data were used to account for regional differencesfor similar processes. For example, China, India, Turkey and Latin America (thelocations chosen for textile production) produce larger Acidification Potential(AP), Eutrophication Potential (EP), Global Warming Potential (GWP), andPhotochemical Ozone Creation Potential (POCP) per kilowatt-hour when compared to the emissions profile of the U.S. electrical grid. However, OzoneDepletion Potential (ODP) is much higher in the U.S. emissions profile, which isthe location for all of the assumed consumer use in this study. These factorswill be important when comparing the overall contributions for each phase toeach potential impact.LCI data for fiber production represents a global average of U.S., China andIndia for the years 2005–2009 and was based on regional production-weightedaverages. The U.S., China and India represented 67% of the world’s cottonfiber production in 2010 (USDA, 2011). Data covers raw material productionfrom field through ginning (cradle-to-gate) and includes soil types, climate,seed and chemical inputs, fuel use, and dates of key operations (e.g., planting,fertilizer application, and harvest). These data were entered into a cultivationmodel d eveloped by PE International to estimate the nitrogen and carbon cyclesin each of the regions. Impacts were calculated for a functional unit of 1,000 kilograms (kg) of cotton fiber.LCA Executive Summary5
Data on fabric production for both knit and woven fabrics, also represented as aglobal average, were collected from representative mills in four regions: Turkey,India, China, and Latin America. These areas represented 66% of knit and 51%of woven world fabric manufacturing in 2009 (ITMF, 2009). Candidate textilemills were identified by first reviewing interviews from site visits to more than 40cotton textile companies in regions of China, India, Turkey, Southeast Asia, andthe Americas during a previous study conducted by Cotton Incorporated. Thisinformation was combined with Cotton Incorporated staff technical service experiences to identify “typical” mills that would accurately represent the overall textileproduction practices in the countries of interest. The data cover the fiber LCIplus bale opening; yarn preparation; spinning; knitting or weaving; wet preparation; dyeing and finishing, and included raw material inputs and outputs; energyinputs by source; dye/chemical input, output, and emissions; and solid waste (e.g.recycled, sold, and landfill). Impacts for fabric manufacturing are calculated for1,000 kg of knit fabric or 1,000 kg of woven fabric, as appropriate.Additionally, cradle-to-grave LCA’s that encompassed fiber production throughconsumer use and disposal were conducted for 1,000 kg of golf shirts and 1,000kg of casual pants. After accounting for cut-and-sew losses, it was calculatedthat 1,000 kg of knit fabric would yield 2,780 golf shirts, and 1,000 kg of wovenfabric would yield 1,764 pairs of casual pants.The mill data for textile production and for cut-and-sew processes weresupplemented with process energy calculations from machinery manufacturers and data available from Cotton Incorporated experts. Background dataon ancillary materials, energy and fuels, transportation, and end-of-life weretaken from PE International’s GaBi databases. Background data on use phase6LCA Executive Summary
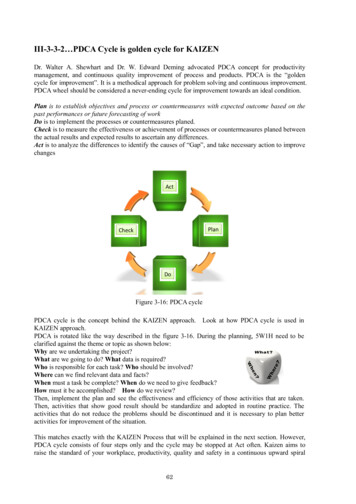
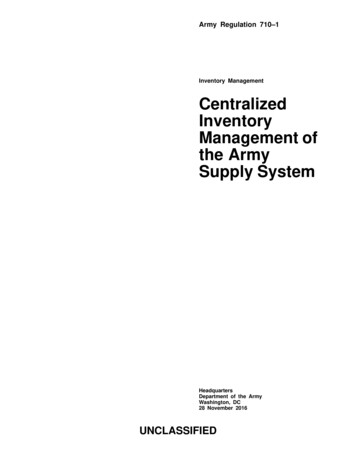
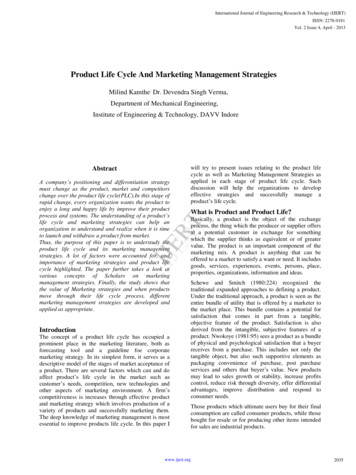
energy and materials were taken from existing government publications,literature values and PE International GaBi data. Those data were combinedwith consumer behavior data from Cotton Incorporated’s Lifestyle Monitor survey, an ongoing Internet survey of U.S. consumers who are representativeof the U.S. Census based on education, income, ethnicity, marital status, andgeography. U.S. consumers surveyed were 60% female, 40% male, betweenthe ages of 13 and 70 years old. Approximately 1,000 people were askedquestions about their use and laundering practices for knit shirts and wovenpants. The number of washings during the lifetime that a consumer owned andused a garment was calculated to be 56 times per knit shirt and 72 times perwoven pant. The calculation was based on the number of times a garment wasworn per week, the number of weeks in a year that the garment was used, thelifetime (in years) of a garment and the number of times the garment was wornbefore washing.The life cycle of a cotton garment was modeled as three overall phases:1) Agricultural Production; 2) Textile Manufacturing); and 3) Consumer Use(wearing and washing to the end of life including disposal). Primary datacollection for the LCI ended with Textile Manufacturing so the cut-and-sewoperations were included with the Consumer Use phase. The systemboundaries of the LCA encompass fiber production, fabric production,garment creation, transportation, consumer use, and end-of-life (Figure 1.)Figure 1LCA System Boundaries and Functional UnitsRaw Materials, Energy, Fuels, WaterGlobal AverageKnit FabricManufactureCultivation ofUS CottonCultivation ofChina CottonCultivation ofIndia CottonCradle-to-Grave GarmentsCradle-to-Gate FabricCradle-to-Gate FiberGlobalAverageCotton FiberCut &SewGlobal AverageWoven FabricManufacture1,000 kg Woven FabricGarment Endof Life1,000 kg Knit Golf Shirts Used and Disposed1,000 kg Knit Fabric1,000 kg FiberGarmentUseCut &SewGarmentUseGarment Endof Life1,000 kg Woven Casual Pants Used and DisposedEmissions to Air, Water, and Soil (Waste)Study BoundaryCradle-to-Grave BoundaryCradle-to-Gate BoundaryFunctional UnitsLCA Executive Summary7
A summary of inclusions and exclusions in the LCA is shown in Table 1. Itemswere included or excluded from the study based on their relevance to the environmental profiles measured. For example, in the case of human labor, socialissues were outside the scope of the study and were therefore excluded.Table 1Summary of Inclusions and ExclusionsIncludedExcluded Cotton growth, cultivation and ginning– Human labor A ncillary material production(dyes, chemicals, etc.)– Construction of capital equipment E nergy and emissions for fabric production,including facility overhead E nergy and materials for garment creation(cut-and-sew)– Maintenance and operation ofsupport equipment– Production and transport ofpackaging materials T ransport of intermediate and finishedproducts Transport of finished fabric for cut-and-sew Transport from retail to customer F abric use phase washing and drying (inhomes only—no dry cleaning considered) Fabric end-of-lifeWhen a system yields more than one valuable output, as is the case for cottonproduction, environmental burden is shared, or allocated, between the co-products. During cotton production, two valuable co-products are produced, cottonfiber and cottonseed, thus the environmental burden was allocated to boththe fiber and seed. Several allocation methods are used in LCA studies: massbased (the heavier product is assigned more burden), substitution (subtractingoff the environmental impact of a product that is replaced by the co-product, forexample, accounting for the amount of soybeans replaced by cottonseed), andeconomic (splitting the burden based on monetary values). It was determinedthat economic allocation was the most suitable method to use for this study. Thedata requirements for a substitution method (soybean example noted above)were determined to be overly complex and dependent on factors heavily influenced by market changes. A mass-based allocation would have placed most ofthe burden on the cottonseed, and, as cotton is perceived as a fiber crop, thisapproach seemed implausible. Thus, for economic allocation, data on the valueof cotton fiber and cottonseed from the United States from 2005 to 2009, asreported by the USDA, were used. The allocation took into account that 1.4 unitsof cottonseed are produced per unit of cotton fiber. The economic allocationresulted in 84% of the agricultural burden assigned to the fiber and 16% to theseed. No burden was assigned to the stalks or gin waste.8LCA Executive Summary
Noils, a co-product from fabric manufacturing, are too valuable to be consideredwaste (approximately 0.75 per kg compared to 1.50 per kg for fiber) and aresubjected to the same production and textile manufacturing systems as primaryfabric. For this reason an economic allocation of impact was deemed reasonablein this case. In contrast, lower value waste material generated throughout thetextile manufacturing processes, such as start-up fabric from knitting or weaving, for example, are usually recycled internally or sold offsite for a low price.These types of wastes were considered to be byproducts and no allocation ofburden was deemed necessary in these cases.To ensure that all relevant environmental impacts were represented in the studythe following cut-off criteria were used: Mass—If a flow was less than 1% of the cumulative mass of all the inputsand outputs of the LCI model, it was excluded, provided its environmentalrelevance was not a concern. Energy—If a flow was less than 1% of the cumulative energy of all the inputsand outputs of the LCI model, it was excluded, provided its environmentalrelevance was not a concern. Environmental relevance—If a flow met the above criteria for exclusionyet was thought to potentially have a significant environmental impact, itwas evaluated with proxies identified by chemical and material expertswithin PE International. If the proxy for an excluded material had a significantcontribution to the overall Life Cycle Impact Assessment (LCIA), moreinformation was collected and evaluated in the system. The sum of the neglected material flows shall not exceed 2% ofmass or energy.Unlike LCI’s which only report individual emissions, LCIA assigns individualemissions to impact categories based on established characterization of theemissions factors. The end result is a single indicator for quantifying eachpotential impact, such as “Global Warming Potential.” The environmental impactcategories that were evaluated in this study are listed in Table 2. It should benoted that the impact categories represent potential impact, in other words,they are approximations of environmental impacts that could occur if theemitted molecules would (a) actually follow the underlying impact pathway and(b) meet certain conditions in the receiving environment while doing so. LCIAresults are therefore relative expressions only and do not predict actual impacts,the exceeding of thresholds, safety margins, or risks. In addition, energydemand, water used and water consumed are reported as EnvironmentalIndicators only and no further impact methodology was applied.LCA Executive Summary9
Table 2Environmental Impact CategoriesAbbreviationTechnical TermExampleAPAcidification PotentialAcid rainEPEutrophication PotentialWater pollutionGWPGlobal Warming PotentialGreenhouse gas emittedODPOzone Depletion PotentialOzone hole over polar ice capsPOCPPhotochemical OzoneCreation PotentialSmogPEDPrimary Energy DemandElectricity & fuel neededWUWater Used (Gross Volume)Water used in washing machineWCWater Consumed (Net Volume)Water evaporated in dryerETPEcotoxicity PotentialAnimal healthHTPHuman Toxicity PotentialHuman healthIt is important to note that an LCA considers both direct and indirect water use.Direct water use refers to water used directly in the production of cotton products such as irrigation water, water to dye and finish textile products, and waterused in the washing machine. Indirect water use can come from several sources,but a major source is the water associated with power generation. For example,a process that involves no direct water use, such as spinning a fiber into a yarn,can have a significant amount of indirect water use due to power generation.Several new metrics to describe water use from an LCA perspective areundergoing development; however, at the present time there are two primarymethods of modeling and reporting water. Both are reported in this study:Water Used (WU) refers to all of the water applied, both directly and indirectly,in any phase of the product’s life. It can be considered the gross amount ofwater used.Water Consumed (WC) refers to water that leaves the watershed from where itwas taken, and like WU, consists of both direct and indirect water. WC includesthe groundwater, river and surface water used for cotton irrigation and thecooling water evaporated during electricity (energy) production. In cases wherewater is returned to the same watershed, a credit is applied. To illustrate, allirrigation water is considered to be consumed since the water taken up by thecotton plant evaporates and falls later as rainfall into the ocean or into a different10LCA Executive Summary
watershed; however, the treated wastewater from textile processes and consumer laundering is returned to the same watershed, therefore, a credit is givenfor this water. For these reasons, WC can be thought of as the net amount ofwater used. Rainfall is not typically included in LCA.To further illustrate both definitions, consider the direct water used and consumedwhen washing a shirt. WU is defined as all of the water that flows through thewashing machine during every cycle. WC is the water that was retained in the shirtand then evaporated during drying. Finally, the indirect water is associated withthe production of the electricity to run the washing machine and is added to bothWU and WC.LCA Executive Summary11
RESULTS ANDDISCUSSION
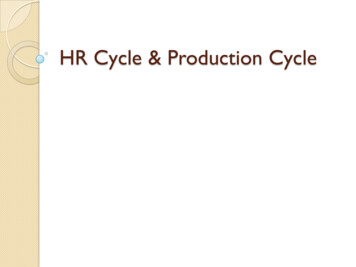
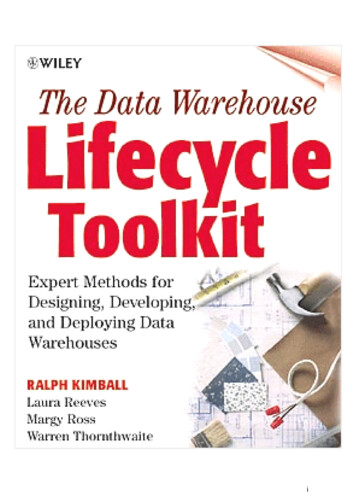
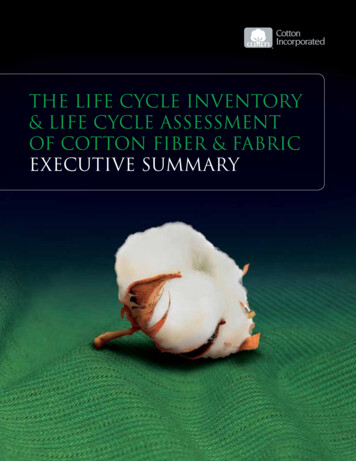
The potential environmental impacts associated with theproduction and use of 1,000 kg of knit and 1,000 kg of woven fabric over the entire cotton life cycle are summarizedin Figure 2 and Figure 3. The absolute values for eachphase and impact category are provided in the Appendix.When the entire cotton life cycle was considered, two phases dominated theimpact profile of the LCA: Textile Manufacturing and Consumer Use. The potentialimpacts from these phases are predominately attributed to energy use during fiberprocessing, wet preparation and dyeing, and laundering of garments. On a relative basis, there was little difference in the results for a knit shirt and woven pant.The consumer phase tended to be slightly higher for the woven pant due to theincreased number of washes during its life (72) compared to the knit shirt (56) butthis difference was not significant.Country energy grid data, commonly referred to as background data, figuresprominently when comparing the overall contributions of each phase to eachpotential impact. Note that the Consumer Use phase was modeled with U.S.consumer data only. If global use scenarios were included in the analysis therelative contribution from the Consumer Use phase could be very different. Asstated in the Methodology section, the relative contribution to ODP for theConsumer Use phase appears much larger due to the larger ODP emissionprofile of the U.S. energy grid. It is also important to note the actual values forODP were quite small in this study and entirely related to energy production.This is due to the phase out of all ozone depleting chemicals worldwide.Figure 2Relative Contribution to Impact Categoryfor Batch-Dyed Knit Fabric Life Cycle ut/Sew, Use, DisposalC Textile Manufacturing Agricultural Production100%80%60%40%20%0%GWPAPEPODPPOCPPEDWULCA Executive SummaryWC13
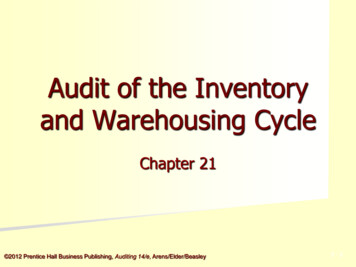
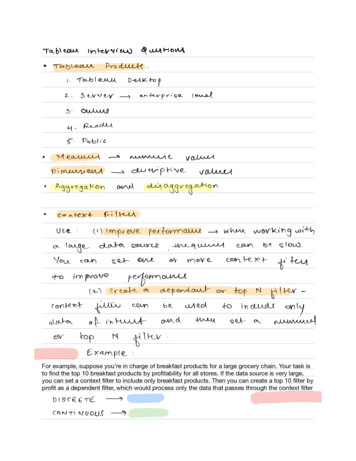
Figure 3Relative Contribution to Impact Categoryfor Woven Fabric Life Cycle ut/Sew, Use, DisposalC Textile Manufacturing Agricultural he Agricultural Production phase had the lowest relative impact of the three lifecycle phases in all categories except Water Consumed. In this category, Agricultural Production had a high relative impact compared to other phases owingprimarily to irrigation. In contrast, Agricultural Production exhibits a much lowerproportion of the Water Used category. In this study, WU is highly related to energy production which is predominantly linked to textile processing and consumerlaundering. For this reason, the relative contribution of Agricultural Productionto the WU category is similar to that of other categories such as AP which arerelated to energy.Agricultural Production PhaseA key objective of this LCA was to identify areas within the life cycle upon whichto improve. Therefore, the potential impacts associated with the processes withinthe Agricultural Production and Textile Manufacturing phases were evaluated.The inputs included in the processes associated with the Agricultural Productionphase and the contribution of these processes to each of the impact areas areshown in Table 3 and Figure 4.With the exception of water, the analyses showed that field emissions (tractor/equipment operations) were the primary contributors to overall a
Life Cycle Assessment of Cotton Fiber and Fabric was prepared for VISION 21, a project of The Cotton Foundation and managed by Cotton Incorporated, Cotton Council International and The National Cotton Council. The research . Life Cycle Assessment