Transcription
Clinical StudyStereotact Funct Neurosurg 2006;84:28–34DOI: 10.1159/000093720Published online June 1, 2006Automatic Microelectrode Recording Analysis andVisualization of the Globus Pallidus Interna andStereotactic TrajectoryJon Haakon Falkenberg a, b James McNames a Kim J. Burchiel baBiomedical Signal Processing Laboratory, Electrical and Computer Engineering Department,Portland State University, and b Department of Neurological Surgery, Oregon Health and Science University,Portland, Oreg., USAKey WordsDeep brain stimulation Globus pallidus interna Microelectrode recording analysis Parkinson’s disease Stereotactic surgeryAbstractLocating deep brain neuronal structures is required to accurately place deep brain stimulation (DBS) electrodes duringstereotactic surgery in patients with Parkinson’s disease andother movement disorders. This study investigates the efficacy of automatic microelectrode visualization and analysismethods to help neurosurgeons locate target structuresmore objectively, consistently, and easily during surgery. Tenpatients (4 males and 6 females) who underwent bilateralimplantation of DBS electrodes in the globus pallidus interna (Gpi), from 2001 to 2003, at the Oregon Health and Science University and the Portland Veterans AdministrationMedical Center were included. We compared the efficacy ofthe microelectrode recording signal energy, power spectraldensity (PSD), marginal probability density (mPDF), autocorrelation function (ACF), and partial ACF. mPDF and PSD estimates most accurately indicated the borders of the GPi target structure.Copyright 2006 S. Karger AG, Basel 2006 S. Karger AG, Basel1011–6125/06/0841–0028 23.50/0Fax 41 61 306 12 34E-Mail karger@karger.chwww.karger.comAccessible online at:www.karger.com/sfnIntroductionThe internal segment of the globus pallidus (GPi) andthe subthalamic nucleus (STN) are both targets of deepbrain stimulation (DBS) for the treatment of advancedParkinson’s disease (PD). Several clinical studies havecompared the two sites to determine which site providesgreater benefits to PD patients [1, 2]. Despite confirmedclinical benefits of Gpi- and STN-DBS, the ideal targetlocation in humans is not known. There are a number ofnon-standard assessment procedures, which makes comparisons between STN and GPi targets very difficult toevaluate [3]. One of the challenges in comparing STN andGPi targets is that methods for locating the intended DBStarget are dependent on subjective human judgment.There are currently no methods which define the optimal pallidal surgical or DBS site that yields minimalcomplications and maximal efficacy. Spike train analysisis a common method used to determine the GPi target [4,5]. However, spike train analysis introduces subjectivitybecause the investigator typically needs to make choicesin selecting which spikes to include in the analysis, and inavoiding artifact and non-stationary transients in the data[6]. In addition, during surgery the investigator uses additional cues (e.g. change in background noise) to determine the target and transitions from one neuronal structure to the next [7]. This is particularly true when multipleunits are firing simultaneously or when spikes are not dis-Kim J. Burchiel, MD, FACSDepartment of Neurological Surgery, Mail code L-472Oregon Health & Science University, 3181 SW Sam Jackson Park RoadPortland, OR 97239 (USA)Tel. 1 503 494 6207, Fax 1 503 494 7161, E-Mail burchiek@ohsu.edu
cernable. Consequently, there exists a clinical need tomake microelectrode recording (MER) analysis less subjective, more consistent and easier to locate targets.Patients and MethodsThis study included 10 consecutive PD patients (4 males and6 females) who underwent bilateral implantation of DBS electrodes in the GPi, from 2001 to 2003, at the Oregon Health andScience University and the Portland Veterans AdministrationMedical Center (PVAMC). Table 1 summarizes the patient information. One patient was not included due to technical problemswith data collection. All microelectrode trajectories were analyzed postoperatively.Surgical TechniqueEstablished surgical techniques were used, as described by Favre et al. [8].Microrecording TechniqueA microrecording system (Neurotrek, Alpha Omega Engineering, Nazareth, Israel) was used to acquire neurophysiologic signals at a sampling rate of 12 kHz. Tungsten bipolar microelectrodes with impedances from 0.05 to 0.72 M (measured at1,000 Hz) were used (table 2). Online visual and auditory analyseswere the primary methods for distinguishing the different structures along the trajectory and to select the target. Most MERswere at least 30 s in duration.Data AnalysisTen consecutive seconds of the recorded signal that deviatedthe least from the mean were selected for analysis per electrodedepth. Segments of 5 s or less were omitted and segments between5 and 10 s included.Energy/Rank EnergyThe energy of the segments was calculated by taking the standard deviations of the signal. The interpercentile range of the energy was calculated at 1–99, 5–95, 10–90 and 25–75% and medianenergy. Each energy measure was displayed at each of the different recording depths.Table 1. PD study patients: summary n, yearsInclusioncriteriaGPi 100GPi 101GPi 102GPi 103GPi 104GPi 106GPi 107GPi 108GPi 109GPi 110GPi 151726IP, DIDIP, TR, OOIP, DID, BRIP, DID, DYSIP, DID, OOIP, DID, OOIP, TR, DIDIP, TRIP, DIDIP, TR, DID, BRIP, OO, BR6618AverageIP Idiopathic PD; DID drug-induced kinesia; BR bradykinesia; OO on/off fluctuations; TR tremor; DYS dystonia.Table 2. Final target, impedance and acquired coordinates, arc and ring angleIDFinal targetImpedance, M Arc angle, Ring angle, leftrightleftrightleftrightleftrightGPi 100GPi 101GPi 102GPi 103GPi 104GPi 106GPi 107GPi 108GPi 109GPi 110GPi .679.680.682.376.0NA Not applicable; arc angle lateral/medial angle (read from the Leksell frame); ring angle anteroposterior angle with respect to the anterior commissure-posterior commissure line (read from the Leksell frame);blank cell not recorded.Automatic Microelectrode Recording ofthe Globus Pallidus InternaStereotact Funct Neurosurg 2006;84:28–3429
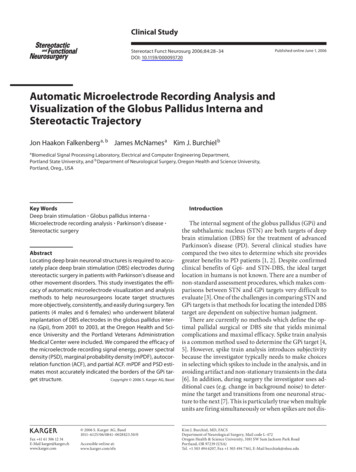
Fig. 1. MERs in a PD patient (GPi 103L) atdifferent depths along the stereotactic trajectory. Annotations ofGPe and GPi weremade during surgery. The same data werea subset of the data used to generate figure2.WM White matter, BU border unit.Power Spectral DensityThe frequency content of the selected data segment at eachdepth was estimated using power spectral density (PSD). A nonparametric estimation (Welch’s method) of PSD was applied tothe segmented signal [9]. Window length was 85.2 ms, and thesignal was divided equally into segments with 50% overlap. Eachsegment was windowed with a Hamming window. The modifiedperiodograms were computed and averaged. Different magnitudes of power were plotted as different colors. The color rangewas normalized between 0 and 99% of magnitude values.Partial Autocorrelation FunctionThe partial ACF was estimated at lags of 0.0833 ms over arange of 0–5 ms [10, 11]. Similarly to the aforementioned ACF, thedifferent coefficients were bounded by limits –1 and 1. The colorspectrum was set as a function of a hyperbolic tangent function.Marginal Probability Density FunctionThe distribution of the signal amplitudes of the data segmentat each depth was estimated using the marginal probability density function (mPDF). After the signal mean was removed, thevoltage amplitudes of the MER data were distributed over 100 binsand normalized with respect to the number of elements in thedata. Similarly to the PSD plot, the mPDF color range was set to0–99% of maximum magnitude.Extracellular MER data from 24 trajectories were recorded from 10 patients that underwent bilateral GPi implantation. Two patients had a DBS electrode placed without undergoing second-side MER (table 1). The averagerecording time for each of the trajectories was 36 8 15min (STD; n 16). Of the 10 patients, 3 patients (GPi 101,GPi 107, and GPi 108) received more than one pass on thesame hemisphere. The second pass was placed 2 mm medially to the initial trajectory, and the third pass in GPi101 was placed 4 mm laterally to the initial trajectory. Using the coordinates from the Leksell stereotactic frame,the lateral/medial angle was described as the arc angleand the anteroposterior angle with respect to the anteriorcommissure-posterior commissure line has been described as the ring angle (table 2).Representative cell discharges along the GPi trajectoryare shown in figure 1. The traces represent a subset of theraw microelectrode data collected from the left hemisphere (GPi 103L).Results of the different statistical signal processingand visualization methods are demonstrated in figure 2.Time SeriesThe power at each time point of the signal segment was estimated (time series). The instantaneous power was calculated bysquaring the signal. The smoothed instantaneous power signals(cutoff at 1 Hz) were decimated to 200 samples and displayed in10-second segments per electrode depth. The time series magnitude was normalized to a color range that was set to 0–99% of themaximum magnitude.Autocorrelation FunctionThe biased autocorrelation function (ACF) had a user-specified lag of 12 ms that produced a vector of 144 coefficients for eachrecording depth [10, 11]. Different amplitudes of the coefficientswere plotted as different colors. The color spectrum was setbounded by limits –1 and 1. A hyperbolic tangent function wasapplied to emphasize deviations from 0.30Stereotact Funct Neurosurg 2006;84:28–34ResultsFalkenberg /McNames /Burchiel
Fig. 2. An example of statistical properties of MER visualizationversus electrode depth of a patient with PD. Visualization of theentire MER trajectory (48 depths). The top plot (energy) represents annotations that were made during surgery. The next plot(PSD) shows the energy of the spontaneous neuronal discharge atdifferent depths along the stereotactic trajectory, and the rankenergy of the energy; from top to bottom 1–99th, 5–95th,10–90th, 25–75th percentiles, respectively. The PSD, mPDF andtime series (TS) domain plots show amplitudes ranging from low(blue) to high (red). The target structure (GPi) had a nominal target depth of 27.5 mm. The visualization clearly shows the boundaries of the target structure between 20.5 and 26 mm.PACF Partial ACF.Forty-eight different depths of MER data were collectedalong the stereotactic trajectory in this figure, of whichsome depths and structures are shown as raw data in figure 1.Different statistical and visualization methods werecompared to determine if there was one single visualization technique that would stand out in distinguishing theventral and dorsal borders of the GPi. The mPDF appearsto be able to distinguish the borders of the GPi the best(fig. 3).The neurosurgeon assigned confidence scores to howdistinguishable the dorsal and ventral border featureswere of the globus pallidus externa (Gpe) and GPi basedonline auditory and visual analyses (table 3). There wasno obvious correlation between the confidence levels andimpedance of electrodes (table 2), patient disease duration, patient age (table 1) and how readily visualizationand analysis techniques allowed for target detection(fig. 3).Automatic Microelectrode Recording ofthe Globus Pallidus InternaStereotact Funct Neurosurg 2006;84:28–34Globus Pallidus Externa and Border CellsThere were no obvious differences between the GPeand the border cells regarding the energy, PSD, mPDF,ACF or the partial ACF.31
Fig. 3. Visualization of the mPDF of all 24 trajectories. The vertical arrows are placed at the final target.Globus Pallidus InternaA steep change in the mPDF and PSD was detected asthe microelectrode penetrated the GPi compared to recordings from the border cells and the GPe. Similarly,there was a steep drop in the mPDF and PSD as the microelectrode moved out of the GPi. The energy changeand the autocorrelation and partial autocorrelation fromthe different nuclei and cell structures were less notable.DiscussionThe objective of MER analysis of the stereotactic trajectory is to precisely confirm a target location. The aimis to improve debilitating conditions associated with PD32Stereotact Funct Neurosurg 2006;84:28–34by either ablating neurons or implanting DBS electrodes.Despite dramatic improvements observed after DBS implantation [1, 2, 12–15], the ideal anatomical and physiological location of the target within the GPi and STN haseluded investigators. Moreover, controversy exists as towhether the STN is a better target for DBS than the GPi[3]. One of the critical issues in determining optimal target nuclei is that there are currently no universal, consistent MER-based standards of target localization, whichcompare target placement with clinical outcome [5, 7].Without consistent MER standards one cannot determine if the additional risks incurred by MER are justified[12, 16]. Consequently, more consistent and objectiveMER analysis techniques [1], which address universalMER analysis standards, target placement, and comparison of clinical outcome, are needed to aid in determiningFalkenberg /McNames /Burchiel
Table 3. Assigned confidence scoresdistinguish dorsal and ventral borderfeatures of the GPe and 4.9835GPi 421.9927.3934GPi 19.6927.635GPi 2.4826.9824GPi 821.9834GPi 18.1427.2424GPi 15.1125.2134GPi 103StartEndGPi 104StartEndConfidence: 1 (lowest) to 5 (highest). Blank cell Not recorded; start beginning ofGPe or GPi nuclei; end end of GPe or GPi nuclei.the optimal target nuclei, target site, and to ultimatelyjustify the use of MER [12].In addressing the current need for improved MERanalysis during surgery, the scope of the study was to improve consistency, reproducibility and ease of target determination during surgery. We did not address the physiologic significance of the graphical displays. Nevertheless, the methods lend themselves to future physiologicalinquiry. The automatic methods allow for multiple analyses and visualizations of distinguishing characteristicsof the GPi trajectory. The methods are capable of characterizing structures and distinguishing dorsal and ventralborders of the GPi even when the signal-to-noise ratio islow and when spike detection is impossible.There is a great deal of variation in MER propertiesbetween each of the patients’ hemispheres, as well as thesignal characteristics between patients. These variationsin patient groups as seen in the different degrees of marginal probability densities along the trajectory are demonstrated in figure 3. Several explanations may accountfor this variability. Firstly, it seems possible that theremay be different degrees of neuronal degeneration in theGPi of PD patients, and having less discernable differences between GPe and GPi may indicate a different degree of neurodegeneration. Secondly, asymmetricalhemispheres within the same patient, anatomical differences and possible changing mental state during surgerymake it practically difficult to record an identical trajectory despite equivalent stereotactic angles.There were no obvious differences between the GPeand the border cells regarding the energy, PSD, mPDF,ACF or partial ACF. Data were often recorded from multiunit MERs, consequently, the rate and firing patternsare not characteristic of single unit recordings. AlthoughAutomatic Microelectrode Recording ofthe Globus Pallidus InternaStereotact Funct Neurosurg 2006;84:28–3433
the GPe exhibits very distinct firing patterns [17], thesecharacteristics were not always easily distinguishable under our recording parameters. It is possible that multiunitrecordings mask the distinct patterns of the GPe, whenfor instance, one GPe cell pauses other neighboring cellsmay not, which in effect masks the distinct patterns thatwould normally be observed with individual cells. Consequently, the differences between GPe and GPi were notreadily distinguishable using our analytical recordingparameters.Final target location in relation to the dorsal and ventral GPi borders varied even in the trajectories thatshowed distinct mPDF borders (fig. 3). Final target depthvariability, despite plots with distinct GPi borders, supports the value of our analyses and visualization techniques to aid the neurosurgeon in determining and visualizing the GPi trajectory and target.Distinct regions of the trajectory could be visualizeddespite multiunit recordings with low signal-to-noise ratio, and when individual spike detection was not possible.These analyses and visualization methods demonstraterobustness and ease of use, which shows promise for intra- and interclinical comparisons of target characteristics and associated clinical outcome with DBS microelectrode placement in PD patients.ConclusionMERs were acquired from conscious PD patients under local anesthesia during a relaxed state. The MERstypically contained multiple units in the external and internal segments. Postoperatively, automatic visualizationand analysis methods, not requiring spike detection, wereexamined. In practice, these methods could be appliedduring surgery. Automatic MER analysis and visualization along the stereotactic trajectory shows promise inimproving consistency of target placement. This type ofanalysis and visualization may serve as a basis among different investigators for comparing DBS target localization, clinical outcome and ultimately determining themost appropriate stimulation target site.AcknowledgmentsThe authors would like to express their appreciation to Drs.Tony Whitworth, Michael Sandquist, and Joseph Christiano forparticipating in the surgeries, and to Shirley McCartney, PhD, foreditorial assistance. This research was funded in part by the Medical Research Foundation of Oregon (Award No. ANEUS0020 toK.J.B.) and the Department of Neurological Surgery at the OregonHealth and Science University.References1 Burchiel KJ, Anderson VC, Favre J, Hammerstad JP: Comparison of pallidal and subthalamic nucleus deep brain stimulation foradvanced Parkinson’s disease: results of arandomized, blinded pilot study. Neurosurgery 1999; 45: 1375–1382; discussion 1382–1384.2 Obeso JA, Olanow CW, Rodriguez-OrozMC, Krack P, Kumar R, Lang AE: The DeepBrain Stimulation for Parkinson’s DiseaseStudy Group – Deep-brain stimulation of thesubthalamic nucleus or the pars interna ofthe globus pallidus in Parkinson’s disease. NEngl J Med 2001;345:956–963.3 Vitek JL: Deep brain stimulation for Parkinson’s disease. A critical re-evaluation of STNversus GPi DBS. Stereotact Funct Neurosurg2002;78:119–131.4 Guridi J, Gorospe A, Ramos E, Linazasoro G,Rodriguez MC, Obeso JA: Stereotactic targeting of the globus pallidus internus in Parkinson’s disease: imaging versus electrophysiological mapping. Neurosurgery 1999;45:278–287; discussion 287–289.5 Starr PA, Vitek JL, Bakay RA: Ablative surgery and deep brain stimulation for Parkinson’s disease. Neurosurgery 1998; 43: 989–1013; discussion 1013–1015.346 Lewicki MS: A review of methods for spikesorting: the detection and classification ofneural action potentials. Network 1998; 9:R53–R78.7 Sterio D, Zonenshayn M, Mogilner AY, RezaiAR, Kiprovski K, Kelly PJ, Beric A: Neurophysiological refinement of subthalamic nucleus targeting. Neurosurgery 2002; 50: 58–67; discussion 67–69.8 Favre J, Taha JM, Baumann T, Burchiel KJ:Computer analysis of the tonic, phasic, andkinesthetic activity of pallidal discharges inParkinson patients. Surg Neurol 1999; 51:665–672; discussion 672–673.9 Hayes M: Statistical Digital Signal Processing and Modeling. New York, Wiley, 1996.10 Brockwell P, Davis R: Time Series: Theoryand Methods. New York, Springer, 1991.11 Priestley MB: Spectral Analysis and TimeSeries. New York, Academic Press, 1983,p 890.12 Pollak P, Fraix V, Krack P, Moro E, MendesA, Chabardes S, Koudsie A, Benabid AL:Treatment results: Parkinson’s disease. MovDisord 2002;17(suppl 3):S75–S83.Stereotact Funct Neurosurg 2006;84:28–3413 Limousin P, Krack P, Pollak P, Benazzouz A,Ardouin C, Hoffmann D, Benabid AL: Electrical stimulation of the subthalamic nucleusin advanced Parkinson’s disease. N Engl JMed 1998;339:1105–1111.14 Siegfried J, Lippitz B: Bilateral chronic electrostimulation of ventroposterolateral pallidum: a new therapeutic approach for alleviating all parkinsonian symptoms. Neurosurgery 1994; 35: 1126–1129; discussion1129–1130.15 Volkmann J, Sturm V, Weiss P, Kappler J, Voges J, Koulousakis A, Lehrke R, Hefter H,Freund HJ: Bilateral high-frequency stimulation of the internal globus pallidus in advanced Parkinson’s disease. Ann Neurol1998;44:953–961.16 Zonenshayn M, Rezai AR, Mogilner AY,Beric A, Sterio D, Kelly PJ: Comparison ofanatomic and neurophysiological methodsfor subthalamic nucleus targeting. Neurosurgery 2000; 47: 282–292; discussion 292–294.17 Hutchison WD, Lozano AM, Davis KD,Saint-Cyr JA, Lang AE, Dostrovsky JO: Differential neuronal activity in segments ofglobus pallidus in Parkinson’s disease patients. Neuroreport 1994;5:1533–1537.Falkenberg /McNames /Burchiel
ent recording depths. Ta b l e 1. PD study patients: summary information Identifi-cation Sex Age years Disease duration, years Inclusion criteria GPi 100 F 64 30 IP, DID GPi 101 F 73 20 IP, TR, OO GPi 102 F 59 17 IP, DID, BR GPi 103 M 66 9 IP, DID, DYS GPi 104 F 66 20 IP, DID, OO GPi 106 F 55 18 IP, DID, OO GPi 107 M 76 8 IP, TR, DID GPi 108 M .