Transcription
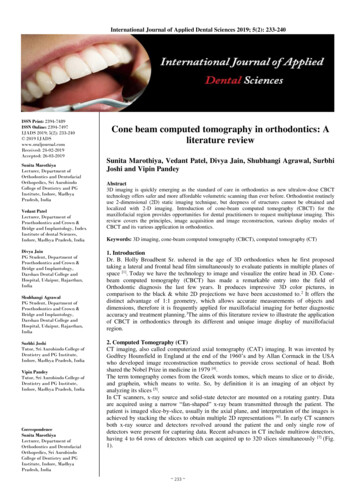
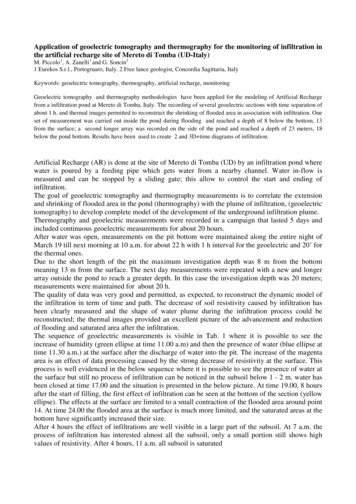
Application of geoelectric tomography and thermography for the monitoring of infiltration inthe artificial recharge site of Mereto di Tomba (UD-Italy)M. Piccolo1, A. Zanelli1 and G. Soncin21 Eurekos S.r.l., Portogruaro, Italy. 2 Free lance geologist, Concordia Sagittaria, ItalyKeywords: geoelectric tomography, thermography, artificial recharge, monitoringGeoelectric tomography and thermography methodologies have been applied for the modeling of Artificial Rechargefrom a infiltration pond at Mereto di Tomba, Italy. The recording of several geoelectric sections with time separation ofabout 1 h. and thermal images permitted to reconstruct the shrinking of flooded area in association with infiltration. Oneset of measurement was carried out inside the pond during flooding and reached a depth of 8 below the bottom, 13from the surface; a second longer array was recorded on the side of the pond and reached a depth of 23 meters, 18below the pond bottom. Results have been used to create 2 and 3D time diagrams of infiltration.Artificial Recharge (AR) is done at the site of Mereto di Tomba (UD) by an infiltration pond wherewater is poured by a feeding pipe which gets water from a nearby channel. Water in-flow ismeasured and can be stopped by a sliding gate; this allow to control the start and ending ofinfiltration.The goal of geoelectric tomography and thermography measurements is to correlate the extensionand shrinking of flooded area in the pond (thermography) with the plume of infiltration, (geoelectrictomography) to develop complete model of the development of the underground infiltration plume.Thermography and geoelectric measurements were recorded in a campaign that lasted 5 days andincluded continuous geoelectric measurements for about 20 hours.After water was open, measurements on the pit bottom were maintained along the entire night ofMarch 19 till next morning at 10 a.m. for about 22 h with 1 h interval for the geoelectric and 20’ forthe thermal ones.Due to the short length of the pit the maximum investigation depth was 8 m from the bottommeaning 13 m from the surface. The next day measurements were repeated with a new and longerarray outside the pond to reach a greater depth. In this case the investigation depth was 20 meters;measurements were maintained for about 20 h.The quality of data was very good and permitted, as expected, to reconstruct the dynamic model ofthe infiltration in term of time and path. The decrease of soil resistivity caused by infiltration hasbeen clearly measured and the shape of water plume during the infiltration process could bereconstructed; the thermal images provided an excellent picture of the advancement and reductionof flooding and saturated area after the infiltration.The sequence of geoelectric measurements is visible in Tab. 1 where it is possible to see theincrease of humidity (green ellipse at time 11.00 a.m) and then the presence of water (blue ellipse attime 11.30 a.m.) at the surface after the discharge of water into the pit. The increase of the magentaarea is an effect of data processing caused by the strong decrease of resistivity at the surface. Thisprocess is well evidenced in the below sequence where it is possible to see the presence of water atthe surface but still no process of infiltration can be noticed in the subsoil below 1 - 2 m. water hasbeen closed at time 17.00 and the situation is presented in the below picture. At time 19.00, 8 hoursafter the start of filling, the first effect of infiltration can be seen at the bottom of the section (yellowellipse). The effects at the surface are limited to a small contraction of the flooded area around point14. At time 24.00 the flooded area at the surface is much more limited, and the saturated areas at thebottom have significantly increased their size.After 4 hours the effect of infiltrations are well visible in a large part of the subsoil. At 7 a.m. theprocess of infiltration has interested almost all the subsoil, only a small portion still shows highvalues of resistivity. After 4 hours, 11 a.m. all subsoil is saturated
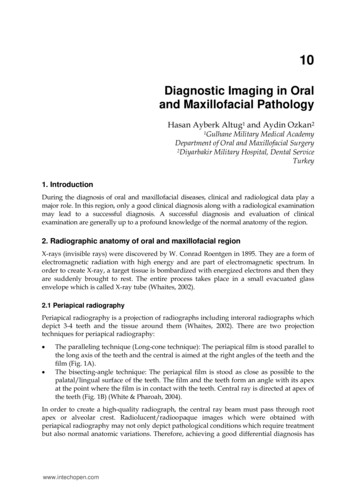
Tab.1Thermal images of the pond have been taken in parallel with the geolectric measurements with thegoal to make visible the area flooded and saturated by water. The images in below Tab 2. show thegreat advantage determined by thermo-images for the reconstruction of the water advancementduring the filling of the pond.Tab.2
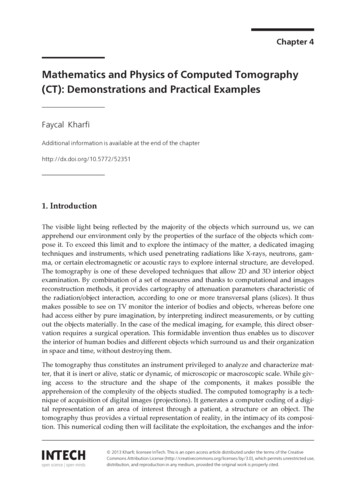
A second campaign of investigation based on geoelectric profiles with a length of 135 m took placeon March 20-21 and permitted to reach a total depth of about 23 metres. To correlate these oneswith those recorded in the pit a difference of 5 metres has to be considered due to the difference ofelevation. The point 0 of the profiles in the pit corresponds to the point 48 of the external ones.Those profiles were recorded at intervals of about 1 h, the most representative ones are presented inTab. 3. Infiltration started at 12.00 and finished at 17.00 but it should be remembered that water wasinfiltrated during the previous day or the measurements in the pit.In fact the three first profiles (time 12.00, 13.00 and 14.00) show a low resistivity at a depth ofabout 15 metres already at the start of infiltration, and this is not, of course, compatible with the ongoing infiltration.The geoelectric profile recorded at time 16.45 shows the disappearing of those low resistivity areascaused probably by the previous day’s infiltrations but at the meantime the on-going infiltrationshave not yet reached the subsoil interested by the investigations.At time 20.00 some effects of infiltration are visible at the bottom of the section, about 20 m fromthe surface, but only 15 m from the pit bottom, and hour after hour for the effect of infiltration thislow resistivity area get larger and resistivity decreases.This process continues till time 23.00 when that water has almost trespassed the area leaving onlywet soil. This evidence is proved by the confrontation between sections at time 20 and time 21,where the very low resistivity area below 120 Ohm/m (light blue-blue) has reduced its size leavingthe soil wet (yellow/green 250-400 Ohm/m) instead of fully saturated. This process continues tilltime 03.00 with a strong with further decrease of humidity (light brown 400-500 Ohm/m) and ashrinking of the wet area.About time 04.00 a significant inversion of resistivity values has been detected at the bottom of thesection; resistivity decreases and the wet area gets larger till time 05.00.The interruption (black arrows in the pictures) of the high resistive layer suggests that some amountof water has reached this level from a level at the bottom of the nearby pit, as confirmed by thecomparison of depth.The geoelectric section recorded at time 05.00 shows the shrinking of the low resistivity area at thebottom and a increase of the interruption of the high resistivity level (blue arrow). At time 07.00 thegap start closing and slowly migrates toward the end of the section as visible till time 09 and 10.In the meantime a low resistivity area starts to develop at the bottom of the section (green arrow)and grows up till time 10.00 end of measurements.The only justification for this behavior is the upward movement of water due to the presence of alow permeable layer causing an accumulation of infiltration water, the capillarity of the soil gives afurther contribution to the upward creation of a low resistivity area, the time delay and migration ofthe low resistivity spot could be caused by different time of arrival of water due to the fact that pitdoes not discharge evenly but the northern part still maintain some water after the southernmost oneis already empty.
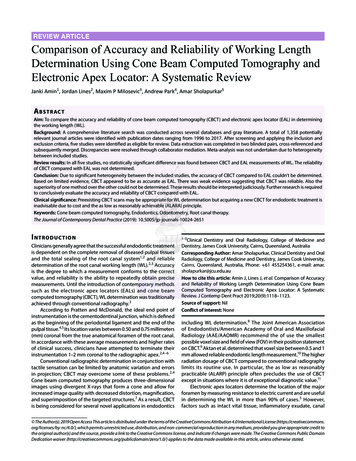
Tab.3Modeling of infiltrationGeoelectric and thermal measurements have been processed to obtain a model of infiltrationconsidering the variation of flooded area and the downward movements of infiltrated water. Tabs. 4shows the variations of resistivity of the subsoil caused by infiltration.Diagrams have been obtained by the correlation of measurements along 5 geoelectric lines; each setof data for a certain time refers to depths from 2, 4, 6 and 8 meters below pit bottom.Resistivity values are depicted both in color and vertical scale for a clear vision of variations.The infiltration process is well defined by the increase of the blue area (low resistivity) starting attime 12.00 depth 2 m and then develops downward. It is possible to see, by the comparison of dataat time 14.00 and 15.00, the contraction of the blue area at depth 2 as the infiltration proceedsdownward.
Tab.4a. Variations of soil conductivity in time at different depths.The same approach has been used to develop the model of development of flooded area shown inTab. 5.Tab. 5.Diagrams of T distribution at thesurface
ConclusionsThe joint application of geoelectric tomography and thermography has demonstrated to be a veryuseful tool for the modeling of infiltration.Geoelectric tomography can be used to monitor the downward seepage of water and its interactionwith the soil stratigraphy, while thermography can provide a very precise image of the dimension ofthe flooded and saturated area at the surface.Of course the application of thermal image analysis can only be used when infiltration is done byflooding, but in this case it is a very efficient and fast method to map the most efficient areas ofinfiltration.In the test site of Mereto di Tomba, geoelectric tomography has provided very precise data aboutthe geometry and speed of infiltration, pointing out the presence of a low permeable layer andmodeling its interferences with the downward flow of water.Thermography has permitted to map non visible water saturated areas at the bottom of the pond andprovided a precise model of the shrinking of flooded area for the effect of infiltration.The use of very fast data processing could permit to record a geoelectric tomographic section at 15m intervals; no limitation exists for the collecting of thermal images.The possibility to control remotely both geoelectric and thermal measurement has been studied andsuccessfully tested by the combined used of Wi-Fi and internet data transmission.This will allow to monitor round-the-clock, if necessary, the entire process of infiltration.In conclusion both technical and scientific results have been achieved; the model of infiltration hasbeen reconstructed and the advantages coming from the joint application of geoelectric and thermalmeasurements has been proved.
tomography) to develop complete model of the development of the underground infiltration plume. Thermography and geoelectric measurements were recorded in a campaign that lasted 5 days and included continuous geoelectric measurements for about 20 hours. After water was open, measurements on the pit bottom were maintained along the entire night of