Transcription
Cross-Cutting Activities - Long-termneeds and socio-economic researchTask 6 – Software DevelopmentKPI Tool – User Manual
Zoetermeer , 04 December 2020
Table of contentsA12991Table of contents3Document history51Introduction62Objective and 62.3.72.3.82.42.4.12.4.22.4.32.4.4Structure and objective of this documentMethodology usedUser requirements summarizedPresenting KPIsHandling the input dataTechnology filterMain features of the KPI ToolData governanceUser accessUser rolesHardware and softwareWorkflow and usage of the KPI ToolUsage pattern for each user role assumedRecommended workflow for each user role assumedUnderstanding Summary Sheets in the Excel modelTypical Use Cases of the KPI Tool3Using the KPI 33.4.4General featuresUser Roles in the KPI ToolAnonymous user modeCharacteristics of the user interfaceGeneral functionalitiesDashboard structures and chart typesChart controlsFunctional descriptionUser role: Data viewerUser role: Data managerStructure of the KPI Model and its definition processUnderstanding the model structureModel workspaceKPIs and their attributesData columns and data filesCharts, collapse panels and dashboardsExecutive viewsUser role: Model managerMenu ModelsMenu WorkspaceMenu KPIsMenu Data 131323232333333333438403
43.4.53.4.63.53.5.13.5.23.5.3Menu EditImage LibraryUser role: System administratorUser managementAdding, editing and deleting a userUser groups4Hardware and software4.14.1.14.1.24.1.34.1.44.1.5Hardware and software environmentKPI Tool architectureKPI Tool installation and deploymentRequired system parametersInstallation, migration and deployment conceptIntegrating into Shift2Rail web ningTrainingTrainingTrainingTraining6Maintenance and change management6.16.26.3Maintenance servicesMaintenance categoriesChange Management 991
Document rst version of the KPI Tool UserDKManual; the user role ModelManager to be elaborated1.122.11.2019Model Manager elaborated; furtherDKminor amendments1.202.12.2019Feedback from Shift2Rail reflectedDK(as from the telco of 25.11.2019)1.319.12.2019User Roles explained, MaintenanceDKdescribed (based on feedback)1.410.01.2020Minor changes as on feedbackDK1.520.01.2020Migration, deployment andDKtraining concept added2.019.10.2020Updated User Manual for the finalDKversion of the KPI Tool2.1A1299104.12.2020Feedback from Shift2Rail reflectedDK5
Introduction1This document contains the User Manual of the KPI Tool, being developed within theproject and its task T6. Specifically it relates to the final version of the KPI Tool, aspresented in October 2020.The KPI Tool, based on the underlying KPI Model, provides Shift2Rail with anintegrated framework of Key Performance Indicators (KPIs) defined in the Regulationfor the follow-up on its objectives, demonstrating the KPIs’ utility, assessingtechnology developments defined in the Shift2Rail Programme.6A12991
22.1Objective and methodologyStructure and objective of this documentObjective of this document is to allow the user using the KPI Tool in an easy andunderstandable way, considering all the user roles defined for it. The documentdescribes therefore the overall structure of the KPI Tool and its intern logics, themenus and commands, user settings, login procedures and more.The document is structured as follows: Chapter 2 (the current one) summarizes the user requirements in the firstplace, and then, based on them, introduces the suggested workflow andrecommended usage of the KPI Tool by each user role. Chapter 3 defines the user roles of the KPI Tool, explains the general featuresof the user interface, and then describes in detail the functionalities of the KPITool for each user role. Chapter 4 includes miscellaneous topics as governance and the systemadministration.2.2Methodology usedThe KPI Tool is based on the underlying KPI Model, which is developed under the S2Rproject IMPACT-1 (730816) and IMPACT-2 (777513). The present KPI Tool presentsthe outputs of the model, including personalised scenario modelling.2.3User requirements summarizedThe following section describes the software tool requirements from the user’s point ofview, as summarised upon consultations with Shift2Rail.2.3.1 Presenting KPIsThis set of user requirements defines the required functionalities related to the tasksof viewing and presenting the KPIs. Primary dashboard view showing multiple charts, tables, and/or values Secondary dashboard(s) as defined by the Shift2Rail JU, with a “click-through”feature to switch between them Executive View with tiles for a quick access to various dashboard or charts,presenting also numeric values Presenting KPIs and results of the model in various chart types and/or tabletypes, in coherence with the SPDs and IPs Implementing colour schemes or palettes to apply different colours to charts,dashboards and tiles A12991Exporting the data in XLS and PNG formats appropriate for further processing7
2.3.2 Handling the input dataThis set of user requirements defines the required functionalities related to the tasksof managing input data. Importing the KPI data values in the structure defined by the model Exporting the data structures and/or KPI values Optional manual corrections of the data within the KPI Tool2.3.3 Technology filterThis set of user requirements defines the required functionalities for manipulatinginput and output figures as to model the future possible scenarios. Creating scenario(s) based on the parameter groups activated or deactivated Comparing the baseline value, Shift2Rail value, and scenario value in differentdata series of a chart2.3.4 Main features of the KPI ToolThis set of user requirements defines the required functionalities for modifying thepresentation of the results of the KPI model, which allow later flexible changes Defining workspace for the KPI model – units, dimensions, categories andformats Defining each KPI Ability to define various attributes of the KPI – as name, data type, valuerange, data sources, update frequency etc. Ability to define and make changes in the KPI structure, and KPI parameters Ability to define and make changes in the KPI presentation – defining thestructure of the dashboard(s), charts and collapse panels Allocation of the users roles2.3.5 Data governanceThis set of user requirements defines the required functionalities for a SystemAdministrator. Data security – securing the KPI Tool access and restricting changes to theauthorised users Authorising users for his or her tasks – viewing data (read only), modifyingdata (read-write), modifying the model (read-write structure) Password protection – password requirements to be defined, password orcredentials for accessing the tool and its data to be required 8Data backup and recoveryA12991
2.3.6 User ionalitiesfora SystemAdministrator related to the user management. Supporting the multi-user environment, allowing multiple parallel users to belogged in and working with the Tool Defining the user roles, access rights for each role, and assigning users toeach role and to each user group Approving the user access and his or her roles2.3.7 User rolesAs stated previously, the KPI Tool supports in total five user roles for processing andviewing the KPIs in the charts and dashboards provided (including the SystemAdministrator and anonymous user). Each user has to be registered in the system,i.e. introduced by the System Administrator, except the anonymous user, which hasa limited access to the tool. The following five user roles are to be differentiated: Anonymous user – a public user accessing the KPI Tool via the publicwebsite of Shift2Rail, with a read-only access, i.e. restricted for the dataviewing and analysing similarly to Data Viewer, however without any rights forthe user-specific actions as saving scenarios Data Viewer – a registered user with a read-only access to the data, which issupported only with features for viewing the data, charts and dashboards, andfor scenario modelling, complemented with the chart and dashboard exports;basically a Data Viewer is the end user (analyst) of the KPI data, reports andcharts, who does not concern with the data preparation and data verificationor with the model structure Data Manager – a registered user with a read-write access to the data, beingsupported with features for data management, i.e. import, export, andcorrections (additionally to the features available for the Data Viewer);basically this means that the Data Manager is responsible for the data whichare available in the KPI Tool; he or she is responsible for the data file, but notfor the structure of the data and/or of the charts dashboards Model Manager – a registered power user with a read-write-structure accessto the data, i.e. with authorization to define and change the model itself,including the KPI workspace, all the KPIs and their structure, correspondencewith the Excel data files, and to define and change the dashboard and chartstructures (again, additionally to the features available for the Data Managerand Data Viewer); the Model Manager is therefore a person with the topresponsibility for the KPI Tool model itself, for the structure of the data, of thecharts and dashboards; in the case of the joint user rights and jointresponsibility, he or she may be responsible for the data management as well System Administrator – a special user with administrative privileges in theKPI Tool, i.e. with authorisation to add and edit user accounts and usergroups, to view the event log, and possibly to perform other administrativetasksA129919
The user privileges of each user role are described in the following table.User gerAdminViewing data Exporting charts and Managing data files Exporting and importing dashboardsModelling scenarios Technology filterSaving and retrieving scenariosdataEditing data Managing model Editing workspace (units, Creating possible new KPIs Creating & editing charts, data types etc.)collapse panel, dashboardsAdding and editing user Adding and editing user groupsViewing event log Other administrative tasks Table 1: Various functional areas of the KPI Tool and the user role privileges2.3.8 Hardware and softwareThis set of requirements shall define the required hardware and software environment.The final specification of the hardware and software environment will be suggestedbased on the requirements or policies set by the Shift2Rail JU. Multi-user access to the web-based service to be supported Development environment, testing environment, and production environmentto be set separately User Interface defined in compliance with the Shift2Rail UI design manual (ifapplicable) Target hardware and software environment defined in compliance with theShift2Rail HW&SW policy and/or standard environments (if applicable) Backup policy defined in compliance with the Shift2Rail backup policy (ifapplicable) icies(ADir/LDAP/Kerberos)The underlined items are requested from the Shift2Rail JU to build the detailedspecifications on.10A12991
2.4Workflow and usage of the KPI ToolThe following section defines how the KPI Tool is to be used by each user role, andhow these user roles match together to provide a complete and consistent processsolution of monitoring the KPIs.2.4.1 Usage pattern for each user role assumedBased on the user roles specified in 2.3.7, the following workflow structure is assumedfor using the KPI Tool. This logical structure defines tasks of each level or eachprocess (excluding the System Administrator from the list, considering the specificnature of this user role):1.The Data Viewer (including the possible anonymous user) is the ultimateuser of the KPI Tool and of its outputs. This person can perform the KPIviewing, KPI presenting and exporting, and also using the technology filter.The typical usage pattern of the Data Viewer lies therefore in a dashboard,drilling down the charts, and detailed data (where available) .The Data Viewer is also able to export the charts, and optionally the detaileddata.These tasks hold true generally for both registered user and anonymous user;the anonymous user has, however, a limited access to the Tool and thereforemay not use the full set of functionalities, as described in more detail in 2.3.7and also in 3.1.2.2.The Data Manager takes care to update the data as structured by the inputand output information in the KPI model, to maintain the data meaningful intheir values and correcting the obvious inconsistencies. The Data Managerverifies therefore the KPI Excel Model for completeness and correctness,including the Improvement values, and calculations with their result. Then theData Manager opens the Excel data file, stored on the server storage of theKPI Tool, and gets them imported into the KPI Tool. Now they are ready forthe Data Viewer.The typical usage pattern of the Data Manager is therefore seen in the KPIExcel Model, used for the calculations and the first visual checks, and in the UIfor importing the data files.The Data Manager may also export the model structure or its part, optionallyincluding the existing data, to continue the processes of data collection.3.The Model Manager is responsible for the fully functional and logically correctKPI Model implementation in the first place. This person translates thestructure of the whole KPI Model, i.e. the KPI workspace (categories,frequencies, units, formats), structure of the KPI model, data sources chdefinethegroundworks of the whole model. The Model Manager defines also charts,collapse panels and dashboards, and assigns them to the user groups.The typical usage pattern of the Model Manager is unambiguously anchoredto the UI handling the model, translating the whole model, the input KPIs,intermediate KPIs, and high-level strategic KPIs, and also defining the charts,collapse panels,interdependenciesdashboards and executiveanddescriptionsorviewstooltips.with their structures,TheModelManagerisresponsible for the KPI Model being logically correct and structu red, for beingA1299111
based on correct assumptions and interdependencies, and for being inaccordance with the charts and dashboards. Upon certain changes in the KPImodel, as e.g. deleting a data column from an input data file, the dashboardsand charts may become invalid; it is also one task of the Model Manager tocheck these interdependencies and correct them when necessary.With respect to different usage by each user role, both the functionalities and the userinterface differ between these. Should a specific user be assigned to multiple userroles, then all the relevant functionalities are available for him or her.2.4.2 Recommended workflow for each user role assumedThe basic expected workflow of the KPI Tool is depicted on Figure 2. Below under thefigure, the most characteristic usage patterns are described. These reflect then in theinstructions for using the KPI Tool in Chapter 3, which defines the available actions foreach person using the KPI Tool.DataViewerDataManagerModelManagerFigure 2: Workflow expected by the KPI ToolWorkflow recommended or foreseen for the Model Manager when building a brandnew KPI model in the KPI Tool is as follows:1.Defining the KPI workspace: defining dimensions, categories, units, andformats – delimitating the basic building blocks for the KPI model2.Defining input files – a simple list of files which define logical grouping ofthe KPIs on File Columns into Data Files3.Defining the KPIs themselves, in the bottom-up approach, according tothe interdependencies and KPI attributes defined in the model12A12991
4.Verifying the KPI model, its completeness, validity, consistency; after thisstep, the KPI model is ready to be handed to the Data Manager for his orher tasks to be accomplished5.Defining the charts, collapse panels and dashboards as necessary forthe proper presentation of the KPI valuesWorkflow recommended or foreseen for the Data Manager when managing the dataitself in the KPI Tool is as follows:1.Opening the KPI Model as defined by the Model Manager.2.Exporting the data file structure to get the framework for providing data3.Collecting the input data or interface KPIs (sheet Improvement in the KPIExcel Model) according to the processes specified and according to theShift2Rail project structures4.Importing the XLS data file containing the KPI Excel Model5.After possible correction of all the data and after a successful import,handing the data to the Data ViewerFigure 3: Generic data file (XLS format) with a dummy data exampleFor the Data Viewer, a more flexible workflow is assumed: he or she will launch theKPI Tool with the high-level charts and data tables, and will drill down to lower levelsas needed. He or she may also employ the Technology filter and activate ordeactivate the relevant parameter groups to model impacts of various measures. Aftershowing the scenario values in the charts and dashboards, he or she may export thecharts using the export feature.2.4.3 Understanding Summary Sheets in the Excel modelThe IMPACT KPI Excel Model stands at the core of the KPI calculations. Here all thebusiness logics of the calculations and interdependencies are defined, together with allthe formulas and conditional branches necessary to arrive at the desired results. Tofacilitate the data transfers and data transformations between the KPI Tool and theKPI Excel Model, the interface summary sheets are defined. They provide the inputvalues and results of the Excel Model in an unambiguous and easily readable format.This way, the “feedback loop” for manipulating values needed for technology filterfunction.A1299113
Figure 4: The Summary Sheets and feedback loop for scenario modellingKPI Tool Input SheetThe KPI Tool Input Sheet, by convention named “KPI Tool IN”, summarizes basicallyall the input values (parameters) to be manipulated for the technology filter.Figure 5: An example KPI Tool Input SheetThe Input Sheet defines, for each parameter, the following columns (attributes): 14Param Group – Assigns the parameter into a group which can be manipulatedin a batch using the technology filter.Param Name – Parameter name as used in the Excel Model. For the KPIDashboard Tool it is defined as an arbitrary string.A12991
SPD – A specific SPD for this parameter – constituting a dimension of theparameter values. Actually the parameter name together with the SPD valueand optionally other dimension values define unambiguously one parameter.Cell – Reference to the Excel cell in the sheet “Improvement”. May be usedfor internal purposes in the Excel Model.Low – The lowest acceptable value of the parameter.High – The highest acceptable value of the parameter.Note: the columns “Low” and “High” in the file “KPI Model Example.xlsx” areset to arbitrary default values. They are to be replaced by the proper limit values as needed.Baseline – The baseline value of the parameter to be processed andrendered.Scenario – The parameter value to be processed and rendered, as set by thecurrently modelled scenario. This value is to be modified by the KPI Tool:generally the Scenario value will be set either to the Baseline value (when theparameter group is “ticked off” i.e. inactive), or the S2R Improvement value(when the parameter group is “ticked on” i.e. active).Note: In the 2 nd phase the full-fledged scenario modelling is foreseen. Theuser will be able then to manipulate the parameter values arbitrarily (not only“tick on x tick off”), based on the parameter list specified (will be pr ovided by JU and WA, based on each user group).S2R – The currently valid Shift2Rail Improvement parameter value. It can beconsidered fixed until the next update on the Improvement parameters andthe KPI Tool should not overwrite these values.Real – Specifies whether the real Shift2Rail Improvement values are to beinvolved in the KPI calculations (Real YES), or the baseline values of 0%(Real NO). Currently this column is seen as obsolete.Show – Specifies whether the parameter is to be shown in the KPI DashboardTool (YES/NO).Note: Parameters with Show NO may be used e.g. for internal purposes orcalculations.The KPI Tool Input Sheet (“KPI Tool IN”) serves for the scenario modelling, asmentioned before. It is fully flexible, in the sense that it remains functional even uponadding a new parameter or new parameter group.Column A in the KPI Tool Input Sheet may not contain any empty cells, otherwisethe calculation will halt and will arrive to confused results.KPI Tool Output SheetThe KPI Tool Output Sheet, by convention named “KPI Tool OUT”, summarizes all theresulting output values of the Excel Model and its calculations onto one sheet, to beprocessed and rendered in the KPI Dashboard Tool. It contains the values of all theKPIs defined for the KPI Tool, for all the dimensions values. This way it implementsthe function “sample and hold”.This Excel sheet must specify all the values, which are to be rendered in the chartsand/or further processed by the KPI Tool.A1299115
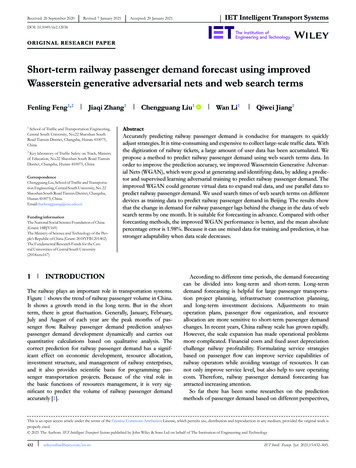
Figure 6: An example KPI Tool Output SheetThe generic structure of the Output Sheet has been described above. For theShift2Rail model, it contains the following columns, to show three values of each KPI(baseline, scenario, Shift2Rail): SPD – A dimension defining the specific SPD for each row.IP – A dimension defining the specific IP for each row.LCC, Punctuality, Capacity – The top-level KPI values for the specific SPDand specific IP:oLCC Baseline, Punctuality Baseline, Capacity Baseline – thebaseline values of each KPI; as the other values are shown as thepercentage relatively to the baseline, the baseline itself must showalways 0%oLCC Scenario, Punctuality Scenario, Capacity Scenario – the KPIvalues for the currently modelled scenario via the technology filteroLCC S2R, Punctuality S2R, Capacity S2R – the KPI valuescalculated for the currently valid set of “Improvement” parametersdefined by the Shift2Rail JU membersoCapacity deviation train Sc, Capacity deviation pax Sc,Capacity deviation train S2R, Capacity deviation pax S2R –additional capacity KPI values for rendering the bubble charts ofcapacity. The capacity chart was turned into a bar chart for betterunderstanding of basic users.These values are to be transferred from the “Overview” sheet in the Excel Model. Forthe “feedback loop” and scenario modelling using the Technology filter, an automatedmechanism is defined.Establishing the Summary SheetsThe Summary Sheets are a necessary prerequisite for the KPI Tool to work. They needto be defined therefore also for each new version of the Excel model. The simplestway to establish the Summary Sheets is to transfer them (Copy/Paste) from anexisting KPI Excel Model; their structure is defined in this way, and their v alues arethen calculated automatically by the Technology filter feature of the KPI Tool.16A12991
Figure 7: Shift2Rail KPI dimensions and key values2.4.4 Typical Use Cases of the KPI ToolFor a better understanding of the KPI Tool and its usage patterns, this sectiondescribes the most typical Use Cases, i.e. the most typical situations which arehandled by the authorised users of the KPI Tool.1.Data Viewing and presenting. This is a typical basic task of the DataViewer and of the anonymous user. The task involves using the charts anddashboards, analysing the data, and exporting outputs (when available).Neither data modifications nor model structure modifications are necessary.2.New data values from the TDs. Changing data is a typical basic task of theData Manager, as described above in this section 2.4. The Data Managerneeds the updated the KPI Model when there is an update in the model.IMPACT members needs to provide the new data from the TDs (or eventuallyfrom other sources, as specified in the relevant internal processes ofShift2Rail), incorporates these into the KPI Excel Model (generally on theImprovement tab). After that, the Data Manager imports the data into theKPI Tool. To import the data, it is necessary to include the Summary Sheetsinto the KPI Excel Model, as described in Section 2.4.3 in more detail. Thisway, the data get ready for any Data Viewer for their usage and analysis.After the import, the Data Manager checks whether the values are equal inboth, the received Excel model and the presented values in the KPI tool.3.Changing the model or charts and dashboards. Any changes in the KPIModel (should these be e.g. correcting an incorrect chart rendering, changingchart types, colours, or data series, etc.) lie in the responsibility of the ModelManager. Based on the relevant user privileges, he or she may change thestructure of the KPI model, e.g. units, formats and categories, change therendered chart structures (charts, collapse panels, dashboards and executiveA1299117
views), and also change visibility of the charts and dashboards for thecorrespondinguser groups. Tasks pertinent to the Model Manager aredescribed in more detail in Section 3.3.4.Changing model interface. As soon as any changes in the model interfaceare involved, the application code needs to be changed and adapted. Thismeans any changes on the Summary Sheets and their structure, as describedin Section 2.4.3, i.e. adding new KPI calculated by the Excel model (whichmeans new columns in the sheet KPI Tool OUT), or changing the hangeslieoutsidetheresponsibility of the Shift2Rail users, and have to be implemented by ABIRAILas the supplier of the KPI Tool. Note: minor changes, which do not involveany structural changes of the Summary Sheets, are not subject to thisimplementation schema, and may be covered by the Model Manager (e.g.adding SPD/IP category, or adding and/or redefining a Parameter Group in thesheet KPI Tool IN).5.Error or bug in the KPI Excel Model. Any errors or bugs in the Excel modelcalculations belong to the responsibility of the IMPACT team, and are to behandled in this way. This includes any internal calculation bugs, incorrectvalues of various calculation parameters or formulae, or also updates o f thecalculation formulae and calculation methods.6.Error or bug in the KPI Tool. In the case of any bug in the KPI Toolsoftware itself, ABIRAIL as the supplier of the KPI Tool is responsible for thefix. These include any malfunctions which cannot be overcome with a modelstructure setting, i.e. by functionalities available for the Model Manager, anyunexpected error messages which are apparently not pertinent to any error ordeficiency in the data, or any inconsistency which apparently results from theKPI Tool handlings. This however does not include errors in the datastructures, e.g. showing an incorrect data column in a chart or dashboard,showing incorrect units or values, or even showing an incorrect chart type; allof these example issues may be easily solved by the Model Manager and therelevant functionalities.18A12991
3Using the KPI ToolThe following section elaborates each of the aforementioned components in moredetail, based on the suggested methodology.3.1General features3.1.1 User Roles in the KPI ToolEach of the five user roles, specified in 2.3.7 together with its most important tasks, isrelated to the specific mission: Anonymous User Data Viewer Data Manager Model Manager System AdministratorThe user rights (authorization to use the corresponding features) are based onnesting principle, i.e. each user possesses all the user rights of the previous (morerestrictive) roles, and adds its unique features to the mix. The sections below describethese tasks and features in more detail for each user role.3.1.2 Anonymous user modeThe KPI Tool supports also an anonymous user mode, which does not requireproviding any username and password, and which is intended for a broader publicuser. This user mode is basically equivalent (in the sense of the user privileges orallowed functionalities) to the Data Viewer. For more details see section 2.3.73.1.3 Characteristics of the user interfaceThe KPI Tool is designed as a web-based application, with the obvious advantagesof a well-known and universally accepted look and feel, and with zero installation forthe end user, as the only prerequisite for using the tool is to have a suitable webbrowser of a supported/compatible version.The user interface is differentiated by the user roles, as these imply the functionalitiesto be accessible for the specific user. Each user role has therefore a different menustructure and UI structure.The user interface architecture reflects directly the expected workflow of using theKPI Tool as defined in Section 2.4. Due to strongly different usage by each user role,also the user interface differs between these. Should a specific user be assigned toA1299119
multiple user roles, then he or she may enjoy an extended user interface including thefunctionalities of each.Note: the illustrative screenshots in this user manual are based on Windows 8, webbrowser Firefox 70.0.1. However, the KPI Tool is intended to work universally underany web browser and operating system. The examples are also based on the user roleof the Model Manager, with the widest menu options and with the highestpermissions in the system. Therefore for the other roles, some parts of the menusmay be irrelevant.3.1.4 General functionalitiesThe following list summarizes the general functionalities available for any userworking with the KPI Tool.For all user rol
Defining workspace for the KPI model - units, dimensions, categories and formats Defining each KPI Ability to define various attributes of the KPI - as name, data type, value range, data sources, update frequency etc. Ability to define and make changes in the KPI structure, and KPI parameters