Transcription
Int. J. Intelligent Enterprise, Vol. 1, No. 1, 200765A conceptual framework for business intelligencebased on activities monitoring systemsDimitris FolinasDepartment of Applied Informatics,University of Macedonia,156 Egnatia Street,Thessaloniki 54006, GreeceFax: 30-231-089-1804E-mail: folinas@uom.grAbstract: Most enterprises have spent an enormous amount of money andtime, managing information about their business elements. Such information isoften scattered in disparate legacy, operational and enterprise informationsystems, appointing the aggregation of valuable information anddecision-making support quite difficult. Business Intelligence (BI) and theirassociated processes and tools are helping enterprises to solve this problem.This paper presents the principles and challenges of BI domain and evaluatesits current approaches. The limitations of the above approaches will provide thebasis for the design and development of a framework that pursues realtime insight to business information, as well as, instantaneous awareness andappropriate response to critical business events across the entire enterprise. Theproposed framework is based on Business Activity Monitoring (BAM) systemsparadigm and attempts to create a unified enterprise-reporting environment.It was applied in a large Northern Greek manufacturing company in the last sixmonths.Keywords: business activity monitoring systems; BAM; business intelligence;BI; enterprise information systems.Reference to this paper should be made as follows: Folinas, D. (2007)‘A conceptual framework for business intelligence based on activitiesmonitoring systems’, Int. J. Intelligent Enterprise, Vol. 1, No. 1, pp.65–80.Biographical notes: Dimitris Folinas is a Scientific Associate in theDepartment of Applied Informatics, University of Macedonia, Thessaloniki,Greece. His research interests include: e-logistics, business-to-businessintegration, supply chain integration, virtual organisation/enterprise ande-commerce models and technologies.1IntroductionToday, enterprises generate and process on a daily-basis a tremendously large volume ofdata deriving from various business activities and processes, such as procurement,manufacturing, retail, marketing, sales and distribution. Such data, is often processed byan extensive array of computer-based applications and has a significant importance to thebusiness entities towards effective and on-time decision making. However, a mainCopyright 2007 Inderscience Enterprises Ltd.
66D. Folinasdrawback of these systems is that they frequently suffer from a lack of contextualisedinformation that is reliable, accurate and delivered ‘on time’ to have a purposefulmeaning to the decision-makers. The value of information grows exponentially with theaddition of each domain of data, information or knowledge that is integrated correctlywith it. Due to the fact that data alone cannot provide corporate executives and managerswith meaningful information on the performance of their companies that they need tostay ahead of the competition, there is a critical need for up-to-date information fordecision making and for optimising critical business processes (Sveiby, 1997).Moreover, from a business perspective, the true value of any enterprise informationsystem (Enterprise Resource Planning (ERP), Customer Relationship Management(CRM) System, etc.) and/or best-of-breed business information systems (WarehouseManagement Systems (WMS), Transportation Management System (TMS), etc.), comesfrom their ability to reveal to end users the inner workings of business activities and toprovide useful insight into corporate transactions (Davenport and Prusak, 1998;Davenport et al., 1998; Natarajan and Sheklar, 2001).These business applications provided static reports and insight to transactional data,which was enough for line-level managers, but decision-makers wanted information in amore summarised fashion in order to perform strategic analyses from huge amounts ofdata that expanded in a wide time range and from multiple applications. The answer totheir requests came from the introduction of Data Warehousing (DW) and the OnlineAnalytical Processing (OLAP) approach. The concept of a DW is to simply extractoperational transaction data into a separate repository and reorganising data in adenormalised and aggregated fashion that is more appropriate for analysis andperforming queries. OLAP provided the tools to perform interactive analysis against theDW instead of operational files and databases. A DW offered the benefit of integratedsource data, which provided better data quality and consistency. It also enabled data to besummarised and kept for historical reporting and analysis. The DW approach alsoreduced the decision support load on the operational transaction systems. The advantageof the DW is that users can query data from across the enterprise. Using OLAPtechnique, analysts create complex, multidimensional analyses and deliver to businessusers meaningful insights that might not be readily apparent (Devlin, 1997; Dobbs et al.,2002; Kaplan and Norton, 1992; Ma et al., 2000; Smith, 2001).The above software applications, technologies and analytical methodologies, whichperform data analysis, constitute the Business Intelligence (BI) domain. BI capturesorganisational data from disparate sources and presents it to decision-makers through auser-friendly manner (Cooper, 1996; Sawka, 1996). It exploits all the softwareapplications, practices, technologies and analytical methodologies, which performdata analysis and provides real-time visibility and access to pertinent information,wherever its location, for each participant, to support enterprise competitiveness(Corral et al., 2005).This paper proposes a new advance of BI paradigm, the real-time BI or BusinessActivity Monitoring (BAM) systems. Many academics and non-academics todayconsider them as the next generation of BI practices and tools (Gartner Group, 2002).Previous generations of tools present decision-makers with operational reports oranalytical tools and expected to find anomalies and examine their root causes based ontheir analytical abilities. BAM systems on the contrary, combine data collection withprocess and workflow management capabilities to monitor streaming data fromoperational systems to detect exceptions or critical business events. BAM requires that an
A conceptual framework for BI67enterprise identify its Key Performance Indicators (KPI’s) and put in place a system thatallows monitoring and responding to critical changes. These systems are frequently webportal dashboards that display KPI’s in near real-time combined with automated systemmonitoring tools that notify users, via e-mail for example, when a KPI’s threshold hasbeen violated. BAM lets companies visualise business events and KPI’s in real time andin a format that’s actionable (Ibarra, 2004). It gives enterprises insight into their businessprocesses and systems through the use of dashboards and alerts. For example,notifications are sent to managers when certain critical events have occurred, such asinventory stock being under the tolerance limit on a retailer’s shelf. These notificationsappear on managers’ desktop computers or through mobile workers’ handheld devices,pagers and cell phones. By enabling users to view, analyse and act on visuallyrepresented data, businesses can make rapid, informed decisions and better manage theirperformance. Based on the above, this paper presents and analyses a conceptualframework, which constitutes a new approach for BI in enterprises.In the literature, there are many research efforts in terms of proposing conceptualframework architectures about BI domain. Sonnen and Morris (2004), Dresner andBuytendjik (2003) and Golfarelli et al. (2004) proposed Business PerformanceManagement (BPM) solutions that included both traditional tools and practices (such asDW) but they also required a reactive component, capable of monitoring the time-criticaloperational processes to allow tactical and operational decision-makers to tune theiractions according to the company strategy. Shneiderman et al. (1997) proposed a fourlevel framework as a tool to support the enterprise information aggregation process.Reiterer et al. (2000) applied Shneiderman’s framework and presented a softwaresolution for finding and analysing business information from the web.The particular framework proposed by the author, although based on the BI practicesis furthermore extended in an effort to provide an added functionality value. Moreover,in order to ensure improved usability and user-acceptance of future systems in terms ofaccuracy and time constraints, the framework aims to support only data representationthat is explicitly related to exceptional conditions. Consequently, such exceptionalconditions allow users to backtrack valuable data toward supplementary analysis andexamination. By providing relevant information to certain situations, the proposedframework can optimise decision making, improve efficiency and accelerate results.This paper is organised as follows: Section 1 presents the requirements andchallenges being faced today by enterprises that led to the advent of a new approach forBI initiative. These requirements set the foundation for the proposed framework that isbased on BAM systems, its architecture and main characteristics are described in thefollowing sections. Implementation issues of the above systems are stated and Section 6discusses the conclusions of this paper.2BI challengesBusiness world is changing and the need for accurate and timely BI is ever morepressing. Enterprises are being called upon to integrate many and/or new sources of data,many of them semi-structured or unstructured in format, to create new views ofthis information often spanning to multiple platforms and to get real time insightinto information. Following are issues and challenges that enterprises face today interms of BI.
68D. FolinasInitially, enterprises must store and manage data from multiple different sources suchas ERP, CRM, legacy systems, web servers, e-mail repositories, etc. and in a variety offormats such as text, spreadsheet documents, images, voice, video, unstructured data,eXtensible Mark-up Language (XML) documents and more. Although ERP systemspromised that information would be held under one common repository, companiestoday still withhold many of their information assets within departmental systems thatwork independently from their central information systems (Ramakhrishman andGehrke, 2000).Also, most decision-makers do not want to be bothered with data unless there is anexceptional condition they need to examine businesses are required to make moredecisions, more frequently and more accurately in shorter time periods. The amount oftime between decision making and feedback (requiring a new decision) is becomingshorter and shorter. Thus, there is a need for real-time information visibility in order tosupport the ability to make intelligent business decisions quickly, which is imperative foran enterprise to remain competitive (Fitzgerald, 1991; Miller, 2001). Today many issuescomplicate the Information Technology (IT) challenge of real-time information visibility.Multiple diverse audiences want instant access to a personalised view of currentinformation. But this information likewise resides in multiple diverse places. In addition,presenting the required information in different ways and formats, with a uniquelypersonalised view, all in a constantly changing environment, adds to the complexity ofachieving real-time visibility. With the most up-to-date information available, manyemployees of today and not only line-level managers can get more detailed informationand on more devices establishing an ‘information democracy’ enterprise environment(Gartner Group, 2002; Gold-Bernstein, 2004; Sveiby, 1997).Finally, the new business environment demands an agreement on the meaning of dataamongst people whose perspective is skewed throughout the enterprise to suit theirindividual needs. This is semantic interoperability, which is the most difficult corner tounlock for most companies and organisations. When semantic interoperabilityinformation is organised under a common framework, systems and business users canrelate and organise business data under well-defined business processes and activitiesrelevant to the enterprise. Only with semantic interoperability can organisations integrateinformation and functionality from multiple sources (Gold-Bernstein, 2004; Kernochan,2003; Roth et al., 2003).3Problems with current BI approachesLine-level managers and information analysts continued to plan and analyse their ownareas of the business, in silos, with no connection to each other. They rely only on thehistorical reporting capabilities, while not giving full weight to the capabilities offered byoperational analysis to support demand forecasting, sales and operations planning and thecontinuous tracking of performance throughout the enterprise. Today, decision-makerswanted information in a more summarised fashion in order to perform strategic analysesfrom huge amounts of data that expanded in a wide time range and from multipleapplications.Consider for example the Supply Chain paradigm where there are many enterprisesoperating many software applications in heterogeneous platforms. Significant complexityexists since no system was originally designed to share information with other systems.
A conceptual framework for BI69Historically there has been no ubiquitous, common network platform over which toshare information until the emergence of the internet. Furthermore, many existingorganisations run legacy systems that are not designed with the thought of directlyconnecting to corresponding systems in other organisations.Based on the literature (Gunasekaran et al., 1999; Lau and Yen, 2001; Sakaguchi andFrolick, 1997; Widom, 1995; Wixom and Watson, 2001), there are some disadvantageswith the current BI approaches (mainly DW approach): The cost and complexity of establishing a DW environment is substantial.Deployment and management costs are very high and these environmentsrequire well-trained, dedicated staff. Because information is drawn from various repositories across the enterprise,there is a need to extract, transform and load the data into the central repository.This process takes time, so users will not receive the freshest, up-to-dateoperational data. Additionally, requests for additional information can takeweeks or months to complete. The tools used to analyse data residing are designed for the power user oranalyst. They are not well suited for end-users, managers or executives. Thus,these individuals must request the services of a developer or database analyst toacquire the reports they need. Again, this causes delay and users do not receivethe freshest operational data available. The DW approach implies that the data schema of the centralised database hasto be predefined. Any changes in the source database or changes in the userrequirements may require complex redesign procedures, the data uploadingprocedures and the related analysis modules. Another disadvantage is due to the database systems used. Currently, mostDW approaches use a relational database system to maintain data. However,data sources other than relational databases cannot be uploaded to therelational database system easily. For example data in company annual reports,documents, memos, policies and technical papers are important data sources butare in a non-relational table format. Therefore, it is very difficult to place suchinformation into a relational database system.To conclude, enterprises deploying DW trade-off data freshness and real-timeavailability for the ability to perform complex, multidimensional analysis on data pulledfrom across the organisation. In today’s demanding environment for most enterprises,this is not an acceptable trade (Mathie, 1998).4Conceptual framework for BI based on activities monitoring systemsAs described above the DW architecture is founded on the premise that all data requiredfor a particular end user inquiry or report should be brought together in a singleenvironment. This is done to provide stability, consistency of data and guaranteed accessto data. But how can the new requirements for lower data latency, access to remote datasources and incorporation of structured and unstructured data formats be supported? Theanswer is the adoption of decentralised architectural approach, which enables distributedqueries to take place. This distributed architectural approach provides the possibility ofmaintaining the logical appearance of a single DW (a semantic representation of thewarehouse), without the prior physical movement of all the data.
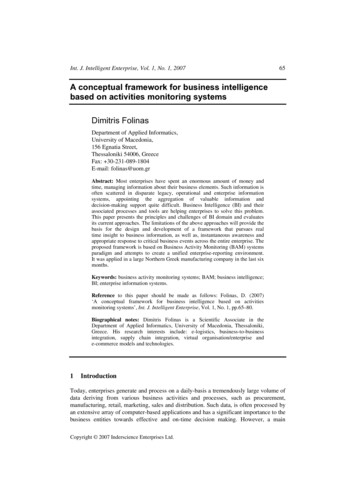
70D. FolinasBy using a metadata repository to describe the various associations amongstdistributed data repositories, users can submit queries or request reports that combinedata from both data warehouses and operational systems and view the information as if itresided in a single source. Mostly all users, can view real-time specific information(from operational systems) in combination with traditional, historical data alreadyresident in the DW. The proposed architecture is not an attempt to replace the existingapproaches (DW architecture and BPM approach). Rather, it should be seen as anextension, in order to promote an insight into real-time transactional data that resideswithin operational systems or to unstructured data formats that cannot easily beincorporated within a DW and presents only the required information at the right time.4.1 Characteristics of frameworkThe proposed framework attempts to create a unified event-handlingenterprise-reporting environment that has the following characteristics: information is gathered in real time from the native data sources without anyattempts to duplicate data in a secondary repository (such as DW approach) associations, transformations and metadata elements are implemented in realtime to further describe and enrich existing data in the underlying data sources both structured and unstructured are incorporated under a common frameworkwith reference data being established from one format to the other business requirements are easily represented within the architecture according tobusiness semantics, without technical interpretation and the heavy need ofIT to cope with the data sources vital information is monitored and real-time events and intelligence aredelivered directly in totally visual manner to decision-makers who need to takeaction only exceptional conditions are delivered to decision-makers, in order to befurther analysed and examined in detail.andThe suggested architecture consists of two main packages of layers: BI Systems layers,(which are Data, Metadata and Semantics layers) that aim to integrate information frommany sources and Business Activities Monitoring Systems layers (which are Rules,Events, Visualisation and Analysis layers), that aim to detect and analyse in real-timecritical business events (Figure 1).Figure 1A conceptual framework for business activities monitoring systems
A conceptual framework for BI714.2 BI systems layersThe BI systems consists of the following layers.4.2.1 Data layerThis compromises the native data sources where the data actually lies. The data layerconsists of data that resides inside relational data base systems (Oracle, AS/400, SQLServer) or in other semi-structured files such as excel documents, text documents, etc.Non-structured formats include various files whose content is not organised in anyformat, such as: customer contracts that are implied in word documents, image files,such as pictures, scanned documents, etc. and multimedia files. These documentsprovide a vital information source for companies and once tagged with theappropriate metadata elements, they can prove to be an important information source(Kernochan, 2003).4.2.2 Metadata layerThe metadata layer provides the actual mappings and relations in the underlying datasources between the semantic layer and the actual physical data. Mappings can be simplesuch as one to one representations of an entity element to a field element in a databasetable or can be more complex, such as various elements within a specific entity canbe mapped and transformed from disparate data sources (e.g. a customers orderentity may consist of a ‘CustomerID’ element that is mapped to a field element in aCRM application and also a ‘Totals Invoice’ element that is preserved within an ERPsystem). Associations amongst entities from the semantic layer allow the representationof relationships existing within elements. For example, customer sales orders arepreserved with an ERP application while production planning information needed tofulfil the production of customer sales orders is preserved within a customisedapplication that is home built to fulfil the company’s specific requirements. Individualsettings of association attributes allow the definition of complex rules associated with theactual representation of entities within the semantic model. Transformations are alsodefined within the metadata layer that applies specific business rules and policiesamongst entities and elements. For example, a CustomerID is preserved in both thecompany’s ERP and CRM system, each system though, holds a different ID for this dataelement. From the semantic perspective the enterprise only understands one version of acustomer, regardless of the actual physical representation of the data within two disparatesystems. Transformation classes allow the organisation to actually apply a single versionof a customer by defining the rules that exist to map and relate the CustomerID from onesystem to the CustomerID in a different system. Transformation can be simple as one toone (1-1), one-to-many representations or can imply conditional logic or mathematicaland statistical expressions according to specific business needs and the diversity of theunderlying data within the data sources.Business wrapper classes have a big effect on allowing unstructured forms of data tobe correlated with structured information (Gandon et al., 2000). The true value ofbusiness wrapper classes lies in its ability for a business analyst to define specificmetadata that apply to an unstructured form of business data, for example a worddocument or an e-mail message. Consider the case of a company’s customer contractsthat all reside in word documents and are organised in hierarchical folders within the
72D. Folinasoperating system. How can one manager simultaneously view the customers invoiceinformation (which is represented as structured data within an ERP system) with specificword documents scattered on physical disks? Naturally a physical word document lyingon a hard drive has a restrictive set of elements defined by the operating system (such asfile path, date modified, file size, etc.). These elements have no potential businessmeaning for the company, nor provide any information that this document is a customercontract. By defining a business class wrapper named ‘Contracts’ with a specific set ofelements (e.g. Date of Expiration, Contact Person, Contract Amount, etc.) and‘capturing’ the physical file within the business wrapper class, businesses can enrichunstructured information and provide associations with other structured forms ofinformation, that are presented to end users.The use of the metadata layer provides the actual framework that promotes truereal-time insight into business information because: information is manipulated from thenative data sources and not from copies of the data like the DW approach, all datasystems (structured, unstructured) once modelled can be consumed from end users andfinally, during information retrieval, inner workings of the metadata layer(transformations, associations, etc.) are transparent to the presentation layer accessing theinformation.4.2.3 Semantic layerThe purpose of the semantic layer is to abstract the information content into a businessmodel that is easily apprehended from a business perspective and that describes theenterprise information resources. The model captures the true business nature and aspectsof the information the enterprise has within its systems and the way the enterprise usesdata in its daily operations. This information is captured under an entity instance whichis a grouped set of various data elements and provides a common conceptualisation of abusiness domain as seen by the enterprise. Entities provide abstraction at a high level andcomprise of attributes and associations between them to form a business domainvocabulary with all entities connected in a semantic manner. Entities also encapsulatespecific metadata elements to provide a more useful meaning of content within existingdata assets. The data model contains standard constructs that show the businessentities and operations according to specific business practices. Once the semantic layercaptures the enterprise information resources into a model, then it can easily integratethis information with the assistance of the metadata layer.4.3 Business activities monitoring systems layersThis section presents the four-layers that comprise BAM systems.4.3.1 Rules layerThe rules layer allows business users to dynamically model complex analyticscenarios/business activities and track how they change their business state over time.Such models allow them to quickly perform real-time trend analysis on up-to-dateinformation. Furthermore, this layer monitors the operation of business activities bylooking for metrics or information that meets specific conditions. When a rule finds anexceptional condition in an activity, it triggers an event and sends the appropriatecontextual information to the upper event layer notifying them of the fact. Thus, the
A conceptual framework for BI73event layer ensures that critical issues are processed without delay. If an exceptionalcondition continues to exist after some time, the rules layer can then escalate the alert toanother set of users to ensure that critical problems are not ignored.4.3.2 Events layerThe event layer captures key events produced by the rules layer and collects contextualinformation that enhances these events. Then it presents the combined information inbusiness views to the visualisation layer and provides appropriate action to take,according to predefined rules or settings. An event is just a signal that the internal dataof a system has changed – a contact name has been updated, a new order has arrived, apending request has been cancelled. Most applications already generate events, if onlyfor their own internal use.Events can come from various sources, including enterprise applications, dataflowing over a messaging bus, database updates and messages from trading partners orweb services. The role of event layer is to capture the event that occurs in these sourcesand provide appropriate action to take according to predefined rules or settings(Mills, 2003). It adds a common middleware framework for detecting events,communicating them to an integration hub, converting them to a common format andlinking them to triggered actions in a modelled business process (Morgenthal, 2004). Thekey advantage of the events layer architecture is that it is integration-friendly andsupports loose coupling. One process component, say a packaged application, does notneed to issue an API call to another one in point-to-point fashion in order to integratewith it. It simply has to generate an event, which often requires no code at all. The rest ismodelled and managed within the BAM system. It does not matter if the componentsbeing integrated are on different system platforms or are written in incompatibleprogramming languages. In fact, the component generating the event (e.g. a Siebelapplication) does not even have to know anything about the component taking the action(e.g. an SAP application) or what the action is. It just has to generate the event.4.3.3 Visualisation layerOnce the events have been clarified and formed, information needs to be delivered to theappropriate person or system for review and action. The visualisation layer is simply avisual exception report. Visualisation involves multidelivery mechanisms such as alertsvia e-mail, dashboards, instant messaging, wireless devices, cellular phones, etc.Furthermore, it lets users place half-a-dozen metrics on the screen for easy viewing andsometimes reports or other documents. The metrics are represented as visual icons (suchas stoplights, gauges or thermometers), charts or tables and are updated as needed tomeet user requirements (e.g. minutes to hours to days). The metrics give users a quickoverview of the performance of the processes or people they manage.Moreover, the use of portal initiatives allows content to be delivered within apersonalised view often in the form of graphs, gauges or charts. This content in somecases can become interactive with the recipient and integrate with other BI or reportingtools to allow instant drill down or investigation into information. The purpose of thevisualisation layer is not to overwhelm users with a dizzying array of reports oranalytical options. It is to provide only the information users need and when they need it.Thus, it must keep things simple by highlighting anomalies that users need to investigateand providing additional information only as needed.
74D. Folinas4.3.4 Analysis layerOnce the events have been captured and presented in the visualisation layer, the next stepis to provide context to these events so that they can be analysed. For example, it may beneeded to add customer information to an event that represents order exception, sendinginformation about related orders of the same product, inventory levels, etc. Context maycome from historical or real time sources, so, there i
portal dashboards that display KPI's in near real-time combined with automated system monitoring tools that notify users, via e-mail for example, when a KPI's threshold has been violated. BAM lets companies visualise business events and KPI's in real time and in a format that's actionable (Ibarra, 2004).