Transcription
MITIP 2011, Norwegian University of Science and Technology, Trondheim, NorwayCONTROLLING IN-PLANT LOGISTICS BY DEPLOYING RFID SYSTEM IN THEITEM-LEVEL MANUFACTURING: A CASE STUDYArkan, IhsanVan Landeghem, HendrikDepartment of Industrial Management, Ghent UniversityTechnologiepark 903, B-9052, Ghent, BelgiumIhsan.arkan@ugent.beAbstract: RFID systems are being used in the industries to follow the manufacturingenvironment by tagging objects where keeping track has a value. The recent research aboutRFID systems mainly focused on monitoring assets to control shop floor operations in realtime. This case study has focused on deployment and improvement of an RFID system witha purpose of choose optimum system installation. The investigation of the production area,collecting item flow data and developing the relational database. The data that has beenattained from the system can be used to control internal plant logistics and provide support inorder to improve shop floor operations. This kind of RFID system used in industry can bevery useful in order to increase the speed of production and regulate the work flow.Keywords: RFID System, tracing/manufacturing, data capture/processINTRODUCTIONBefore RFID systems, parameters such as time and motion in the work flow of the productionlines were measured by using traditional tools such as stop watches or recorded videos fromthe shop floor operations. However recently used RFID systems have focused on automatedand improved control parameters by utilizing object tracking systems. These systems wereinitiated in industries such as Wal-Mart, Metro and Target, and have played a big role in thedevelopment of manufacturing applications in companies such as BMW, Caterpillar. Themain focus in these systems is attaching tags to small items or assets in the plants, and thishas led to a decrease in the management effort providing high quality services (Weinstein,2005). In the previous case studies RFID systems were considered for simple trackingpractices using tags for inventory monitoring, event management, airport traffic and carmanufacturing (Chao, et al.,2007). An RFID system that can control the high tag speeds inthe work flow has not been studied recently. This research lead to a robust RFID system thatcan control rapid production environment.Building real-time operations knowledge by obtaining continuous system efficiency is achallenging task. In manufacturing operations, from hardware to software, what kind of RFIDsystem to build efficiently is yet to be answered. We introduce an RFID system that canimprove the internal plant logistics by transferring the shop floor operational data that isreliable and purified from unnecessary information. Our aim is to transfer the condensed datain a relational database which will lead to faster data analysis and to better decision criteriafor continuous production optimization. To define necessary working zones in the system andto be able to control the input and output of data from the items, it is useful to provideknowledge about production steps during the manufacturing. Before installing the robustRFID system, we investigate the shop floor measurements, check the production platform.Accordingly with the system, we configure a database structure that provides data
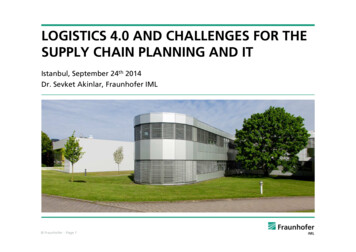
MITIP 2011, Norwegian University of Science and Technology, Trondheim, Norwayprocessing close to the source of RFID activity, in order to prevent high volume of wastedata.The paper starts with an introduction to the basic structure of RFID system. We thencontinue with a case study the description in detail by giving examples of the system as usedwith the data collected in the production area. We further discuss the impact of our researchand finalize by giving conclusion.LITERATURE STUDYTechnological BackgroundAn RFID system consists of readers and tags that can communicate by messages, send bythe tag’s transponder to the several readers in the work space boundary (Kou, et al., 2006).The RFID technology has been formerly discussed in supply chain applications, after WalMart prompted its suppliers to use RFID (Ngai, et al., 2008). In recent applications, RFIDmoved upstream to the manufacturing operations for synchronizing the plant floor with theRFID-enabled supply chain (Lu, et al., 2006). Hence the RFID technology that is mostlyused in supply chain need adaptation for the plant floor. The dense plant environment withthe dynamic production flow need accurate measures with high update rates. Many RFIDsystems are built on UHF, WLAN and Bluetooth solutions (Liu, et al., 2007). In our case,UWB (Ultra Wide Band) is used to track shop-floor operations which delivers enhancedRTLS performance in terms of location accuracy, throughput and environmental robustness(Metz and Gabriel, 2008), (Kelepouris and McFarlane, 2010).RFID tags are divided into three main categories: passive, semi passive and active. Thedifferences between these types are found in their frequency limits, ranges, memories andbattery specifications (Kou, et al., 2006). In our case we use active tags, as they constantlybroadcast strong signals and can communicate with readers on a long range across 20 to100 meters (Weinstein, 2005).Existing work and methodological backgroundRecently increasing RFID technology applications in manufacturing are focusing on assettracking in real time (Kelepouris and McFarlane, 2010 ), (Brusey and McFarlane,2009),(Huang, et al., 2007). We are interested in using trajectories to optimize asset flows. Somestudies in the optimization framework by using indoor positioning technologies are discussed(Zhang, et al., 2010). But they are lacking methods of handling data streams in practice.The articles about RFID data acquisition is profoundly based on generating time seriesposition data (Gonzales, et al., 2006), (Derakhshan, et al., 2007). We are leading to generatenode-arc data, using plant work-flow measurements (Zhang, et al., 2010). The data analysisis profoundly based on data cleansing method (Rao, et al., 2006), adjusting monitoringfrequency (Jeffery, et al., 2006) and event extraction (Khoussainova, et al., 2008).CASE STUDYIn this section we demonstrate a case study by introducing the working environment of acompany which manufactures components such as plastic bumpers and spoilers for theautomotive industry. This working environment relies on gaining continuous work-flowprocess efficiency, reducing costs, increasing production rate, and building knowledgethroughout quality control department. The aim of this study is to obtain these achievementsby tracing material flow throughout the process. In the following subsections, the content ofthe case study is provided step by step, as it appears in the flowchart (Figure 1).
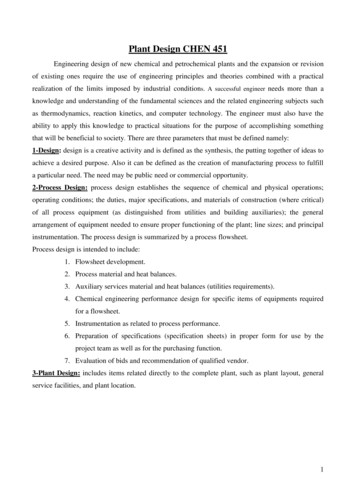
MITIP 2011, Norwegian University of Science and Technology, Trondheim, NorwayFigure 1: Flow chart of the case studyAim of the companyIn-plant logistics is regarded as the core differentiator of the company. The internal analysisof the flow of goods and sustain the validation of a new, efficient internal work flow model,can eliminate “non value added” costs throughout the in-plant logistics. The companyrecognizes that it is achievable to gain in-plant logistics knowledge and to re-design theinternal flow of goods by using RTLS technology (Real Time Location Systems).Shop-floor ProfileAfter items (bumpers and spoilers) are painted on the paint floor, than they are moved to theQuality Control Department where the quality of the items are controlled and final assemblyof the necessary items is done by eight operators. If an item is defect or scratch, it is movedaway with the other scratched items where they are placed in units that are randomlydistributed on the shop-floor. The items that have fulfilled all these steps are placed to theconveyors that move to the inventory. The detailed process layout is given in Figure 2. Thesteps are: Quality Control 1 (QC1): Conveyors which can also be named as skids containing theitems arrive to the shop-floor on a rail system. Items are removed separately by twooperators that work at the first quality control area. Each operator checks the qualityof an item either on a QC1 table or while walking to the next unit. If the quality of theitem fulfills the requirements, an operator places it on a moving rack (buffer). If theitem is defect, operator takes it to the unit where the scratched items are stored. Quality Control 2 (QC2): 6 operators are in charge of removing the items from theracks. For each item an operator does the second quality control on a QC2 table. If
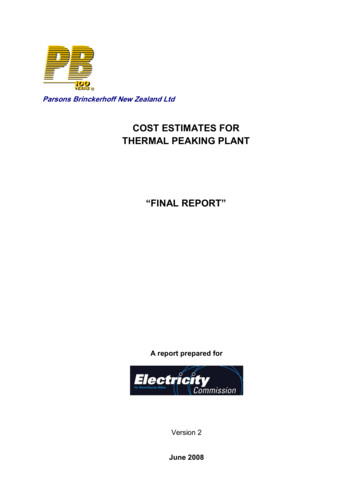
MITIP 2011, Norwegian University of Science and Technology, Trondheim, Norwaynecessary the same operator also assembles the bumper and its correspondingspoiler on a fixture. Then the operator places the item on a warehouse conveyor(input). If an item is defect, the operator moves it to the scratched items unit.In the working area of the operators, the distance between two closest working units is 30cm, the average distance between the working units is 1 m, and the total size of theproduction area is 375 m2. In spite of this constricted working area, the operators work fastcarrying the items, with 1 m/sec average motion speed and with 2 m/sec peek speed, to beable to finish the daily production on time. The items are 1.5 m long in average.The work-flow order of the department follows random paths as shown in Figure 3. QC1operators choose idle tables to control the items or idle racks to place the items in short time.The principle is to take the item from the rack and move it the closest and available table orfixture to operate. At the end of the process, input is selected randomly according toavailable empty space. In total the average process time of an item is 9 minutes and themaximum number of work-in process is 52.Figure 2: Quality Control Department’s Layout with unit identification and the material flow
MITIP 2011, Norwegian University of Science and Technology, Trondheim, NorwayFigure 3: Work-flow order of the departmentChoosing technology and supplierAccording to the shop-floor profile, in order to gain material flow visibility and obtain optimaltechnology there are some basic parameters. They are listed as: Continuous multi-item process tracking Fast moving production environment Location accuracy in centimeters Constant data gatheringThe basic qualifications that are expected from the supplier are: Experience in manufacturing Precise Real-Time Location Systems , indoor positioning Monitoring work-in progressCombining technology and shop-floor informationThe RTLS system solution is provided by the supplier and an RFID system is chosen forimplementation. The basic selection criteria of the technology are provided by the supplier,as shown in Table 1.SHOP-FLOOR MEASUREMENTSTECHNOLOGYLocation accuracy in centimeters ( 30 cm)Area ( 375 meters2)9 RFID readers layout2 Dimensional shop floor layoutMetallic environment layoutContinuous and rapid multi-item material flowConstant data acquisitionUWB (Ultra Wide Band) radio signalingActive tagsTable 1: Basic selection criteria of the RTLS solution
MITIP 2011, Norwegian University of Science and Technology, Trondheim, NorwayRFID system installation and basic location testRFID system is provided to the shop-floor by integrating the selected technology (Table 1)components to the network infrastructure. The hardware components contain 9 RFIDreaders, 52 active recycling tags to be used in order to obtain maximum work-in process, anda data server. The software includes tag monitoring and location engine configuration. Afterthis system is fully deployed, a location test is applied by the system supplier. Several tagsare moved by workers around the department. The supplier monitors and evaluates thefunctionality of the system. The layout of the RFID readers and the data server are shown inFigure 4.Figure 4: RFID readers and data server layoutTest data generationThis section of the study describes how the RFID database is generated. There are twoparameters that are building the database. One is the data acquisition frequency which isforming rows and the other one is the data structure which is forming columns.The data acquisition frequency that indicates the system filtering option, is configured in theLocation Engine Configuration and is calculated based on the items’ motion. This filteringoption prevents the flood of data and saves battery life. The formula for each tag or item isshown as:(1)There is also a tag automatic sleep feature which effects data acquisition frequency. When atag stops to move, after a time, it passes into a sleeping mode and stops to generate datauntil it exceeds a motional threshold and start moving again. The sleep state feature isadjusted to 4 seconds according to the minimum on-rack waiting time.
MITIP 2011, Norwegian University of Science and Technology, Trondheim, NorwayData structure is defined by a tag’s memory. When the tag sends a signal, its memory isrecorded as a row in the database and data structure is determined by the columns in thisdatabase. The test data structure is formatted considering the further data processing for thesystem validation. The data columns’ selection criteria for the further RFID system validationare shown in Table 2.Data validation parametersData columnsItem IdentificationTag IdentityCompatibility of speed and accelerationtestTime, X coordinate, Y coordinateLocation accuracyBattery level inspectionBattery LevelTuple(TagID, Time, X ,Y, BatteryLevel)Table 2: Tuple selection criteriaValidating RFID system from dataIn this section, the RFID system is controlled by its achievements in data acquisition anddata quality. The results, for system validation, are given at the end of the section.In order to validate the RFID system, first step is collecting the data from the productionprocess and verify if it is successfully transferred to the database. In this case, the data iscollected from the 3.5 hours of continuous production process. 272 items which move onrails, are tagged and followed starting at the entrance of the department until the end of eachitem’s process.The second step is inspecting the data quality. The methods that are used are indicatedrespectively:Battery level inspection: Battery level value is in between 0 and 2.8. Low battery level(BatteryLevel 1) rows are counted in MS Excel Macro as:(2)Location accuracy control: This is done for checking the location accuracy while the tagsstand still. If a tag is in the system and it is in the sleeping state, the combination of thedistances between a group (4 points’ location before the sleeping state) are calculated. Allpopulation is compared to the 30 centimeter distance accuracy limit. The average distanceaccuracy is calculated and the distances exceeding the limit are indicated.(3)(4)(5)(6)(7)(8)(9)
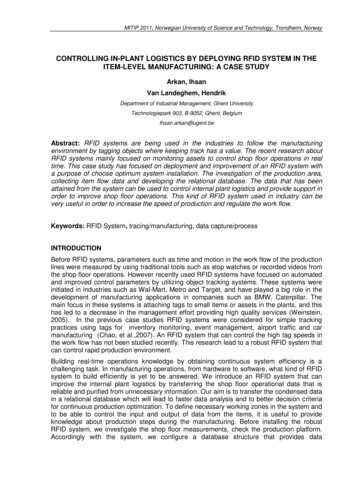
MITIP 2011, Norwegian University of Science and Technology, Trondheim, NorwaySpeed control: This is for checking the precision of the location while the tags are in motion.Tag speeds are calculated for the two consecutive points.(10)( “2” is the peek item speed)(11)Acceleration control: This is for checking if the system can detect high speed orders at theright time. Tag accelerations are calculated for two consecutive speeds.(12)(13)The RFID data control results are: The complete data is collected and successfully transferred to the database Low battery level is 0%. 100% validity is acquired from battery level inspection. Average distance (davg) is calculated as 0.2 m which validates location accuracy. Thedistances that are exceeding the limit (dex) are 3% which is negligible for further dataanalysis. Only 0.012% of the speeds and 0.011% of the accelerations exceed the limit whichare negligible for further data analysis.The RFID system is reliable according to the data control results. There are still manychallenges foreseen in order to achieve the real time aspect of the system by using the data.These challenges are stated in the next section.Problem StatementGenerating continuous location data in the multi-item production process, results in highamount of data collected with high data redundancy. Also the volume and velocity of RFIDdata can exceed the capacity of existing technology infrastructure. Data process times areproportionally effected with this database expansion. Long process times will lower the realtime aspect of an RFID system.Improving RFID systemAn approach: Designing zones in the softwareArc-node topology is useful to support the analysis functions. Its value as a network tracingcan find applications in production platforms, using RFID system software. The software inthis case, is flexible to design a node-arc topology and to utilize it for data generating. Nodesrepresent work benches in the shop floor, and arcs can be defined as trips between theitems. In the constricted production platform, trips between the benches can be recognizedas straight lines preventing the difficulty of accurate distance calculations.In the plant layout, nodes can be shaped differently and defined as special zones. The shapecan change for each work bench, depending on the area that covers the movement of theoperator carrying the item. The data to be configured can be composed of just zone-in andzone-out values of the tags. With this kind of data streaming the manner of data collectingcan be changed and the database size can be reduced dramatically. The design of the workzones is shown in Figure 4.The zone data is compared to the location data by generating another data stream. The datais acquired from 3 hours of production process. 218 items are tagged and tracked. Theresults are shown in Table 3.
MITIP 2011, Norwegian University of Science and Technology, Trondheim, NorwayParameterDatabase SizeRow CountTime and location matchLocation DataZone Data73 MB1 MB610,14314,70898%Table 3: Comparison of location and zone dataFigure 4: Work areas designed as zones in RFID softwareCONCLUSIONSThis study introduced the designing of an RFID object tracking system based on themeasurement parameters in the multi-item work flow. It considered the integration of RFIDsystem, evaluated the operating performance by the generated data and configured therelational database. Providing an ability of continuous manufacturing refinements in the workflow of the assembly items which will lead to an increase in the production rate, this kind ofsystem can be considered as a successful step for the future works in the manufacturingenvironment.REFERENCESBrusey, J., McFarlane, D.C., 2009. Effective RFID-based object tracking for manufacturing.International Journal of Computer Integrated Manufacturing, 22(7), pp.638-647.Chao, C.C., Yang, J.M.,Jen W.Y.,2007. Determining technology trends and forecasts ofRFID by a historical review and bibliometric analysis from 1991 to 2005. Technovation, 27(5), pp.268-279.
MITIP 2011, Norwegian University of Science and Technology, Trondheim, NorwayDerakhshan, R., Orlowska, M., Li, X., 2007. RFID Data Management: Challenges andOpportunities. In: IEEE, International Conference on RFID. Grapevine, TX 26-28 March2007.Gonzales, H., Han, J., Li, X.,2006. Mining compressed commodity workflows from massiveRFID data sets. CIKM Proceedings of the 15th ACM international conference of Informationand Knowledge Management. Arlington, Virginia, USA 2006. New York:ACM.Huang, G.Q., Zhang, Y.F., Jiang, P.Y.,2007. RFID-based wireless manufacturing for walkingworker assembly shops with fixed-position layouts. International Journal of Robotics andComputer Integrated Manufacturing, 23(4), pp.469-77.Jeffery, S.R., Garofalakis, M., Franklin, M.J.,2006. Adaptive cleaning for RFID data streams.In Proceedings of the 32nd International Conference on Very Large Data Bases (VLDB).Seoul, Republic of Korea 2006. VLDB Endowment.Kelepouris, T., McFarlane, D.,2010. Determining the value of asset location informationsystems in a manufacturing environment. International Journal of Production Economics,126(2), pp.324-334.Khoussainova, N., Balazinska, M., Suciu, D.,2008. Probabilistic Event Extraction from RFIDData. In: IEEE, 24th International Conference on Data Engineering. Washington:IEEEComputer Society.Kou D., Zhao K., Tao Y. and Kou W., 2006. Enabling Technologies for Wireless E- Business,RFID Technologies and Applications. Berlin Heidelberg: Springer.Liu, H., Darabi, H., Banerjee, P., Liu, J.,2007. Survey of wireless indoor positioningtechniques and systems, IEEE Transactions on Systems, Man, and Cybernetics Part C:Applications and Reviews, 37(6), pp.1067-1080.Lu, B.H., Bateman, R.J., Cheng, K.,2006. RFID enabled manufacturing: Fundamentals,methodology and applications, International Journal of Agile Systems and Management,1(1), pp.73-92.Metz, G. and Gabriel, P.,2008. The RFID Roadmap: The Next Steps For Europe. BerlinHeidelberg: Springer.Ngai, E.W.T., Moon, K.K.L., Riggins, F.J., Yi, C.Y.,2008. RFID research: an academicliterature review (1995–2005) and future research directions, Elsevier International Journal ofProduction Economics, 112(2), pp.510-520.Rao, J., Doraiswamy, S., Thakkar, H., Colby, L. S.,2006. A deferred cleansing method forRFID data analytics. In Proceedings of the 32nd International Conference on Very LargeData Bases (VLDB). Seoul, Republic of Korea 2006. VLDB Endowment.Weinstein, R.,2005. RFID: A technical overview and its application to the enterprise, ITProfessional, 7(3), pp.27-33.Zhang, Y.F., Huang, G.Q., Qu, T., Ho, K.,2010. Agent-based workflow management forRFID- enabled real-time reconfigurable manufacturing, International Journal of ComputerIntegrated Manufacturing, 23(2), pp.101-112.
The RFID technology has been formerly discussed in supply chain applications, after Wal-Mart prompted its suppliers to use RFID (Ngai, et al., 2008). In recent applications, RFID moved upstream to the manufacturing operations for synchronizing the plant floor with the RFID-enabled supply chain (Lu, et al., 2006).