Transcription
Sharing the Sun: Community SolarDeployment, Subscription Savings, andEnergy Burden ReductionNicole Steele, DOEJenny Heeter and Kaifeng Xu, NRELGabriel Chan, University of MinnesotaWebinar PresentationOctober 26, 2021
SpeakersNicole SteeleJenny HeeterKaifeng XuGabriel ChanSenior AdvisorDepartment of EnergySenior Energy Analyst –Market and Policy AnalysisNRELResearcher – Marketand Policy AnalysisNRELAssociate ProfessorUniversity ofMinnesotaNREL 2
Contents1.2.3.4.National Community Solar PartnershipCommunity Solar Market StatusEquitable Community SolarThe Subscriber Value PropositionNREL 3
National Community Solar PartnershipNATIONAL COMMUNITY SOLAR PARTNERSHIP U.S. DEPARTMENT OF ENERGY4
National Community Solar PartnershipNetworkPartners can access an online community platform,virtual/in-person meetings, webinars and other tools toengage with DOE, National Labs, and each other.CollaborationStructured groups of partners form around specific topicareas and/or sectors to address common barriers and goalsby learning from each other and sharing resourcessupported by DOE, and National Labs, and other externalpartners.Technical AssistancePartners have access to resources and direct technicalassistance from DOE, National Labs, and third-partysubject-matter experts to support local challenges.NATIONAL COMMUNITY SOLAR PARTNERSHIP U.S. DEPARTMENT OF ENERGYA coalition of stakeholders thatare working to enablecommunity solar to power theequivalent of five millionhouseholds by 2025, creating 1billion in energy billsavings realize other benefits,such as increased resiliency andworkforce development.55
New National Community Solar PartnershipTarget Metrics Community solar currentlyserves 600,000households (3 GW) New target metricrepresents a 700%increase by 2025 (20 GW) Savings reflective of 20%bill reductionNATIONAL COMMUNITY SOLAR PARTNERSHIP U.S. DEPARTMENT OF ENERGY5 MILLIONHOUSEHOLDS 1B INSAVINGS6
NCSP Pathway to SuccessNCSPTARGETMETRICSCredit ReadySolarLow-IncomeCustomerAcquisition &ManagementHearts ATIONAL COMMUNITY SOLAR PARTNERSHIP U.S. DEPARTMENT OF ENERGY7
Market StatusThis section summarizes data oncommunity solar deployment over time,by state, and by project characteristics.
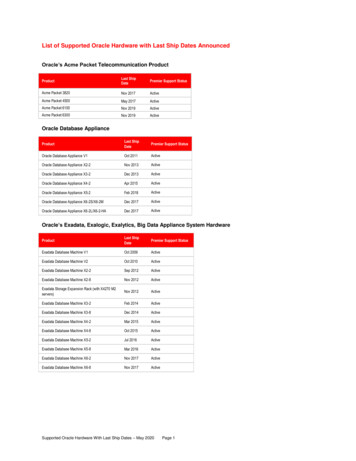
Community Solar Capacity by StateBy the end of 2020,we estimate thatthere were at least3,253 MW-AC ofcommunity solarcapacity distributedacross 1,600projects in 39 statesand Washington,D.C.Community solar projects in the Contiguous United StatesData Source: Sharing the Sun Project List 2020NREL 9
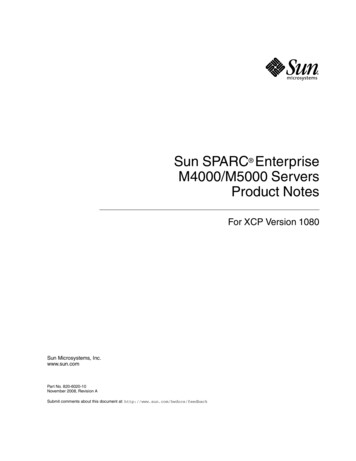
The Rapid Growth of Community Solar Cumulative community solarcapacity has grown by about 121%year over year since 2010, in otherwords, capacity has more thandoubled on average year over year About 1,107 MW came online in2020 alone.Community solar capacity (MWac) by yearNREL 10
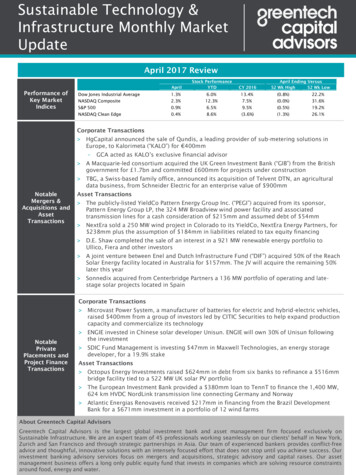
More and Larger ProjectsCommunity solar capacity has increased both because more projects have come onlineand because projects have generally become larger over time.Florida and Arizona built large size (over 50 MWac) community solar projects in 2020Boxplot shows the 25%, 50%, and75% quantiles of nationalcommunity solar project capacityby yearLower and upper edge of notchesrepresent 95% confidenceintervalLarge projects in states such asFL and AL are outliers and notincluded in this plot# of Projects by YearDistributions of Project Capacity by YearNREL 11
Community Solar Capacity has beenInstalled in Waves in Different Key Markets Colorado was the early state leader,with significant capacity expansionsfrom 2011 to 2015.Massachusetts and Minnesotaexpanded capacity significantly in2016-2019.Leading states are changingdynamically. Florida and New Yorkhave emerged as key markets in recentyears.New community solar capacity(MWac) by year and stateNREL 12
Most capacity (64%) and projects(76%) are developed and operated bythird partiesTotal Capacity MWacProject tically Integrated47Vertically IntegratedG&T/JAA58G&T/JAA189Muni/co-op Distribution149Muni/co-op Distribution2291213Third Party0200400600800 1000 1200 1400744Third Party205105001000150020002500NREL 13
Community Solar State Policies (1/2) 21 states and Washington, DC havepassed some form of legislationenabling community solar, eitherthrough state-required programs orthe authorization of a limited numberof pilot projects.These programs vary in scope, butthey generally all allow for some formof virtual metering that enablessubscribers to benefit from theircommunity solar subscriptionsState-level community solar enabling legislation** Legislation applies to at least one utility in the stateNREL 14
Community Solar State Policies (2/2) Some states currently have limited policyactivities regarding community solar.2500 FL, AR, GA, and TX have voluntarycommunity solar programs thatcontribute to 80% community solardeployed in states without legislation.Voluntary community solar projects havegrown significantly in recent years. Forexample, FL has deployed 560 MWacprojects since 2018MWac2000150010005000State: Voluntary ParticipateState: Enabling LegislationCumulative Installed Capacity by State with/withoutEnabling Legislation** Legislation applies to at least one utility in the stateNREL 15
Community Solar Capacity in Queue Top StatesCommunity Solar Capacity in Queue – Key StatesSolar DC outputcapacity has beenconverted to ACrated output basedon 1.3 DC/AC ratioOperational data come from the NREL Sharing the Sun Project List 2020. CO: Planned solar capacities include projects under Xcel program; FL:Planned capacities include FPL and Duke Energy Program; MA: Planned capacities include SREC II (converted to AC) and SMART program; MN:Planned capacities only include projects under Xcel program; NJ: Planned capacities include Phase 1 and Phase 2 Community Solar PilotProgram; IL: Planned capacities include Adjustable Block Program only; HI*: Planned capacities include Hawaiian Electric Community basedrenewable energy program, assumed AC capacity. MD: Planned capacities include MD Community solar pilot program. OR: Planned capacitiesinclude Oregon community solar program. The solid blue represents the cumulative rated AC power output (MW) for community solar inoperation by corresponding year in corresponding state. The semi-transparent blue represent capacity planned As of 2020, five states (CO, MA, MN FL,NY) have driven the majority ofcommunity solar installed in queue. Over 4,700 MWac in queue MD, OR, NH, IL, HI are implementingstate-level community solar programs. Over 1,000 MWac in queue “Planned” indicates community solarprojects in queue and will be installedthereafterNREL 16
Equitable Community SolarThis section discusses how variouspolicy and market factors have shapeddeployment of programs serving lowand moderate-income households.
Community Solar: Good Practices for EquitableSolar Access Many community solar customerssubscribe on a monthly basis ratherthan one-time upfront payments.Community solar can expandconsumer adoption of solar energy We identified four generalapproaches to encourage equitablecommunity solar development: (1)policy mandates, (2) financialincentives, (3) equity requirements,and (4) voluntary utility-ledprogramsNote: states with multiple colors means that they have offeredmultiple approachesSee more via: https://www.nrel.gov/docs/fy21osti/79548.pdf NREL 18
LMI Solar Access: Potential Capacity At least 26 MWac community solardedicated to LMI participants has beeninstalled, with 211 MWac pending across10 U.S. states by the end of 2020.90Installed LMI capacity refers tocommunity solar capacity serving LMIhouseholds. Pending LMI defines projectsthat have received awards or are underconstruction.50 Projects waitlisted, under review, or meetingrequirements but not yet awarded are notincluded in this category.807060MWac 6Installed081065070InstalledPendingSee details in: https://www.nrel.gov/docs/fy21osti/79548.pdfNREL 19
The Subscriber ValuePropositionAnalysis of Subscription Contract Value:Estimated subscriber value shows thatmost subscribers now save money withcommunity solar
Net Present Value CalculationMethodology Residential subscriber contract data are currently matched individually to403 projects; 1,037 additional projects are in programs modeled withrepresentative contracts offered in that program For each available contract, we built a cash flow model to calculate the netpresent value (NPV) of the contract. We needed to make assumptions inorder to determine the financial value of a subscription contract, including:- Annual utility rate escalation: low scenario 1.5%, central scenario 2.5%,high scenario 3.5%- Annual solar facility degradation factor: low scenario 0.75%, centralscenario 0.5%, high scenario 0.30%- Discount rate: low scenario 8.4%, central scenario 6.4%, high scenario4.4%NREL 21
Assumptions used in NPV CalculationMethodology Additional assumptions included:- Standard contract assumptions: We used standard contract term assumptionswhere the contracts did not specify or were flexible within a wide range.- Retail rates: We used retail rates from the Utility Rate Database and the EnergyInformation Administration.- PV production: We calculated PV production using the System Advisor Model.For projects above 1 MW we assumed 1-axis tracking and for those below 1MW we assumed fixed tilt. This methodology is sensitive to future retail rate changes, solar production, andeconomic variables. We performed sensitivities around these factors, which arepresented in the following slides.NREL 22
NPVs study covered over 70% projectsthrough most years, 81% overall Three reasons for missing NPV data: 1) complicated contract, 2) missing contract dataand 3) missing retail ratesNPV 1420144334201520%142 1202016Total Capacity60%50%71560090%10%2017Capacity w/ NPV2018Coverage Percent201920200%NREL 23
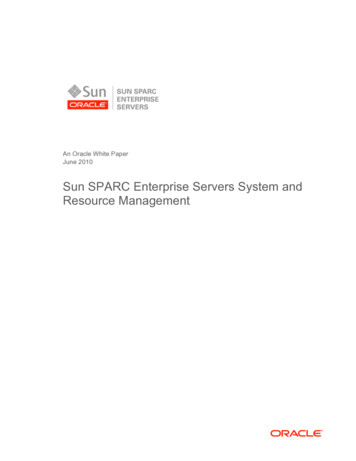
NPVs are Increasing Over TimeNet Present Value ( /W) The median NPV of subscriptionshas been positive since 2016,when state-legislated programsbegan to rapidly expand210.150Virtual metering for programs inCO, MN, MA, and NY after 2017also increase the overall NPVs-20.260.260.19-0.94-1 1Error bars show p10 and p90. Light blue bars show high and lowsensitivities to rate escalation, inflation, and discount ratesNREL 24
Example: Net Present Value of CommunitySolar in Massachusetts The average community shared solar subscription inMassachusetts has a net present value (NPV) of 0.15/W.Translated to an annuity equivalent, the averagesubscription yields a benefit of 14/kw·yr.To cover 100% of average electric load, the averagecommunity solar subscription reduced energy burden by 0.5pp for the lowest income bracket.Energy burden is defined as the percentage of grosshousehold income spent on energy costs, inclusive ofelectricity, natural gas, and delivered fuels and exclusiveof transportationIncluding the MA 0.06/kWh low-income adder to theaverage subscription, community solar reduces energyburden for the lowest income bracket by 3.2 pp.Additional data sources: DOE LEAD tool, EIA-861. Energy burden isshown for the first-year of a subscription with community solarbenefits shown as an annuity equivalent with a 7% discount rate.The MA low-income adder is available to projects with 50% ofofftake to subscribers below 65% state median income.NREL 25Pp: percentage point
Resources Join the National Community Solar community-solar View published slides on market f Download a list of community solar projects:https://data.nrel.gov/submissions/167 View equitable community solar data and .pdf Read other community solar al/community-solar.htmlNREL 26
Q&Awww.nrel.gov
The average community shared solar subscription in Massachusetts has a net present value (NPV) of 0.15/W. Translated to an annuity equivalent, the average subscription yields a benefit of 14/kw·yr. To cover 100% of average electric load, the average community solar subscription reduced energy burden by