Transcription
REFRIGERATION CYCLESCarnot CycleWe start discussing the well-known Carnot cycle in its refrigeration mode.Figure 2-1: Carnot CycleIn this cycle we define the coefficient of performance as follows:COP qLTL w TH TL(2-1)Which comes from the fact that w qH qL (first law) and qL TL s , qH TH s (secondlaw). Note that w is also given by the area of the rectangle.Temperature differences make the COP vary. For example, the next figure shows how COPvaries with TL (TH is ambient in this case) and the temperature difference in exchangers.56
Figure 2-2: COP changes with heat exchanger temperature approximation and TL(TH ambient)We now turn our attention to a real one stage refrigeration cycle, depicted in the next figure.Figure 2-3: Typical one-stage dry refrigeration CycleWe notice that:-To be able to achieve the best match possible with the rectangular shape it isnecessary to operate inside the two phase region.Compression is in this example performed outside the two phase region. Creating a“horn”, which is not thermodynamically advisable, is mechanically better. For thisreason, this cycle is called “dry” cycle. A “wet” cycle is shown in the next figure.57
Figure 2-4: Wet refrigeration Cycle-The expander has been substituted by a throttling valve. If an expander had beenused the line from d to a would be a vertical line. This is also done for mechanicalreasons.The refrigeration cycles can also be represented in a P-H diagram.Figure 2-5: P-H diagram representation of a dry refrigeration cycle58
Exercise 2-1:Consider the real cycle taking place outside the two phase region using a compressor and anexpander. This is called, the Bryton Cycle.Prove that this cycle is less efficient than the Carnot cycle. To do this assume constant CpExercise 2-2:Consider the real dry refrigeration cycle. Prove that the area of inside the cycle plus the shadedarea (called throttling loss) is equal to the total work.Show also that this is less efficient than the pure Carnot cycle.Refrigerant fluid choice: We now turn our attention to the fluids. Usually, one tends to pick pLas low as possible, but not below atmospheric pressure. Thus, the refrigerant chosen needs tohave a normal boiling point compatible with the lowest temperature of the cycle (usually 10oClower than the system one wants to cool). The higher pressure needs to be compatible with thecooling media used for qH. If this is cooling water, then the TH needs to be around 10oC higherthan the available cooling water temperature. The next table shows the existing refrigerants. Itis followed by the boiling temperature and rang of selected refrigerants.59
Table 2-1: Refrigerants60
Table 2-1: Refrigerants Continued)61
Table 2-1: Refrigerants Continued)62
Figure 2-6: Temperature Ranges of RefrigerantsWe now turn to Pro II to show how a refrigerant cycle is built.We start with entering the cycle as follows:63
We pick R12, which will allow us to cool down anything toNext we define the outlet pressure of the compressor. This needs to be such that stream C (afterthe cooler) is higher than 60 oF. To start we choose around 85 psia.Next we define the top heat exchanger, by specifying an outlet temperature slightly below thebubble point.64
We continue by specifying the duty of the bottom exchanger. This is customary because this isthe targeted design goal of the cycle.65
We enter the outlet pressure of the valve (atmospheric).66
We also realize that this flowsheet does not have input or output streams. Thus, to start thesimulation, one needs to give an initial value to a stream. We chose stream D, and initializewith a flowrate that is guessed.67
If the flowrate chosen is too high, then the inlet of the compressor will be two phase and this isnot advisable. If the flowrate is too low, the cycle will loose efficiency (the “horn” will getlarger).Warning: Pro II may not realize internally that it needs to solve the unit that the initializedstream feeds to and try to continue until it reaches convergence in the loop but it will loose theinput data. To avoid problems we specify the order in which we want the flowsheet to solve byclicking in the unit sequence button.68
Exercise 2-3:Construct the simulation above described and determine the right flowrate in the cycle.Determine all temperatures and obtain the COP. Compare it with a Carnot Cycle.The above exercise can be done automatically using a “controller”, which is a type of “specand vary” equivalent to “Goal Seek” in Excel. Once the controller is picked, double clicking onit reveals the menu.69
Thus, we choose to have the inlet to the compressor just slightly above dew point(specification) and we vary the flowrate, just as we did by hand. It is, however, easier tospecify a very low liquid fraction. Make sure the starting point is close to the right value.Sometimes the controller has a hard time converging.70
We now turn our attention to a variant where liquid is being sub-cooled:Figure 2-7: Liquid sub-cooling in a refrigeration cycle.71
The corresponding TS and P-H diagrams are shown in the next figure. Since we are using thevapor (at the lower pressure) to sub-cool, there is a gain in qL at the expense of a slight increasein work. Whether there is a gain, it depends on the fluid and the sub-cooled temperature choice.Figure 2-8: TS and P-H diagram for liquid sub-cooling in a refrigeration cycle.Exercise 2-4:Implement the sub-cooling cycle in Pro II and report the new COP. Compare it with the drycycle without sub-cooling and the Carnot cycle. Use streams E and F as initial values. Theflowsheet has two loops. Once you change the flowrate in BOTH streams, reinitialize theflowsheet (Pro II is a little tricky when recycles are present). Set the sub-cooling to 5oF. Alsomake sure the sequence is correct. Finally, do not attempt to use a controller here. It will notwork.72
- Can one make pints b and e coincide, i.e. use the cycle without compressing superheatedvapor?- Compare COP for different sub-coolings and flowrates. What about capital costs?The instructor will also show you another way of implementing this simulation and having onlyone initial stream.73
One cannot put a controller here either. The goal now is to determine sub-cooling ANDflowrate such that the COP is the largest possible.Other systems have been proposed, like the sub-cooler and desuperheater combination74
Figure 2-9: One Stage subcooler-desuperheater refrigeration cycle.Consider now a multistage situation in which two cycles are combined. One reason thatmultistage cycles are used is because one cycle may require more than one compressor as thecompression ratio for one may get to be too high. Instead of putting compressors in series, onecould split the work among two compressors and actually increase the COP.Figure 2-10: Two Stage refrigeration cycle.75
Exercise 2-5:Show, using a T-S diagram why the multistage arrangement increases the COP.Exercise 2-6:Pick an intermediate temperature for the cycle of Exercise 2-3 and build a two stage system.Compare COP.Other systems have been proposed, like the open flash cooler. This actually requires one fluid,but eliminates the need for the upper cycle to have a lower temperature for proper heatexchange, thus reducing work. Besides, a flash tank is cheaper than a heat exchanger.Figure 2-11: Open flash two stage refrigeration cycle.76
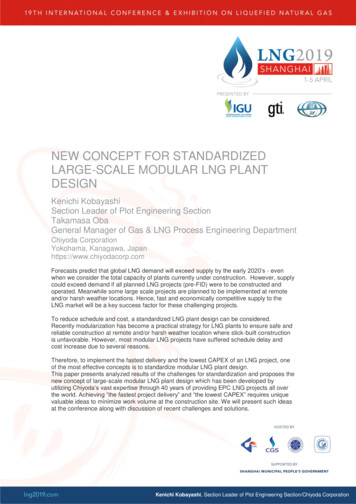
LNG PRODUCTIONBefore natural gas can be liquefied, it must be treated. Treatment involves the removal of CO2,condensate, organic sulfur compounds, and Hg. This is done to avoid blockage in theliquefaction process, prevent damage done to the equipments, and to meet the heat contentstandard of the natural gas which differs from country to the other. The pretreatment processconsists of four main stages. First, CO2 and H2S removal stage which is constructed to assurethat CO2 would not exceed 50 ppm in the natural gas feed. If the composition of CO2 exceededthat limit it would freeze in the liquefaction process pipelines.There are two available methods to remove CO2 from the natural gas. The first method is usingsulfinol, which used to be one of the famous methods for gas CO2 removal in most industrialapplications but it started to vanish and few pretreatment plants use sulfinol any more. Thereason is that sulfinol does not work well with rich natural gas (rich with heavy hydrocarbons)because it tends to attract or attach to heavy hydrocarbons and then it drags the heavies to thesulfinol pump or circulation which leads to allowing the heavy hydrocarbons to vent into theair. That usually leads to a decrease in the quality and heat content of the natural gas in the feedand according to the new EPA (Environmental Protection Agency) rules heavy hydrocarbonscan not be vented to the atmosphere because it would lead to an increase in the air pollution.CO2 dissolves in water as any gas, but it further reacts to for carbonic acid:At high PH (above 10), the following chemistry takes place:But the amount dissolved is not large enough. Therefore another method to remove CO2 isusing Amines. The chemistry of this process is:Since DEA alone cannot remove CO2 to a ppm level, it is activated by injecting a chemicalcalled Piperazine which activates the DEA to MDEA (Methyl Diethyl Amine).Figure 2-12: PiperazineMDEA is also used for this pretreatment stage versus sulfinol because the MDEA process ischeaper to install and it has less utility since it requires less rate of solvent circulation comparedto sulfinol.77
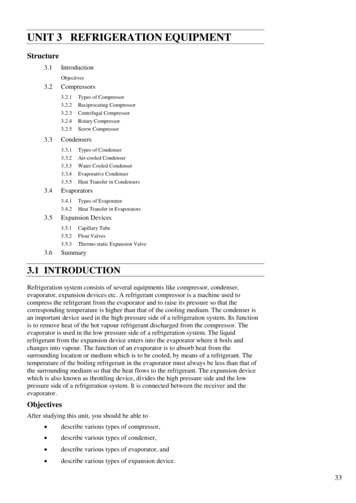
The second stage is dehydration. Water is removed from the natural gas also to avoid freezingin the pipeline of the liquefaction process. The natural gas feed should be completely dry, evenfrom the smallest traces of water molecules ( 0.01Microgram/m3), before entering the heavyduty cooling section of the liquefaction process. TEG (Triethylene Glycol) is the primarysolvent used in gas processing industry to dehydrate gases. Dry TEG contacts the moist naturalgas and absorbs the water from it in a contactor tower. The tower contains a structured packingbed to maximize the mixing between the gas and TEG and to increase the contact time betweenthe two substances. The TEG and water mixture is then sent to a TEG recycling system whereTEG is separated from water by filtering then heating. The recycled TEG is then sent back tothe contactor tower. Although TEG removes H2O significantly from the natural gas, smallamount of water traces still escape this process; so to insure that these traces do not accompanythe natural gas feed, molecular sieves are used to serve this purpose. In average, two sieves areneeded for every train. Despite all of this, in some processes H2O in a molecular level stillescapes with the natural gas in the feed. A third safety step is taken in the liquefaction processwhere molecules of water, which accompany the natural gas in the feed, are condensed andflashed in the stage of natural gas pre-cooling.The third stage is the Hg removal. Hg causes corrosion in the expensive Aluminum LNG heatexchangers used in the liquefaction process. For example, 10 ng/m3 (nano gram per m3) areenough to cause a catastrophe. The activated bed filter that is used in the Hg filtration isinexpensive and it is replaced on an average of once every four years.The fourth and last step is the installation of a Duster in the Pretreatment process outlet toinsure that the natural gas feed is free from small solid particles which might cause a clog in thepipes of the liquefaction process or damage the heat exchangers. The figure below shows theoverall process flow.Figure 2-13: Pretreatment schematicsAfter the natural gas has been pretreated and contaminants are removed, it is sent to aliquefaction process where the natural gas is pre-cooled and water traces and heavyhydrocarbons (C3 & C4) are knocked off the NG; then, the NG is transformed from a gas phaseto a liquid phase and sub-cooled to level where the LNG could be stored at atmosphericpressure. The next figure shows the steps of natural gas liquefaction:78
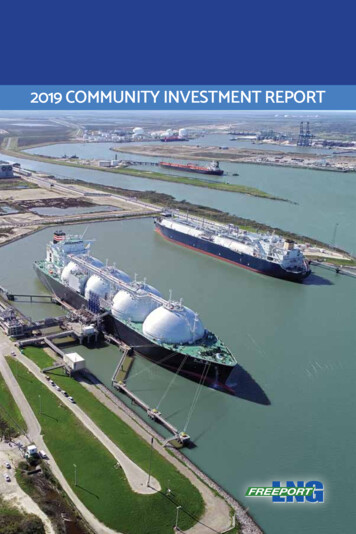
CDBAEFigure 2-14: Typical Gas Phase envelopeThe natural gas usually enters the liquefaction process from pretreatment at about 100 F (abovepoint A) and it is cooled down to about 60 F by either air or water coolers. Propane is usuallyused to cool the NG to about 40 F and this is where most of the water traces is condensed andknocked out of the NG by flashing. Then the NG is cooled down to its dew point (B) andfurther to its bubble point (C) and it is sub-cooled to a certain temperature (point D) after whichit is depressurized to atmospheric pressure through a valve. The final temperature is about -260F (point E).Exercise 2-7:Consider a south American gas of the following composition: 91.89%, 5.6% ethane, 0.96%propane, 0.02 % n-butane, 0.03% i-butane, 0.1% pentanes, 1.4 % nitrogen. Assume it isavailable at 800 psia and 77.7 oF. Determine the final temperatures (point D) necessary toachieve a final temperature of -265 o F.Exercise 2-8:Gas liquefaction is performed at high pressures (to reduce equipment size). Consider the gas ofthe previous exercise. Set up a simulation in which the gas is depressurized first to atmosphericpressure and proceed to liquefy it to the target temperature. Compare the duties needed.79
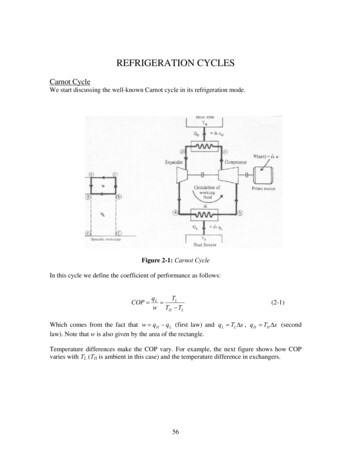
One very useful tool in gas liquefaction is the cooling curve. Such curve is shown in the nextfigure for a capacity of 4.5 mtpa.FGFigure 2-15: LNG cooling curveFrom this curve one can infer what is the minimum work needed in the process. Consider asmall heat differential dQ at a given temperature. If one runs a Carnot cycle between thistemperature and the ambient temperature, one obtains:dW dQ(TAmb Tlow)TAmb(2-2)Now an area differential dA is given by dA dQ(TAmb Tlow ) (see next figure). Therefore,integrating we obtain W A/TAmb. Thus, the bigger the area between the starting temperature(TAmb) and the curve, the more work the system has to perform.Figure 2-16: LNG cooling curve and work needed80
However, real processes cannot be built to exactly follow the cooling curve, and therefore,need to have temperatures below the curve. Thus, the closer the refrigeration heating curve tothe LNG cooling curve, the more efficient the process is. This is shown in the next figure.Figure 2-17: Refrigerant vs. LNG cooling curveThe area between the LNG cooling curve (orange line above) and the refrigeration heatingcurve (green line) represents the amount of heat lost during the liquefaction process. The areaabove the refrigeration line represents the amount of work done by the system and the closerthe lines are to each other the less work the system has to do. The figure above corresponds tothe MR process, in which a mixed refrigerant is used. The pure refrigerant-based Phillipscascade is shown below.Figure 2-18: Phillips Cascade LNG Cooling Curve81
We now show why the above system is more efficient when each refrigerant helps the nextrefrigerants.TambA1A21 A21Q1T1 A2A2 A22Q2 Q2T2Figure 2-19: Work needed for staged cyclesW2 Q2(T1 Tmin T2 ) A22A A2 A22 2T1 TminT1 TminT1 TminW1 (Q1 Q2 Q2 )(2-3)(T1 Tamb ) A21 A1 A21 A2 A21 TambTambTamb(2-4)The additional work indicated by the areas A21 and A22 are the result of the cyclesinefficiencies (they are not Carnot cycles). The area A2 is counted twice. In turn, both cyclesare independent using the ambient temperature as the highest part.W1 Q1(T1 Tamb ) A A A11 1 1Tamb TambTamb(2-5)(Tamb T2 )A2 A21 A2 W Q2 A2 TambTambTamb 2The difference is then 11 [ A2 A22 ] A1 A2 A21 A2 W A2 Tamb T1 Tmin Tamb T1 Tmin[(2-6)](2-7)which is negative.Exercise 2-9:a) Show that W 0b) Show using simulations what would be the difference in energy. Make an estimate of thedifference in capital involved.82
Overview of liquefaction processesAPCIThe APCI (Air Products and Chemicals Inc.) process, also called Propane Pre-cooled MixedRefrigerant Process (PPMR) currently holds 88% of the liquefaction plants on the market.They currently produce] 107.5 mtpa of LNG with 53 trains in operation. Their technology usesa three stage refrigerant cooling powered by two 85 MW Frame 7 compressors. The first stageis a pre- propane cooling stage that cools the mixed refrigerant and inlet treated gas to around –35 F. The next two cooling stages, held in a heat exchanger tower, use mixed refrigerants(MR) of about 27% methane, 50% ethane, 20% propane, 2% Butane ,and 1% nitrogen to cooland condense the natural gas. The flowsheet is shown in the next figure:Propane chills the gas during pre-treatment. A flash tank is used to separate the mixedrefrigerant to a heavy coolant (bottom/red stream) and a lighter coolant (top/green stream). Theheavy coolant (propane, butane, and some ethane) takes care of the cooling in the warm bundle(bottom part) of the heat exchanger tower which cools down the natural gas stream (bluestream) to about -50 oC and then the light coolant is sprayed back on the streams of the warmbundle via valves to insure that the refrigerant cooled the natural gas stream to the maximumpoint possible for this mix. The light coolant (methane, ethane and nitrogen) cools down thenatural gas stream to -160 oC in the cold bundle and this temperature is the point where naturalgas is converted to LNG. Similarly to the warm bundle, the light coolant is then sprayed on thestreams in the cold bundle of the heat exchanger tower and then mixed with the sprayed heavycoolant in the warm bundle and then compressed; that is the end of the cooling cycle. Theliquid coming out of the top of the heat exchanger tower is then separated via flash tank toLNG (bottom stream) and light fuel (top stream) which is later sent for fractionation in anothersector.Mixed Refrigerant 1% N2 27-30% Methane 50% Ethane 18-20% Propane 1-2% ButanePretreatedNatural GasFeedFigure 2-20: APCI process schematicsThe overall process requires around 200,000 hp out of the three Frame 7 compressors and theheat exchangers in the tower are Spiral Wound Heat Exchangers (SWHE). A SWH heatexchanger is more flexible and easier to control and it could handle heavy and efficient heatexchanging process, like the liquefaction process, via one big heat exchanger. The MCHE83
consists of two or three tube bundles arranged in a vertical shell with the process gas andrefrigerants entering the tubes at the bottom which then flow upward under pressure. Theoverall maximum is 5.0 MMmtpa but it can not go less than 4 MMmtpa.APCI has also invented their X technology. APCI-X uses nitrogen for the third refrigerant loopinstead of MR to cool down the natural gas. The addition of nitrogen to the loop takes some ofthe compression work off of the propane pre-cooling compressor allowing for increasedproduction. However, while APCI plans on implementing the new technology, production ofLNG by APCI-X is not expected for a few years.While APCI controls the majority of liquefaction plants in operation today, their older designshave limitations. As stated earlier, APCI uses Frame 7 compressors with a rating of about 85MW. Being so large, Frame 7 compressors only have one vendor that makes them (GE).Additionally, the use of large compressors raises reliability concerns. If one compressor goesdown, production halts until the problem is fixed. Another disadvantage of having a largecompressor is that it is only sufficient for large flow and it can not handle low flow rates (lessthan 1000 BCFD). The heat exchanger tower, SWHE are manufactured only by Linde. If anyclog or freezing occurs in one of the heat exchanging streams then the whole process is stoppeduntil the problem is fixed.Exercise 2-10:Make a Q-T diagram analyzing the APCI process. With the aid of the instructor set up asimulation to find the mixture that will have the right concentration, so that it follows closelythe given cooling curve.DMRThe DMR (Dual Mixed Refrigerant) is very similar to the APCI liquefaction process. Theprocess capacity is about 4.5 MMmtpa and there is only one DMR train in operation. Thelocation of this train is in Sakhalin Island in Russia.Figure 2-21: Duel mixed refrigerant flow diagram84
The process is similar to the APCI, but in this process the heat exchanger tower is divided intotwo sections rather than one tower and this concept allows the designer to choose the load oneach refrigeration cycle through controlling the two compressors work before each column.The first stage, which is the left column, cools the natural gas (red stream) to -50 oC while thesecond column cools the natural gas to -160 oC. The composition of the pre-coolant cycle is50/50 of Ethane/Propane on molar basis and the coolant composition of the cooling cycle issimilar to the composition of APCI and that is why it is called the Dual Mixed Refrigerantprocess (due to having two different refrigerants). The two compressors are frame 7compressors. The heat exchangers used in this process are also SWHE as used in the APCI.Shell also developed double casing equipment rather than a single casing to optimize theproduction to 5 mtpa. The advantages and disadvantages of this process is similar to the APCI,but since it has two separate compressors and heat exchangers it becomes more reliable thanthe APCI: Indeed, if one compressor or heat exchanger goes offline then the rest would do theliquefaction but with a smaller production rate.Exercise 2-11:Make a Q-T diagram analyzing the DMR process. With the aid of the instructor set up asimulation to find the mixture that will have the right concentration, so that it follows closelythe given cooling curve.LINDEThis process is also called the Mixed Fluid Cascade process (MFC). It was developed byLinde/Statoil LNG Technology Alliance and it has a capacity of 4 mtpa. Only one Linde trainhas been constructed with a maximum capacity of 4 mtpa for the Snohvit LNG project inEkofish on(SWHE)Sub coolingSection(SWHE)Figure 2-22:Linde process flow diagram85
The natural gas (red stream) comes in from the top and goes through three mixed refrigerantcycles. The pre-cooling cycle (green cycle) cools natural gas through two Plate-Fin HeatExchangers (PFHE) while the liquefaction (purple cycle) and sub-cooling (blue cycle) cyclecool via SWHEs. SWHE is made and patented by Linde and may also be used for the precooling stage. The only possible reason PFHE is used is because it is less expensive thanSWHE. The refrigerants are made mainly of methane, ethane, propane, and nitrogen but thecomposition ratio of the refrigerants would differ among the three stages.Table 2-2: Composition of Linde MRsPre-cooling(Green Cycle)Liquefaction(Purple Cycle)Sub-cooling(Blue Cycle)Propane (%) 60Ethane (%) 28Methane (%) 10Nitrogen (%) 2 3 12 80 5 7 10 80 3Frame 7 and 6 compressors have been proposed for this process to optimize it. The MFC hasthe same advantages and disadvantages of the other MR processes but it has an extra advantagewhich is the size and complexity of the separate SWHE applied in the MFC are less whencompared to the single unit heat exchangers like in the APCI or DMR. That allows largersingle compressors to handle refrigerant over a larger temperature range.Exercise 2-12:Make a Q-T diagram analyzing the LINDE process.ConocoPhillipsConocoPhillips currently has at least two trains in operation: Atlantic LNG, and EgyptianLNG. More trains are being constructed since this process is expanding to compete with theAPCI. It shares about 5% of the world’s LNG production and it has been in operation for morethan 30 years.NaturalGasMethaneLoopPropane LoopFuel GasEthylene LoopLNGFlash TankFigure 2-23: ConocoPhillips simple cascade schematic86
The process uses a three stage pure component refrigerant cascade of propane (purple),ethylene (green), and methane (red). The pretreated natural gas (black stream) enters the firstcycle or cooling stage which uses propane as a refrigerant. This stage cools the natural gas toabout -35oC and it also cools the other two refrigerants to the same temperature. Propane ischosen as the first stage refrigerant because it is available in large quantities worldwide and it isone of the cheapest refrigerants. The natural gas then enters the second cooling stage whichuses ethylene as the refrigerant and this stage cools the natural gas to about -95oC. At this stagethe natural gas is converted to a liquid phase (LNG) but the natural gas needs to be further subcooled so the fuel gas produced would not exceed 5% when the LNG stream is flashed.Ethylene is used as the second stage refrigerant because it condenses methane at a pressureabove atmospheric and it could be also condensed by propane. After methane has beencondensed by ethylene, it is sent to the third stage where it sub cools the natural gas to about 155oC then it is expanded through a valve which drops down the LNG temperature to about 160oC. Methane is sent back to the first cooling stage and the LNG stream is flashed into about95% LNG (which is sent to storage tanks) and 5% fuel gas used as the liquefaction processfuel. Methane is used as the sub cooling stage refrigerant because it could sub cools up to -155oC and it is available in the natural gas stream so it is available at all times and at lower costs.We will now attempt to perform a simulation of this simple process. We firs recognize that theboiling points of each of the refrigerants will limit the temperatures at the outlet of eachexchanger.Table 2-3: Refrigerants boiling pointsRefrigerantPropaneEthyleneMethaneBoiling Point (oC) -42 -103 -161We therefore set up a simulation using theoretical exchangers. This will allow figuring out thedifferent duties. The figure below shows a simulation designed with theoretical heat exchangerthat cools down the refrigerants to couple of degrees lower than it is boiling point in order tocondense it. Then the heat exchangers between the natural gas stream and the refrigerationcycles are designed to cool the natural gas to a temperature (T*) 10oC lower than the refrigerantboiling point.87
TheoreticalHeat ExchangerFuel GasNatural GasLNG*o*oo -95 CT -155C cascadeT 21FirstC simulationFigure 2-24:ConocoPhillipssimpleT* -35oC of TT -162oCExercise 2-13:Set up the first simulation for the ConocoPhillips simple cascade to produce 4.5 MTPa of LNG.Determine the appropriate flowrates in each cycle and the load of each compressor. Since youare using fictitious exchangers, these rates will change later. We pick the following pressuresfor the high pressure portion of the refrigeration loops: Propane: 1.3 MPa, Ethylene: 2.1 MPa,Methane: 3.3 MPA. The LNG is available at 10 atm for this example and is compressed to 3.9MPa.After the amounts of heat duties needed for each cycle is determined, the theoretical heatexchangers are replaced by exchangers that will allow real cooling take place.Exchangers between loopsPropaneEthyleneLNGMethaneWater CoolersNatural GasLNG Heat ExchangersFigure 2-25: ConocoPhillips simple cascade88
Exercise 2-14:Set up the complete simulation for the ConocoPhillips simple cascade to produce 4.5 MTPa ofLNG. Determine the appropriate flowrates in each cycle and the load of each compressor.Exercise 2-15:Set up the complete simulation for the ConocoPhillips simple cascade to produce 4.5 MTPa ofLNG. Use LNG exchangers in this case. Use zone analysis to see the internal temperatureprofile.The T-Q profile of the simple cascade is shown in the next figure:Q(MMBTU/hr)300Figure 2-26: Simple ConocoPhillips Cascade LNG Cooling CurveThe optimized Phillips design makes use of complex arrangements with flash tanks to increaseefficiency, as shown in figure 2-18. Flash tanks are located before every LNG heat exchangersto separate the liquid refrigerant from the vapor refrigerant and then the vapor phase refrigerantgoes to the compressor and the liquid is sent to the next LNG heat exchanger for furthercooling of the natural gas stream. This insures that only liquid phase refrigerant would cool thenatural gas stream, which will optimize the cooling process and makes it more efficient. Thefollowing figure shows the arrangement for a propane loop only.89
CompressorsFlash TanksNatural GasEthylene from theethylene loopFigure 2-27: Propane LoopLNG HXsThe procedure is explained using the P-H (Pressure-Enthalpy) diagram of propane of nextfigure:Flash Tank separationLiquidVaporFigure 2-28: Propane Loop P-H diagram90
We start at 90 oF (or at a lower temperature) and about 1.35 MPa, flashing across a valve to thenew pressure (0.74 MPa). The newly generated saturated liquid is then separated in a flash tankfrom the vapor which is sent to the first compressor. The liquid is split. A portion (76%) is sentto be further decompressed and sent to a flash, while the rest is put in contact with natural gasand after vaporized it is sent to the corresponding compressor. The process is repeated twomore time. The last LNG exchanger is used to cool down the ethylene in the higher pressureportion of the Ethylene loop.Exercise 2-16:Set up a propane loop using two flashes as shown below1.34 MPaS1S22E4HIGH0.7 S376%oE1-18 Co13 CE2The next figure shows a complete simulation of the ConocoPhillips optimized process and thefollowing tables give some highlights on efficiencies and workTable 2-4: Efficiencies of the ConocoPhillips processOverall Plant Production Efficiency 95%Operating RangeFull plantOne Turbine offlineThree Turbine offlineProduction100%60% to 80%30% to 60%Table 2-5: Total work done in refrigeration loopsLoopWork (hp)(% of total)Propane 45%Ethylene 20%Methane 35%91
PropaneloopNaturalGas InletEthyleneloopMethaneloopFigure 2-29: Simulation of the ConocoPhillips Optimized Process.It is expected that the ConocoPhillips Cascade Process will come
Figure 2-4: Wet refrigeration Cycle - The expander has been substituted by a throttling valve. If an expander had been used the line from d to a would be a vertical line. This is also done for mechanical reasons. The refrigeration cycles can also be represented in a P-H diagram. Figure 2-5: P-H diagram representation of a dry refrigeration cycle