Transcription
June 2019LNG Spot Price Forecastingand the Futures CurveOIES PAPER: NG147Nikolai Drahos, Visiting Research Fellows
The contents of this paper are the author’s sole responsibility. They do notnecessarily represent the views of the Oxford Institute for Energy Studies or any ofits members.Copyright 2019Oxford Institute for Energy Studies(Registered Charity, No. 286084)This publication may be reproduced in part for educational or non-profit purposes without specialpermission from the copyright holder, provided acknowledgment of the source is made. No use of thispublication may be made for resale or for any other commercial purpose whatsoever without priorpermission in writing from the Oxford Institute for Energy Studies.ISBN 978-1-78467-140-2DOI: https://doi.org/10.26889/9781784671402i
ContentsContents . iiFigures . iiIntroduction . 1Section 1: Recent forecasting history . 2Section 2: Literature review . 3Efficient Market Hypothesis. 3Empirical evidence . 4Liquidity and risk premiums. 4Section 3: Method . 5Data . 5NYMEX versus ICE . 6Forecast horizon . 6Models . 6Error measures . 6Section 4: Results . 8Overall results . 8Absolute errors . 12Confidence interval . 13Conclusion . 13Abbreviations . 15References . 16FiguresFigure 1: Asian LNG spot price and LNG imports of key Asian buyers, monthly . 3Figure 2: Relative mean absolute error of a futures-based forecast . 8Figure 3: Rolling futures-based forecast at selected time horizons (days) . 9Figure 4: Open futures contracts on the New York Mercantile Exchange on selected dates . 10Figure 5: Asian LNG futures curves on selected dates and Asian LNG spot prices . 10Figure 6: Relative mean absolute error of a futures-based forecast, backwardation versus contango. 11Figure 7: Percentage of futures-based forecasts that beat the naïve forecast . 12Figure 8: Mean absolute error and mean absolute percentage error of a futures-based forecast . 12Figure 9: Confidence interval (68 per cent) around a futures-based forecast . 13ii
IntroductionLNG spot prices in Asia have defied expectations over the past few years. During 2016 and 2017, LNGmarkets were widely expected to enter a period of overcapacity, resulting in a long period of low LNGspot prices in Asia. Instead, Asian LNG spot prices increased quickly due to surging demand,particularly in China, and delays in bringing new LNG projects online. In 2018, fears of overcapacitybegan to recede as LNG prices climbed further, and discussion turned to the potential for a future supplycrunch. However, by the time of writing in early April 2019, LNG spot prices in Asia had surprised again,having fallen rapidly to record lows. 1This paper aims to evaluate the accuracy of using the Asian LNG futures price — the current price ofLNG for delivery at a specified future date — to forecast the Asian LNG spot price.2 The assessment offorecasting performance has to be a relative one, measuring how different forecasting approachesperform against others (Bowman & Husain 2004). This paper compares futures-based forecasts againsta literature benchmark for testing forecasting methodologies — the ‘naïve’ or ‘no change’ forecast,under which future spot prices are forecast to equal the most recent spot price.3The key findings of this paper are as follows: The Asian LNG futures price has displayed some predictive power relative to a naïve forecastfor time horizons of around five months or less. However, a naïve forecast has performed betterthan a futures-based forecast for time horizons of over six months. The deterioration in the forecast accuracy of the LNG futures curve may be explained byuncertainties inherent in longer forecast horizons, declining liquidity in the futures market,and/or the presence of an increasing premium to hedge risk over longer time periods. Average forecast errors are substantially lower when the futures curve is in backwardation thanwhen the futures curve is in contango.4 However, these averages obscure the fact that thefutures curve has frequently detected upward movements in LNG spot prices when it is incontango, suggesting it can sometimes be a useful indicator of a tightening market.The paper is divided into four sections. Section 1 looks at forecasts for Asian LNG spot prices over thepast few years. Section 2 discusses why the Asian LNG futures price might contain information aboutfuture spot prices and reviews the commodity price forecasting literature relevant to this paper. Section3 outlines the methodology used in the paper, while Section 4 discusses the paper’s key findings.1Many thanks to Professor Tatsuyoshi Okimoto for his suggestions and comments. Tatsuyoshi Okimoto is Associate Professorof Economics and Finance at the Crawford School of Public Policy at the Australian National University.2Broadly speaking, a commodity purchased on the spot market is for immediate delivery (although in practice the time untildelivery varies depending on the market), whereas a commodity purchased in the futures market is for delivery at a specifiedfuture time.3Futures-based and naïve forecasting approaches are discussed in Section 3.4For the purpose of this paper, the futures curve is in contango when the futures price is higher than the spot price, and inbackwardation when the futures price is lower than the spot price.1
Section 1: Recent forecasting historyThe business model that evolved over the first few decades of the LNG industry’s existence was basedon inflexible, long-term contracts between buyers and sellers, under which LNG prices were linked tothe price of oil. During the mid-2000s, spot and short-term trade in Asia — defined as transactions oncontracts of four years or less — gradually increased. In 2018, spot and short-term trade in Asia totalled72 million tonnes, around 30 per cent of LNG trade in the region, with the majority of this probably purespot trades (GIIGNL 20195).Movements in LNG spot prices have proven difficult to anticipate over the past few years. Between2009 and 2015, the LNG industry embarked on an expansion of an unprecedented scale (Corbeau &Flower 2016, Henderson et al. 2016). Final investment decisions (FIDs) were taken for 19 new projectswith a combined capacity of 152 million tonnes per annum. The expansion was encouraged byexpectations of rapidly growing gas demand (particularly in Asia), high oil prices (to which LNG contractprices in Asia are linked) and, in the wake of Fukushima disaster in 2011, high LNG spot prices.Events, however, did not unfold as anticipated. Gas demand in Asia did not take off as expected andboth oil and LNG spot prices fell from 2014. In 2016, a period of overcapacity in LNG markets appearedto have arrived. Asian LNG spot prices fell as low as US 4.10/MMBtu, averaging US 5.80/MMBtu forthe year, well down on levels of over US 20/MMBtu of just a few years earlier.These events led to predictions of a long period of deep overcapacity in LNG markets, potentially lastingthrough until the mid-2020s or even later. Overcapacity was expected to result in a protracted period oflow spot prices in Asian LNG markets. Low spot prices were thought likely even if oil prices rebounded,with spot and oil-linked contract prices in Asia potentially diverging (FGE 2016). Forecasts over 2016and 2017 typically put Asian LNG spot prices in the US 5-7/MMBtu range until the end of the decade,if not into the early to mid-2020s (FGE 2016, Macquarie 2017, Bloomberg New Energy Finance 2017,Macdonald-Smith 2017, Department of Industry, Innovation and Science 2017).In the end, however, this period of low LNG spot prices in Asia was short-lived. LNG spot pricesincreased rapidly in late 2017 and, after briefly falling back at the start of 2018, increased andsubsequently stabilised at levels well above what was expected during 2016 (Figure 1). In 2018, LNGspot prices averaged US 10/MMBtu — well above the prices of US 5-7/MMBtu predicted by manyforecasters.A combination of demand-side and supply-side factors led to LNG markets tightening unexpectedly inlate 2017 and 2018 (Department of Industry, Innovation and Science 2018). In Asia, LNG demandincreased more rapidly than many had anticipated. After several years of flat or subdued LNG demandgrowth, China’s LNG imports took off in 2017 as the country sought to reduce air pollution byencouraging gas use in place of coal. Between 2016 and 2018, China’s LNG imports more thandoubled, increasing from 24 million tonnes to 54 million tonnes (Figure 1). South Korea’s LNG importsalso climbed quickly over the same period, reaching a record high of 45 million tonnes in 2018, as thecountry faced a number of nuclear shutdowns and the government introduced policies that supportedgas use in electricity generation. Meanwhile, Japan’s LNG imports remained relatively stable during2017 and 2018, rather than falling as some had predicted, with delays in restarting nuclear reactorssupporting gas demand. On the supply-side, delays in bringing LNG projects online in both Australiaand the United States gave time for strong demand growth to close the gap on supply capacity.5Pure spot trades accounted for 79 per cent of spot and short-term trades globally in 2018, although no such breakdown isavailable for Asia.2
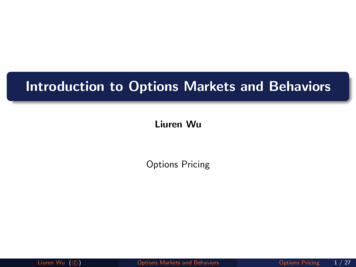
Figure 1: Asian LNG spot price and LNG imports of key Asian buyers, monthly18141512896US /MMbtuMillion tonnes101264320Mar-15ChinaMar-16South KoreaMar-17JapanMar-18Total0Mar-19Asian LNG spot price (rhs)Source: ArgusNotes: Settlement price for each contract month is shownWith LNG spot prices remaining relatively high in 2018, some forecasters began to retreat frompredictions of overcapacity in LNG markets and low LNG spot prices. Discussion instead turned to thepossibility of an emerging supply crunch from the early to mid-2020s. However, by the time of writing inApril 2019, LNG spot prices had surprised again. Spot prices fell sharply from late 2018, includingthrough the 2018-19 northern hemisphere winter, a time at which they would usually escalate due tohigher seasonal demand. In early April 2019, LNG spot prices in Asia were at their equal lowest levelon record at US 4-4.50/MMBtu.In light of recent forecasting history, it is worth considering if and when the futures curve might be auseful tool for forecasting LNG spot prices in Asia. Processes of price formation in Asian LNG spotmarkets are complex and are influenced by a wide range of factors, including hub prices in Europe andthe US, coal-to-gas switching, seasonal demand, storage levels and oil prices. However, whileprocesses of price formation in Asian LNG spot markets are complicated, the basic theory behind usingthe LNG futures curve as a forecast is that expectations of how all these factors will feed into LNG spotprices are embodied in the futures price. In other words, a futures-based forecast could help to cutthrough some of the complexity associated with price formation processes in the region.Section 2: Literature reviewEfficient Market HypothesisThe view that the futures price is the best forecast for the spot price is an implication of Efficient MarketHypothesis or EMH (Chin & Coibion 2014). In its simplest form, EMH suggests that futures prices reflectall available information about future spot prices. If futures prices did not reflect all available information,then market participants would use such information to buy and sell futures contracts in anticipation ofsecuring a profit, and futures prices and expected future spot prices would therefore converge. Underthe assumptions of risk neutrality and rationality of market participants (Westerlund et al 2014), EMHimplies that the futures price— the current price of an asset for delivery at a specified date — is equal3
to expected future spot price, as specified in equation (1). Ft,h is the futures price at time t for horizon h,Et indicates expectations at time t, and St h is the spot price at maturity date t h.𝐹𝑡,ℎ 𝐸𝑡 [𝑆𝑡 ℎ ] (1)Empirical evidenceThe empirical evidence on whether futures are a useful tool for predicting spot prices is mixed. Onegroup of studies found that futures prices are a useful guide for forecasting spot prices. Reichsfeld andRoache (2011) tested a futures-based forecasting approach for 10 commodities (agricultural, energyand minerals), concluding that futures are ‘hard to beat’. Their study found that, for most commodities,futures prices performed as least as well as a naïve forecast for most time horizons under two yearsand, in most cases, did significantly better.Similarly, Reeve and Vigfusson (2011) looked at 15 different commodity markets (agricultural, metalsand energy), finding that the futures price has generally outperformed a naïve forecast for forecasthorizons of three months and one year, although not by a large margin. Chin and Coibion (2014)suggest that futures prices for agricultural and energy commodities (although notably not for oil) containsome predictive content. Studies by Bowman and Hussain (2004) and Jin (2016) also suggest thatfutures prices have some predictive power.Another group of studies — mostly focused on oil markets — finds no evidence to support the idea thatfutures prices provide guidance on future spot prices. Alquist, Kilian and Vigfusson (2011), for example,found that futures prices are no more accurate predictors of oil spot prices than a naïve forecast fortime horizons of less than 12 months. Bopp and Lady (1991), Knetsch (2007) and Alquist and Kilian(2010) reach similar conclusions around the predictive value of oil futures prices. Chin and Coibion(2014) suggest that futures for base and precious metals are of little value for forecasting spot prices.While the predictive power of LNG futures prices has not been examined before, there is literature onnatural gas futures focused on Henry Hub prices in the United States. Reichsfeld and Roache’s 2011study found that Henry Hub futures prices have outperformed a naïve forecast for time horizons of upto a year, but that a naïve forecast records lower forecast errors at a two year time horizon. Reeve andVigfusson’s 2011 study found that Henry Hub futures have outperformed a naïve forecast at timehorizons of three months ahead and one year ahead, although the accuracy of futures was substantiallybetter at a three month horizon than at one year. Similarly, Chin and Coibion (2013) found that naturalgas futures were more accurate than a naïve forecast for periods of less than a year, and that futuresperformed better at shorter time horizons than at longer ones. A key theme from these studies is thatthe predicative power of futures deteriorates as the forecast horizon lengthens — a finding which isechoed in this paper. However, much like the broader literature, the evidence on the utility of naturalgas futures as a forecast is split. Mishra and Smyth (2016) find that Henry Hub futures prices do notperform any better than a naïve forecast for time horizons of four months or less.Part of the reason the literature is divided is that it covers many different markets, the availability of datacan differ from commodity to commodity, forecast accuracy is evaluated at different time horizons, andthe historical data used varies across studies. Further complicating matters is that there are differentmethods for testing the predictive value of futures prices. However, there are also two factors that mighthelp explain some of the differences in the forecast accuracy of the futures curve across differentmarkets: liquidity and risk premiums.Liquidity and risk premiumsOne factor that can affect the accuracy of a futures-based forecast is liquidity — that is, the amount oftrading activity — in the futures market. Theoretically, futures prices in more liquid markets should moreaccurately predict future spot prices because they are capturing the expectations of many marketparticipants. Reichsfeld and Roache (2011) suggest that lower liquidity at the back end of the futurescurve might account for the deterioration in forecast performance of futures observed in their study.4
However, empirical work by Chin & Coibion (2013) and Algieri and Kalkuhl (2014) suggests that liquidityonly explains a small percentage of errors in a futures-based forecast.Another factor that can affect the accuracy of a futures-based forecast is the presence of a risk premiumin the futures price. Both producers and consumers use futures contracts to manage risk. For example,a producer may enter a futures contract as a form of insurance against a decline in the spot price.Likewise, consumers may want to purchase a commodity in the futures market to insure against anincrease in prices. In order for a producer or a consumer to lock in a price in the future, investors requirea return to entice them to take the offsetting position in a futures contract. A risk premium is thecompensation that purchasers of futures contracts expect for taking on another party’s exposure tofluctuations in the spot price of a commodity.The effect of a risk premium on a futures-based forecast is captured in the risk premium model, whichsplits the futures price into the expected spot price at the maturity of the futures contract and a riskpremium (Hambur & Stenner 2017), as shown in equation (2). Ft,h is the futures price at time t for horizonh, Et indicates expectations at time t, and St h is the spot price at maturity date t h.𝐹𝑡,ℎ 𝐸𝑡 [𝑆𝑡 ℎ ] 𝑅𝑖𝑠𝑘 𝑝𝑟𝑒𝑚𝑖𝑢𝑚𝑡,ℎ(2)According to net hedging pressure theory, if the hedging activity of consumers (who are insuring againstan increase in prices) outweighs that of producers (who are insuring against a decrease in prices), thefutures price will need to be above the expected future spot price to attract investors: investors areagreeing to sell a commodity in the future at a set price, expecting to be able to obtain this commodityfrom the market at a lower price than for which they sold it. This implies a negative risk premium. Theopposite holds if the hedging activity of producers is greater than that of consumers.Risk premiums are thought to be larger (in absolute terms) for longer-maturity contracts, as investorsrequire higher returns over longer time periods (Hambur & Stenner 2017). Movassagh and Modjtahedi(2005) suggest that natural gas futures contain a risk premium, which grows as the forecast horizonlengthens, and biases their use as a forecast, although Chernenko et al (2004) find no such evidence.Section 3: MethodDataThe Asian LNG futures price used in this paper is the LNG Japan/Korea Marker (Platts), also known asthe JKM futures price.6 The futures price for a given month (known as the ‘contract month’) representsthe price for a cargo delivered during that month. For example, the futures price for the contract monthof July 2019 represents the price for LNG delivered in July 2019. This paper has looked at the forecastaccuracy of daily futures prices for contract months between October 2014 and April 2019 (inclusive).The JKM futures contract for a given month is settled based on the average Japan/Korea Marker (JKM)spot price, produced by Platts, between the 16th calendar day of the month that is two months prior tothe futures contract month, and the 15th calendar day of the month that is one month prior to the futurescontract month (the settlement period). More roughly put, the futures price is settled at the average spotprice between two and six weeks before the contract month. This paper, therefore, tests whether theJKM futures price for a given contract month is a good forecast for the average spot price during thesettlement period. For example, the paper evaluates whether the JKM futures price for the contractmonth of July is a good forecast for the average spot price between 16 May and 15 June.It is worth noting that final settlement under a JKM futures contract is on a cash basis; that is to say, onexpiry of the futures contract, the buyer does not receive the underlying commodity, but rather pays or6Korea refers to South Korea.5
receives the difference between the purchase price of the contract and the price of the futures contracton settlement (CME Group 2019).Ideally, the JKM spot price would be the Asian LNG spot price used in this paper. However, given thatthe author did not have access to the Platts JKM spot price, Argus Northeast Asian (ANEA) LNG spotprice data was used. The settlement price series used in this paper was derived from the four halfmonth ANEA LNG spot price series, following the Platts JKM spot price methodology (i.e. by taking anaverage price for the two half month cycles constituting the settlement period). The ANEA LNG spotprice series are constructed in a very similar way to the Platts JKM series: they are published in thesame units (US /MMBtu), based on the price of cargoes of the same minimum size delivered to thesame countries (Japan, South Korea, China and Taiwan), and roll over on the same day each month.Given that all Asian LNG spot price series follow each other very closely, and the magnitude of theforecast errors found in this paper, using ANEA spot data in place of the JKM is not likely to haveaffected the paper’s key findings substantially.NYMEX versus ICEJKM futures contracts are traded daily on several exchanges, but the most established is theIntercontinental Exchange (ICE), followed by the New York Mercantile Exchange (NYMEX), which ispart of the Chicago Mercantile Exchange (CME). Although the ICE is the more liquid of the twoexchanges, the JKM futures price on the NYMEX was used in this study. However, given that prices atboth exchanges are almost identical, the choice of exchange is unlikely to have had any influence onthe findings of this study.Forecast horizonThe forecast horizon for the futures price is given as the number of days until the start of the 30-dayperiod which determines the average JKM spot price for the contract month (the settlement period). Forexample, the futures price on 15 May is taken to be the one-day ahead forecast for the average spotprice between 16 May and 15 June.ModelsTwo forecasting approaches are assessed in this paper: a futures-based forecasting approach and a‘naïve’ or ‘no change’ forecasting approach. The naïve forecasting approach can be specified as in (3),where St is the spot price at time t and h is the number of days until the beginning of the settlementperiod for the contract month being forecast.𝑆𝑡 𝑆𝑡 ℎ (3)Using the same notation, the futures-based forecasting model can be specified as in equation (4). Inshort, the naïve forecast is for future spot prices to be equal to the current spot price, whereas thefutures-based approach predicts that future spot prices will be equal to the futures price.𝐹𝑡,ℎ 𝑆𝑡 ℎ (4)Error measuresThere are numerous measures for evaluating forecast accuracy. Hyndman and Koehler (2006) dividethese measures into four main categories: scale-dependent measures; measures based on percentageerrors; measures based on relative errors; and relative measures. All measures have strengths andweaknesses, and different error measures are appropriate in different situations (Armstrong & Collopy1992).Broadly following Armstrong (2001), the following notation is used for error measures: n is the naïve (no change) forecast, f is the futures-based forecast,6
m is the forecasting method (either futures-based or naïve), h is the horizon being forecast, Fm,h is the forecast from method m for horizon h, Ah is the actual value at horizon h, and N is the total number of forecasts at the relevant time horizon.The scale-dependent error method used in this paper is the Mean Absolute Error (MAE), which is theabsolute average difference between the forecast value and the actual value in dollar terms at aparticular time horizon. A downside of the MAE is that it can be heavily influenced by outliers.𝑁𝑀𝐴𝐸𝑚,ℎ 1 𝐹𝑚,ℎ 𝐴ℎ 𝑁𝑖 1One of the two relative measures used in this paper is the relative MAE, which provides astraightforward way of comparing the performance of the futures-based forecast and the naïve forecast.When the relative MAE 1, the futures-based forecast is better than the naïve forecast. When therelative MAE 1, the naïve forecast outperforms the futures-based approach.𝑅𝑒𝑙𝑎𝑡𝑖𝑣𝑒 𝑀𝐴𝐸𝑓,ℎ 𝑀𝐴𝐸𝑓,ℎ𝑀𝐴𝐸𝑛,ℎThe second relative measure employed is the Per Cent Better (PB) measure. The PB measureexpresses how often the futures-based forecast outperforms the naïve forecast as a percentage. Anadvantage of the PB measure is that it is not sensitive to outliers. However, a downside is that it doesnot capture the magnitude of errors for the forecasts being compared.𝑃𝐵𝑓,ℎ 𝑁𝑛 1 𝑗𝑓𝑥 100𝑁Where AE is the absolute error of a single forecast and𝑗𝑓 {1 𝑖𝑓 𝐴𝐸𝑓 𝐴𝐸𝑛0 𝑖𝑓 𝐴𝐸𝑓 𝐴𝐸𝑛The percentage-based error method used in this paper is the Mean Absolute Percentage Error (MAPE).One disadvantage of the MAPE is that it favours under-forecasting; for forecasts with the same absoluteerror, forecasts above the actual have a higher percentage error than forecasts below the actual(Armstrong 1992).𝑁𝑀𝐴𝑃𝐸𝑚,ℎ1𝐹𝑚,ℎ 𝐴ℎ 𝑁𝐴ℎ𝑖 1The Root Mean Squared Error (RMSE) is also used in this paper, given that its statistical propertiesallow for the construction of a confidence interval around forecasts. Assuming errors are normallydistributed, there is a 68 per cent chance that actual prices will fall within one RMSE of the forecast,and a 95 per cent chance that actual prices will fall within two RMSEs of the forecast (Reserve Bank ofAustralia 2012).𝑅𝑀𝑆𝐸𝑚,ℎ (2 𝑁𝑛 1(𝐹𝑚,ℎ 𝐴ℎ ))𝑁7
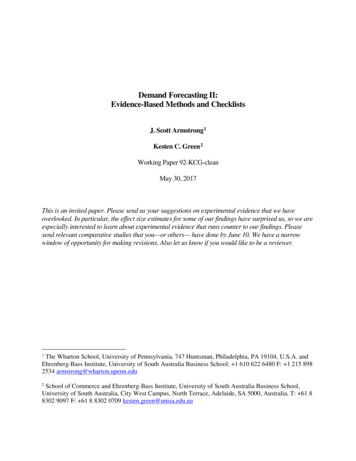
Section 4: ResultsOverall resultsA key finding of this paper is that a futures-based forecast has been more accurate than the naïveforecast for time horizons of up to around 150 days, or five months. The futures curve consistentlyperforms better than a naïve forecast for time horizons of around 120 days or less (four months), but isonly marginally better than a naïve forecast in the fifth month. After around 180 days (six months), thenaïve forecast consistently outperforms the futures-based forecast. This suggests that, for shorterforecast horizons, the futures price can give some indication of where LNG spot prices are headed.Figure 2 shows the relative mean absolute error of the futures-based forecast. A score of less than oneindicates that the futures-based approach has outperformed the naïve forecast, and a score of over oneindicates the opposite.Figure 2: Relative mean absolute error of a futures-based forecast21.81.6Relative MAE1.41.210.80.60.40.201316191121151181211Forecast horizon (days)241271301331Source: Argus, Bloomberg, author’s calculationsFigure 3 shows futures-based forecasts for a number of different time horizons on a rolling basiscompared with actual prices. The 30-day and 60-day forecasts picked up the general trend in spot pricemovements, although they missed just how steeply prices climbed during the 2016-17 and 2017-18nor
1 Introduction LNG spot prices in Asia have defied expectations over the past few years. During 2016 and 2017, LNG markets were widely expected to enter a period of overcapacity, resulting in a long period of low LNG