Transcription
Q4 2020Portfolio ReviewLittleton Public SchoolsPeter Mustian, MBA Principal, COOTroy Jensen, QKA, APA Vice PresidentDustin Roberts, QKA, AIF Vice PresidentReport Prepared by: John BrockColorado Arizona California www.innovestinc.com
2020 in ReviewDedication to Client Hard Work Honesty & Integrity11th straight year of revenue growth Grown 23 of last 24 yearsAcquired Advisory Consulting Group Deep compliance and recordkeeping expertiseProcess over prediction Rebalancing in melt down2020 Innovest Client Survey ResultsSeven new professionals at Innovest: NETPROMOTERSCORESteven Fraley, Peter Girard, Kendra Jensen,Alex Johnson, Dustin Roberts, Rick Rodgers,and Robert Stebbins4.7/5 4.7/5Promotions: 9.4/10Cos Braswell, Pam Cruz, Claire DeLine,Zach Heath, Brett Minnick, Sloan Smith,and Brooks UrichCUSTOMER SERVICE2SATISFACTION
Innovest’s History with Littleton Public Schools2014-2017 Signed contract between LPS and Innovest PortfolioSolutions, LLC in the 4th Quarter of 2014 Negotiated new contract with TIAA after RFI process Assisted with conversion Created new investment menu Coordinated the education efforts of the rollout Designed custom model portfolios as education tool forasset allocation. Replaced money market fund due to money marketreforms.2018 Replaced Blackrock Mid Cap Value fund with VanguardSelected Value fund. Conducted Fiduciary Education and share class review. Presented annual asset allocation study Presented Share Class review in 1Q18 Presented Ann Schleck in 1Q18 Presented IPS in 2Q18 Added Vanguard 2060 Target Retirement Reviewed the asset allocation studies for the educationmodels, no changes were made to the asset allocations4Q182019 Performed annual share class review 1Q19 Effective August 12, 2019, share class change forMetropolitan West total Return from MWTIX to MWTSX Reviewed and executed the Investment Policy Statement. Conducted an RFI and agreed to retain TIAA. The fee wasreduced from 0.42% to 0.34%, saving participants 20,000per year. Presented Fiduciary Education November 20192020 Presented asset allocation studies for the educationalmodels CARES Act Discussion 401(a) – did not implement any optional provisions 403(b) – Implemented all three optional CARES Actprovisions 457(b) – Implemented COVID withdrawals only Presented annual Fee Review, Annual Share Class Reviewand Presented a manager search for Small Cap Growth Effective August 27, 2020, replaced VOYA Small CapOpportunities R6 (ISOZX) with JPMorgan Small Cap GrowthR6 Fund (JGSMX) and a share class change from AmericanBeacon International Equity Inst (AAIEX) to R6 (AAERX). Presented fiduciary education in 3Q203
Retirement Plans Topics & TrendsCybersecurity ReviewWhat is Cybersecurity: The practice of defending a networks computer and other devices from digital attacks. It is composed ofthree key components: Information Technology (IT) Security – Protection of digital and physical data Cybersecurity – Protecting digital data on a network Network security – Protect IT infrastructureFour primary areas of concern are: Data breaches - Leading to the access of participant account information Fraud - Using stolen credentials to steal participant assets Malware & ransomware - Malicious software used to demand ransom for release of data Identity theft - Protecting personal data from the dark webDigital Trends: Digital security is slowly coming to replace many physical aspects Online enrollment, e-signatures, etc.Recordkeeping providers report investing about 10% of their overall IT budget in cybersecurity, with thenation’s largest recordkeeper investing over 200 million annually Worldwide spending on cyber security is going to reach 133.7 billion by 20221 Malicious cyber activity costs the US economy between 57 Billion and 109 Billion in 2016 alone2Some of the most common causes of data breach are weak passwords, too many permissions and malwareFraudsters will follow the money – The average 401(k) balance is over 100k and is not FDIC insured(1) stics-for-2020-cyber-observer/#(2) S.-Economy.pdf4
Retirement Plans Topics & Trends (continued)Cybersecurity ReviewFiduciary Duty: Plan fiduciaries have an obligation to safeguard plan assets and participant dataMust ensure security of the plan participants’ private personal informationWhile cybersecurity responsibilities may be delegated to recordkeepers, plan sponsors still have a duty toensure the provider maintains an effective, comprehensive cybersecurity programThe Department of Labor has not issued specific guidance, but plan fiduciaries should monitor in the samefashion as other components, such as fees and investmentsBest Practices for Retirement Plan Committees: Conduct a periodic cybersecurity review of the plan’s recordkeeperMost recordkeepers are eager to present a thorough review of their cybersecurity programMany plan sponsors include their in-house IT or security expertsCommittees should document the cybersecurity reviewExamples of Questions to Ask Your Recordkeeper About Cybersecurity Protection: Do they conduct Intrusion testing on their system?Do they enable 2-factor authentication to provide an extra layer of protection to participant accounts?Do they have a participant protection guarantee that will reimburse the plan/participant for unauthorizeddistributions?Can participants enroll in real-time alerts for account changes or withdrawal requests?Will the recordkeeper provide targeted communications campaigns to encourage participants to engage?5
Littleton Public Schools 401(a) Plan SummaryCurrent Structure PlanProvisions tsEducation Considerations and Next StepsLegal Plan Name and Plan Type: Littleton Public Schools Defined Contribution,401(a) Retirement PlanVesting Schedule: ImmediateEligibility Requirements: EmploymentRoth: N/ANormal Retirement Age: 65 yearsContribution Rate: Dependent on employee classification: Superintendent – Perannual employment contract; Superintendent staff: 2.5% 7,496.64;Administrators: 2.5% 1,300; Administrative Staff 2.5%; Technical support 2.0%Match Provision: N/AEnrollment: MandatoryLoans: NoHardships: NoInstallments: YesIn-Service Withdrawals: NoInvestment Direction: ParticipantNumber of Investment Options: 18QDIA/DIA: Yes, age-appropriate target date fundRe-enrollment: NoManaged Accounts: NoSelf-Directed Brokerage Window: YesGuaranteed Minimum Withdrawal Benefit Options: TIAA TraditionalInvestment Policy Statement: Last Updated August 2020Governance Documents:Plan Documents: Established April 2, 1996, Amended and effective July 1, 2012Fiduciary Education: Conducted 3Q 2020Recordkeeper Contract: TIAA, May 13, 2006, amended 2015Attorney: Attorney Name (if applicable)Auditor: Auditor Name (if applicable)Innovest Contract: December 2014Plan Expenses Paid by: Revenue Sharing: Revenue Sharing: 0.36% rev. req. –excess revenue sent to revenue credit accountAnnual Fee Review: December 2019Competitive Pricing Analysis: April 2015Other Fees: Brokerage fees, Investment ConsultantShare Class Review: December 2019Participant Education Plan: TIAA – 10 days of on-site educationAnnual deliverables are listed in BLUE.6Asset Allocation Study scheduled for 4Q reviewIPS review scheduled for 2Q reviewFiduciary Education scheduled for 3Q reviewFee review update scheduled for 1Q reviewShare Class review update scheduled for 1Q review
Littleton Public Schools 403(b) Plan SummaryCurrent Structure sGovernanceCostsEducation Considerations and Next StepsLegal Plan Name and Plan Type: Littleton Public Schools Tax-Deferred Annuity Plan,403(b)Vesting Schedule: ImmediateEligibility Requirements: Immediately EligibleRoth: Yes, effective July 1, 2017Safe Harbor: NoNormal Retirement Age: 65 yearsContribution Rate: EE - voluntary up to 19,500; catch-up contribution up to 6,500Match Provision: Yes, discretionary set by PERAEnrollment: ElectedAutomatic Enrollment: NoAuto-Escalation: NoLoans: YesHardships: YesInstallments: YesIn-Service Withdrawals: Yes at age 59.5Investment Direction: ParticipantNumber of Investment Options: 18QDIA/DIA: Yes, age-appropriate target date fundRe-enrollment: NoManaged Accounts: NoSelf-Directed Brokerage Window: YesGuaranteed Minimum Withdrawal Benefit Options: TIAA TraditionalInvestment Policy Statement: Last Updated August 2020Governance Documents:Plan Documents: Effective: July 1 1983; amended and restated January 1, 2015Fiduciary Education: Conducted 3Q 2020Recordkeeper Contract: TIAA, May 13, 2006, amended 2015Attorney: Attorney Name (if applicable)Auditor: Auditor Name (if applicable)Third Party Administrator: TPA Name (if applicable)Innovest Contract: December 2014Plan Expenses Paid by: Revenue Sharing: 0.36% rev. req. – excess revenue sent torevenue credit AccountAnnual Fee Review: December 2019Competitive Pricing Analysis: April 2015Other Fees: Brokerage FeesShare Class Review: December 2019Participant Education Plan: TIAA – 10 days of on-site educationAnnual deliverables are listed in BLUE.7Asset Allocation Study scheduled for 4Q reviewIPS review scheduled for 2Q reviewFiduciary Education scheduled for 3Q reviewFee Review update scheduled for 1Q reviewShare Class Review update scheduled for 1Q review
Littleton Public Schools 457(b) Plan SummaryConsiderations and Next StepsCurrent nvestmentsGovernanceCostsEducation Legal Plan Name and Plan Type: Littleton Public Schools 457(b) Deferred Compensation PlanVesting Schedule: ImmediateEligibility Requirements: Immediately EligibleRoth: Yes, effective July 1, 2017Normal Retirement Age: Combination of age years of service credit specified by PERAContribution Rate: EE – voluntary up to 19,500; catch up contribution up to 6,500Match Provision:Enrollment: Participant ElectedAutomatic Enrollment: NoAuto-Escalation: NoLoans: NoUnforeseen Emergencies: NoInstallments: YesIn-Service Withdrawals: NoForce Out Distributions:Investment Direction: ParticipantNumber of Investment Options: 18QDIA/DIA: Yes, age-appropriate target date fundRe-enrollment: NoManaged Accounts: NoSelf-Directed Brokerage Window: YesGuaranteed Minimum Withdrawal Benefit Options: TIAA TraditionalInvestment Policy Statement: Last Updated August 2020Governance Documents:Plan Documents: Effective: July 1, 2002; restated July 1, 2005; restated July 1, 2008,amended November 2015Fiduciary Education: Conducted 3Q 2020Recordkeeper Contract: TIAA, May 13, 2006, amended 2015Attorney: Attorney Name (if applicable)Auditor: Auditor Name (if applicable)Innovest Contract: December 2014Plan Expenses Paid by: Revenue Sharing: 0.36% rev. req. – excess revenue sent to revenuecredit accountAnnual Fee Review: December 2019Competitive Pricing Analysis: April 2015Other Fees: Brokerage FeesShare Class Review: December 2019Participant Education Plan: TIAA – 10 days of on-site educationAnnual deliverables are listed in BLUE8Asset Allocation Study scheduled for 4Q reviewIPS review scheduled for 2Q reviewFiduciary Education scheduled for 3Q reviewFee Review update scheduled for 1Q reviewShare Class Review update scheduled for 1Q review
Littleton Public Schools Annual Fee Review Plan assets as of 12/31/2019Investment, Recordkeeping and Administrative CostsPlan14,601,140Estimated Total Plan ExpensesBenchmark*Similarly Sized0.54%0.90%0.74%N/AEmployer PaidProviderExpense ratio retained by fund managerRevenue sharing sent to recordkeeperFee (in )Employee PaidFee (in %)Fee (in )TotalFee (in %)Fee (in )Fee (in %)Fund Managers 30,2540.21% 30,2540.21%TIAA 2,8010.02% 2,8010.02% 33,0550.23% 33,0550.23%Gross Investment Management Fees -0.00% 45,9940.32% 45,9940.32%Gross Recordkeeping and Administrative Fees -0.00% 45,9940.32% 45,9940.32%Total Investment, Recordkeeping and Administrative Costs -0.00% 79,0480.54% 79,0480.54% 29,6920.20% 29,6920.20% 108,7400.74% 108,7400.74%Recordkeeping/Administration FeeTIAAProfessional FeesInvestment ConsultantInnovestTotal Plan Expenses -0.00%*The plan's estimated investment, recordkeeping and administrative costs of 0.54% as shown above, compare favorably to 401(k) Source data, a universe of 51recordkeepers with similarly sized 401(k) plans, with an average investment, recordkeeping and administrative cost of 0.90%. Published since 1995, the 401kAverages Book is one of the oldest and recognized resources for comparative 401(k) average cost information in the industry.This review illustrates estimated plan costs based on available data.9
401(k), 403(b) & 457 Retirement Plan Statistics and Menu CoverageIndustry Averages*Plan AveragesAverage Number Investment Options19Number Investment Options18Average Contribution Rate6.2%/6.8%*Average Account Balance-401(a) 27,268Average Account Balance 157,535Average Account Balance-403(b) 37,352Average Account Balance-457 55,277*Contribution rate for lower compensated/higher compensated employees as defined by ADP testsSource: PSCA's 62nd Annual Survey of Profit Sharing and 401(k) Plans (2018)Menu CoverageTIER 1Target Date PortfoliosVanguard TargetRetirement IncomeVanguard TargetRetirement 2035Vanguard TargetRetirement 2015Vanguard TargetRetirement 2040Vanguard TargetRetirement 2020Vanguard TargetRetirement 2025Vanguard TargetRetirement 2050Vanguard TargetRetirement 2045Vanguard TargetRetirement 2030Vanguard TargetRetirement 2055Vanguard TargetRetirement 2060Model Portfolios (Educational)ConservativeCoreGrowthLargeDodge & Cox StockVanguard 500 IndexHarbor CapitalAppreciationMidCash EquivalentsVanguard SelectedValueVanguard Mid CapIndexJanus HendersonEnterpriseDFA U.S. Small CapValueVanguard Small CapIndexJPMorgan Small CapGrowthVanguard FederalMoney MarketUncommon Investment HoldingSpecialtyValueSmallTIER 2Vanguard Total BondMarket IndexAggressiveDomestic EquityFixed IncomeMetropolitan WestTotal Return BondModerateTIAA-CREF SocialChoice EquityStable ValueTIAA TraditionalInternational EquityValueCoreGrowthAmerican BeaconInternationalVanguard TotalInternational StockIndexAmerican FundsEuropacific10
Asset Allocation - 401(a)Asset AllocationAsset AllocationSep-2020( )%Large Cap EquityDodge & Cox StockVanguard 500 IndexHarbor Capital AppreciationTotal Large Cap EquityMid Cap EquityVanguard Selected ValueVanguard Mid Cap IndexJanus Henderson EnterpriseTotal Mid Cap 123,6670.916.493.1610.560.180.192.182.55Dec-2020( 8,6311.006.762.9810.750.220.492.102.81Small Cap EquityDFA US Small Cap ValueVanguard Small Cap IndexJP Morgan Small Cap GrowthTotal Small Cap EF Social Choice 781.534.88International EquityAmerican Beacon Intl EquityVanguard Total Intl Stock IndexAmerican Funds EuroPacific GrowthTotal International EquityLPS 401(a) Total Fund4,842,290100.005,289,939Sep-2020( )%Fixed IncomeMet West Total ReturnVanguard Total Bond Market IdxTotal Fixed 18,6461.380.862.24Stable ValueTIAA Traditional Annuity Retirement Choice .063,09773.08 400.0672.75Cash & EquivalentsVanguard Federal Money Market100.0011Dec-2020( )%Target Date FundsVanguard Target Retirement IncomeVanguard Target Retirement 2015Vanguard Target Retirement 2020Vanguard Target Retirement 2025Vanguard Target Retirement 2030Vanguard Target Retirement 2035Vanguard Target Retirement 2040Vanguard Target Retirement 2045Vanguard Target Retirement 2050Vanguard Target Retirement 2055Vanguard Target Retirement 2060Total Target Date 964291,309102,32818,4802,7203,538,625LPS 401(a) Total Fund4,842,290 100.00 5,289,939 100.00
Asset Allocation - 403(b)Asset AllocationAsset AllocationSep-2020( )%Large Cap EquityDodge & Cox StockVanguard 500 IndexHarbor Capital AppreciationTotal Large Cap EquityMid Cap EquityVanguard Selected ValueVanguard Mid Cap IndexJanus Henderson EnterpriseTotal Mid Cap .65Dec-2020( )%201,443830,305414,1341,445,883Fixed IncomeMet West Total ReturnVanguard Total Bond Market IdxTotal Fixed Income2.289.384.6816.33Stable ValueTIAA Traditional Annuity Retirement Choice 94115,770298,254441,2180.311.313.374.98Small Cap EquityDFA US Small Cap ValueVanguard Small Cap IndexJP Morgan Small Cap GrowthTotal Small Cap AA-CREF Social Choice Equity138,6241.75198,9482.25International EquityAmerican Beacon Intl EquityVanguard Total Intl Stock IndexAmerican Funds EuroPacific GrowthTotal International n Public Schools 403(b)Sep-2020( )%7,924,634100.008,852,342Cash & EquivalentsVanguard Federal Money Market100.0012Dec-2020( ,4924.10361,62212.40 5160.088,29852.59 630.0951.77Target Date FundsVanguard Target Retirement IncomeVanguard Target Retirement 2015Vanguard Target Retirement 2020Vanguard Target Retirement 2025Vanguard Target Retirement 2030Vanguard Target Retirement 2035Vanguard Target Retirement 2040Vanguard Target Retirement 2045Vanguard Target Retirement 2050Vanguard Target Retirement 2055Vanguard Target Retirement 2060Total Target Date 752189,820147,61046,7766,7264,167,362LPS 403(b) Total Fund7,924,634 100.00 8,852,342 100.00
Asset Allocation - 457Asset AllocationAsset AllocationSep-2020( )%Large Cap EquityDodge & Cox StockVanguard 500 IndexHarbor Capital AppreciationTotal Large Cap EquityMid Cap EquityVanguard Selected ValueVanguard Mid Cap IndexJanus Henderson EnterpriseTotal Mid Cap 62,7851.238.0713.3622.660.090.921.262.27Dec-2020( 591.398.0314.0523.470.120.871.432.42Small Cap EquityDFA US Small Cap ValueVanguard Small Cap IndexJP Morgan Small Cap GrowthTotal Small Cap REF Social Choice 1.094.67International EquityAmerican Beacon Intl EquityVanguard Total Intl Stock IndexAmerican Funds EuroPacific GrowthTotal International EquityLPS 457 Total Fund2,764,008100.002,984,971Sep-2020( )%100.0013Dec-2020( )%Fixed IncomeMet West Total ReturnVanguard Total Bond Market IdxTotal Fixed 36,0352.012.554.56Stable ValueTIAA Traditional Annuity Retirement Choice Plus159,4925.77145,1864.86Cash & EquivalentsVanguard Federal Money 6,7656.58218,8702.0666,2480.000.0036.94 .0037.93Target Date FundsVanguard Target Retirement IncomeVanguard Target Retirement 2015Vanguard Target Retirement 2020Vanguard Target Retirement 2025Vanguard Target Retirement 2030Vanguard Target Retirement 2035Vanguard Target Retirement 2040Vanguard Target Retirement 2045Vanguard Target Retirement 2050Vanguard Target Retirement 2055Vanguard Target Retirement 2060Total Target Date 41182,00656,8961,021,119LPS 457 Total Fund2,764,008 100.00 2,984,971 100.00
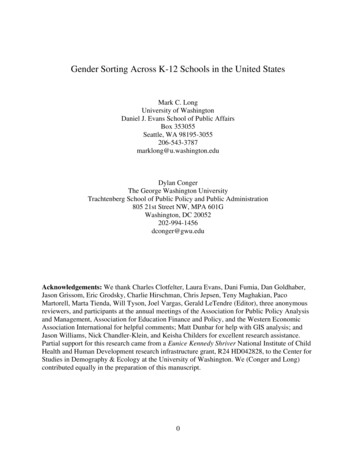
The MarketsInvestment Returns as of December 31, 0.00%-30.00%-40.00%-50.00%1st Quarter3rd Quarter2nd Quarter4th QuarterUS Large Cap StocksUS Small Cap StocksDeveloped International StocksEmerging Markets StocksCore Fixed IncomeMunicipal Fixed IncomeReturns for US Large Cap Stocks S&P 500 TR, US Small Cap Stocks Russell 2000 TR, Developed International Stocks MSCI EAFE NR, Emerging Markets Stocks MSCI EM NR, Core Fixed Income BBgBarc US Agg Bond TR, Municipal FixedIncome BBgBarc Municipal 5yr 4-6 TR14
Equity Performance as of December 31, 2020Value4th Quarter 2020YTD as of December 31, 2020Domestic EquityCoreGrowthValue1 yr Ending December 31, 2020Domestic EquityCoreGrowthValueDomestic l4.6%20.0%34.6%Small4.6%20.0%34.6%Developed International EquityValueCoreGrowth19.2%16.1%13.1%Emerging Markets19.7%Developed International EquityValueCoreGrowth-2.6%7.8%18.3%Emerging Markets18.3%Developed International EquityValueCoreGrowth-2.6%7.8%18.3%Emerging Markets18.3%3 Years Annualized5 Years Annualized10 Years AnnualizedValueDomestic EquityCoreGrowthValueDomestic EquityCoreGrowthValueDomestic 6.6%10.1%13.2%Small10.0%12.5%14.8%Developed International EquityValueCoreGrowth4.0%9.1%14.2%Emerging Markets13.2%Developed International EquityValueCoreGrowth2.5%6.0%9.4%Emerging Markets7.6%Developed International EquityValueCoreGrowth3.4%5.7%7.9%Emerging Markets4.9%Large Cap Equity S&P 500 TR, S&P 500 Value TR, and S&P 500 Growth TR. Mid Cap Equity Russell Mid Cap TR, Russell Mid Cap Value TR, and Russell Mid Cap Growth TR. Small Cap Equity Russell 2000 TR, Russell 2000 Value TR, andRussell 2000 Growth TR. International and EM Equity MSCI EAFE NR, MSCI EAFE Value NR, MSCI EAFE Growth NR, MSCI EM NR. Returns for time periods of 3 years or longer are annualized.15
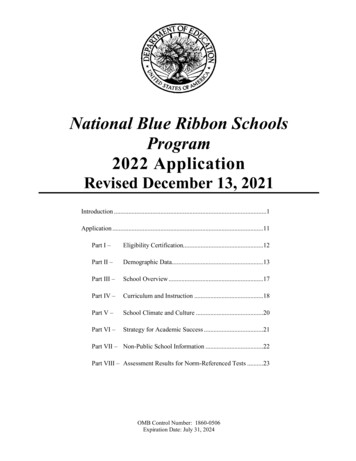
Domestic Equity Sector Performance as of December 31, 2020Fourth Quarter 4.9%0%5%EnergyConsumer Discretionary10%15%FinancialsHealth CareIndustrialsUtilities20%25%MaterialsConsumer StaplesTelecom ServicesReal Estate30%Info TechnologyOne Year Ending December 31, 2020-33.7%-40.0%0.5%-1.7%-2.2%-30.0%Info TechnologyConsumer Staples-20.0%-10.0%Consumer com ServicesFinancialsMaterialsReal Estate1623.6%20.7%20.0%30.0%Health CareEnergy43.9%33.3%40.0%Industrials50.0%
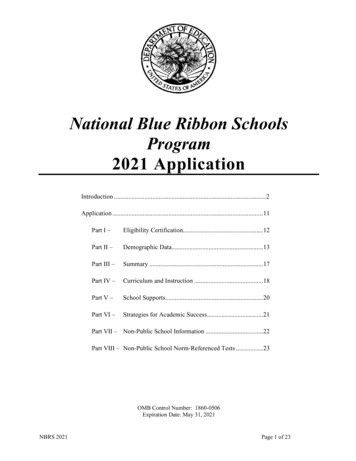
Investment Returns Over TimePeriods EndedDecember 31,2020Broad Market IndicesDomestic EquitiesLarge Cap Value StocksLarge Cap Core StocksLarge Cap Growth StocksMid Cap Value StocksMid Cap Core StocksMid Cap Growth StocksSmall Cap Value StocksSmall Cap Core StocksSmall Cap Growth StocksInternational EquitiesDeveloped International Value StocksDeveloped International Core StocksDeveloped International Growth StocksEmerging Markets StocksFixed IncomeCore Fixed IncomeDefensive Fixed IncomeMunicipal Fixed IncomeDefensive Municipal Fixed IncomeFloating Rate Corporate LoansHigh Yield Fixed IncomeDiversifying Asset ClassesLow Correlated Hedge FundsLiquid Low Correlated Hedge FundsCommoditiesMidstream EnergyGlobal REITsDirect Real EstateReinsuranceCalendar Year ReturnsAnnualized Periods Ended December 31, 2020QTDYTD201920182017201620151 yr3 yrs5 yrs7 yrs10 yrs20 3.516.010.012.514.86.16.66.89.79.47.89.28.16.819.2 -2.616.0 7.813.1 18.319.7 11.43.11.24.87.45.12.94.12.34.87.07.5 10.34.4 3.210.2 -3.110.2 -23.413.0 -6.21.3 1.2-0.1 8.77.8-0.70.00.80.13.86.5Returns based off the following indices: Large Cap Value Stocks S&P 500 Value TR, Large Cap Core Stocks S&P 500 TR, Large Cap Growth Stocks S&P 500 Growth TR, Mid Cap Value Stocks Russell Mid Cap Value TR, Mid Cap Core Stocks RussellMid Cap TR, Small Cap Value Stocks Russell 2000 Value TR, Small Cap Core Stocks Russell 2000 TR, Small Cap Growth Stocks Russell 2000 Growth TR, Developed International Value Stocks MSCI EAFE Value NR, Developed International Core Stocks MSCI EAFE NR, Developed International Growth Stocks MSCI EAFE Growth NR, Emerging Markets Stocks MSCI EM NR, Core Fixed Income BBgBarc US Agg Bond TR, Defensive Fixed Income BBgBarc 1-3 yr US Treasury TR, Municipal Fixed Income BBgBarc Municipal 5 Yr 4-6 TR, Defensive Municipal Fixed Income BBgBarc 1 Yr 1-2 TR, Floating Rate Corporate Loans S&P/Leveraged Loan TR, High Yield Bonds ICE BofA US High Yield TR, Low Correlated Hedge Funds HFRI Fund of FundsComposite Index, Liquid Low Correlated Hedge Funds Wilshire Liquid Alternatives Multi-Strategy Index, Commodities Bloomberg Commodity TR, Midstream Energy Alerian Midstream Energy TR, Global REITS S&P Developed Property TR, DirectReal Estate (Current Quarter, YTD, and Annualized Returns are preliminary) NCREIF ODCE, Reinsurance Eurekahedge ILS Advisers NR LCL17
Manager Score CardCriteriaOrganizationPeoplePhilosophy &StyleProcessConsistencyAsset BasePerformanceExpensesOverallExp 690.110.460.380.050.730.110.14Dodge & Cox Stock (DODGX)Vanguard 500 Idx;Adm (VFIAX)Harbor:Cap Apprec;Inst (HACAX)Vanguard Sel Value;Inv (VASVX)Vanguard Md-Cp I;Adm (VIMAX)Jns Hndsn:Enterprise;N (JDMNX)DFA US Small Cap Val;I (DFSVX)Vanguard S-C Id;Adm (VSMAX)JPMorgan:SmCp Gro;R6 (JGSMX)TIAA-CREF:Soc Ch Eq;Inst (TISCX)Am Beacon:Intl Eq;R6 (AAERX)Vanguard Tot I S;Adm (VTIAX)American Funds EuPc;R6 (RERGX)MetWest:Total Rtn;Plan (MWTSX)Vanguard Tot Bd;Adm (VBTLX)TIAA-TraditionalVanguard Fed MM;Inv (VMFXX)Vanguard Target Date (VTHRX)CostsMedianExp 950.901.040.600.600.730.420.70Ratio ofExp toMedian 372.6312.2244.2363.338.33100.0026.1920.00Legend For Overall CriteriaNo/Minimum ConcernsNew No/Minimum ConcernsMinor ConcernUpgrade to Minor ConcernMajor ConcernDowngrade to Minor ConcernUnder ReviewNew Major ConcernManagerDFA US Small Cap Val;I (DFSVX)Score FactorPerformanceDFA US Small Cap Val;I (DFSVX)ExpensesJPMorgan:SmCp Gro;R6 (JGSMX)OverallTIAA-TraditionalExpensesVanguard Fed MM;Inv (VMFXX)PerformanceCommentsThis fund has underperformed the median and benchmark in the 3- and 5- year time periods. DFA has a value tilt which has been out of favorrecently. Innovest will continue to monitor performance going forward.Effective February 2021 Dimensional Fund Advisors has reduced fees in 33 of their strategies including this one. Innovest sees this feededuction as a positive development for those invested as there is no change in investment philosophy and process.Effective July 30, 2021 JPM will soft close their small cap growth fund due to size constraints. This change only affects investors who are notcurrently allocated to the fund. Existing investors will be able to continue to add to this strategy.*General Accounts typically do not have an explicit, consistent expense ratio, as the fund manager instead derives revenue from the variablespread between the contractual rate of return and the actual underlying return of the portfolio. To reasonably approximate plan costs, themedian expense ratio for the stable value universe (IM U.S. GIC/Stable Value Median) is applied here.The Expense Ratio and Median Expense Ratio for Hedge Fund of Funds and Private Equity Fund of Funds excludes underlying fund expenses; the expenses shown are only at the Fund of Funds level.For additional disclosures related to any non-mutual fund alternative investments, please see the full disclaimer in the appendix.18
Table of rsSinceInceptionInceptionDateLarge Cap EquityDodge & Cox StockS&P 500 ValueIM U.S. Large Cap Value Equity (MF) Median20.86 (11)14.49 (69)15.777.16 (18)1.36 (71)2.627.16 (18)1.36 (71)2.627.52 (20)6.78 (31)5.8212.27 (6)10.52 (20)9.289.45 (10)8.71 (20)7.5911.96 (4)10.74 (21)9.7412.60 (7)11.23 (19)9.8310/01/2015Vanguard 500 IndexS&P 500 IndexIM U.S. Large Cap Core Equity (MF) Median12.15 (48)12.15 (48)12.0218.37 (40)18.40 (40)16.0018.37 (40)18.40 (40)16.0014.14 (30)14.18 (30)12.4415.18 (20)15.22 (20)13.5712.88 (17)12.92 (15)11.4013.85 (15)13.88 (13)12.4015.90 (19)15.94 (19)14.2310/01/2015Harbor Capital AppreciationS&P 500 GrowthIM U.S. Large Cap Growth Equity (MF) Median12.60 (29)10.66 (57)11.1254.43 (9)
2. Innovest's History with Littleton Public Schools 2014-2017 . Added Vanguard 2060 Target Retirement Reviewed the asset allocation studies for the education . Do they enable 2-factor authentication to provide an extra layer of protection to participant accounts?