Transcription
Investigating metabolic reprogramming by GR andLXR in triple negative breast cancerMRes MedicineSchool of Medicine University of LeedsByAnna NichollsSupervised by Dr Laura Matthews, University Academic Fellow, School of Medicine,University of Leeds, and Dr James Thorne, School of Food Science and Nutrition,University of LeedsJuly 2020Thank you to the Pathological Society and the Wolfson Foundation for theirgenerous sponsorship of this projectand the help of Freya Leif, Fiona Leslie, and Kathryn McGinnis in the laboratory1
Due to the COVID-19 pandemic the lab work for this project finished prematurely. Asa consequence, different experiments had been started to work towards the projectaims but no experiment had sufficient experimental repeats for statistical analysis.After discussion with The Pathological Society it was decided that this report wouldbe written in a way that explains what I have done this year but also my experienceof the course and research during the lockdown period. I hope that this report andthe lessons I learnt which I have shared may be useful to future students consideringpathology research as part of their intercalated degree.2
ContentsIntroduction .4Hypothesis . .7Specific aims . .7Does OCDO induce GR nuclear translocation? 7Does OCDO activate GR and LXR to drive transcription? 11What endogenous genes to GR and LXR coregulate?. .14Discussion . .20A COVID-affected course experience. 21Acknowledgements. .22References. .22Appendix. .253
IntroductionBreast cancer (BC) affects one in seven women in their lifetime (1). BCs are subtypedaccording to the expression of three receptors. These subtypes are used to stratifytreatment (2). Tumours expressing the oestrogen or progesterone receptors aretreated with Tamoxifen or aromatase inhibitors. Tumours expressing the Humanepidermal growth factor receptor (HER2) are treated with Herceptin, a HER2 inhibitor(3).Triple negative breast cancer (TNBC) is an additional BC subtype which lacksexpression of these receptors. TNBC is aggressive and accounts for 15-20% of BCs.Only the 10-15% of TNBC patients who have the BRCA1 or BRCA2 mutations maybenefit from Poly (ADP-Ribose) Polymerase inhibitors. For the remaining patients notargeted treatments are available for early stage disease (4). Despite chemotherapy,residual disease remains for 60-80% of patients and these patients have a poorprognosis (5,6). A new treatment is urgently needed.The oestrogen and progesterone receptors are nuclear receptors (NR). NRs areligand-activated transcription factors. Activation by a specific ligand results inregulation of expression of specific genes involved in cell fate, immunity, andmetabolism (7,8). There are two main types of response mediated by NRs; Type I NRstranslocate into the nucleus upon ligand binding whilst Type II NRs are constitutivelybound to DNA but are only active upon ligand binding (Figure 1) (9,10). Nuclearreceptors are highly druggable targets. Analysis of differentially expressed NRs inTNBC identified a strong metabolic signature (Figure 2) (Pfaender, unpublished).Within this signature, the glucocorticoid receptor (GR) and the Liver X Receptor (LXR)were differentially expressed suggesting that GR and LXR are potential drug targetsfor TNBC. Previously, high expression of GR showed association with worseprognosis in TNBC and antagonism of GR has shown some promise in early stagetrials (11–13).4
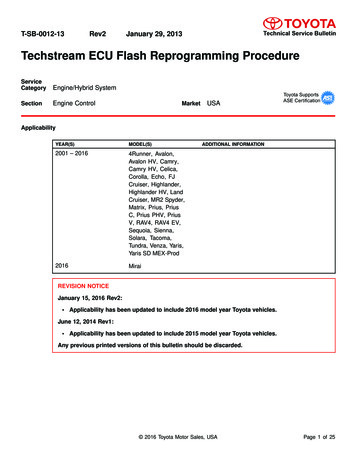
Figure 1: Two models of nuclear receptor (NR) action. Left: Type I NRs such as theoestrogen receptor (ER), progesterone receptor (PR) and the glucocorticoid receptor (GR)reside in the cytoplasm when they are not bound to a ligand. Upon ligand binding, the ligandreceptor complex translocates into the nucleus, binds to DNA at the nuclear receptor responseelement (NRRE) and recruits coregulators (CoReg) to activate or inhibit gene transcription.Right: Type II NRs such as Liver X receptor (LXR) and Retinoid R receptor (RXR) areconstitutively nuclear even when inactive, and bound directly to DNA. Figure was created fromresults described in (9) and (14).5
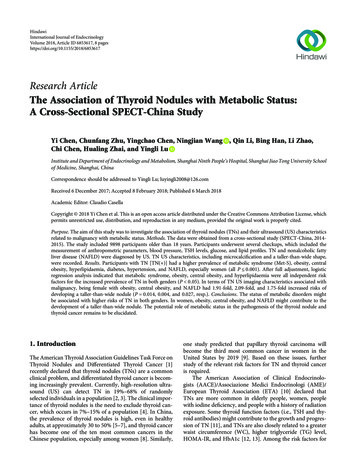
Figure 2: Bioinformatic analysis of nuclear receptor networks in BC. String analysis ofdifferentially expressed nuclear receptors was completed, and an additional two interactomelayers included to predict protein interaction networks. A cell cycle network emerges fortumours containing Oestrogen (ER) and Progesterone (PGR) receptors (blue circle) whereasa cell metabolism network emerges for TNBC tumours that contain Glucocorticoid (GR) andLiver X (LXR) receptors (red circle). Profiling of nuclear receptor expression, the stringanalysis and the production of this Figure was completed by Pauline Pfaender, as part of anErasmus project (Pfaender, unpublished).Furthermore, a cholesterol-derived oncometabolite, 6-oxo-cholestan-3β,5α-diol(OCDO), is present at higher levels in TNBC tissue compared to normal breast tissueand high levels of OCDO are associated with worse prognosis (15). The endogenousGR and LXR ligands (cortisol and 27-hydroxcholesterol) are also cholesterol-derived.OCDO drives GR-dependent proliferation and has been shown to bind to LXRhowever the role of OCDO in relation to lipid metabolism remains unexplored (15).6
HypothesisOCDO promotes GR and LXR activation and crosstalk in breast and promotesdetrimental cell metabolism in TNBC. Modulation of GR and LXR activity/crosstalkmay restore normal cell metabolism and therefore offer therapeutic benefit.Specific aims1. Determine the effect of OCDO on GR nuclear translocation, a marker ofactivation.2. Establish if OCDO can activate GR and LXR to drive transcription of reportergenes containing consensus response elements.3. Use existing data and bioinformatic tools to predict potential pathways andgenes that are commonly regulated by GR and LXR cross-talk.Two further aims if the pandemic had not occurred were:1. Confirm GR and LXR regulation of a small panel of genes.2. Assess the outcome of using GR and LXR modulators on coregulatedpathways.Does OCDO induce GR nuclear translocation?To determine the effect of OCDO on GR nuclear translocation MDA-MB-231 andMDA-MB-468 TNBC cells were treated with 100nM Dexamethasone (a positivecontrol) or 10μM OCDO for 1, 4, and 24 hours. Cells were fixed and stained for GR,the nucleus and the actin cytoskeleton. Cytoplasmic and nuclear GR were imaged,quantified and the nuclear GR: cytoplasmic GR ratio determined using ImageJ andCell Profiler. Two different microscopes were used to optimise the imaging process. Apipeline was produced using Cell Profiler which reliably identified nuclei and cytoplasmin the EVOS microscope images but this was not possible for the Widefield microscopeimages despite trying multiple different methods to identify cytoplasm outlines.Consequently only EVOS microscope images were used. This experience providedan opportunity to work through a computer-based problem systematically and judgewhen it is appropriate to continue with an issue and when to accept it is not workingand move on.7
For all time points Dexamethasone induced GR translocation in the nucleus in bothcell lines compared to untreated cells. OCDO appeared to induce some GRtranslocation in MDA-MB-231 but not MDA-MB-468 cells, which was more evident athigher magnification (Figures 3-4, expanded fields Appendix Figures A-D). LXR isconstitutively bound to DNA so activation by OCDO could not be assessed usingimmunofluorescence.8
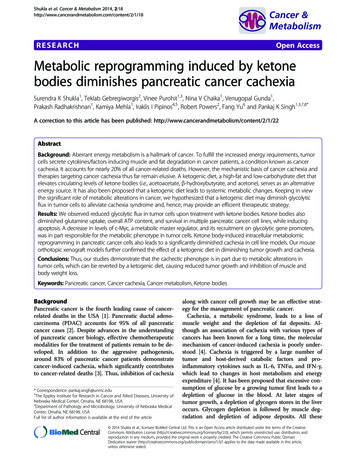
Figure 3: Quantification of ligand induced nuclear GR translocation in MDA-MB-468 andMDA-MB-231 cells after 1 and 4 hours. (A) Higher magnification images from Appendixfigures A and B. As indicated, green GR, red actin and blue DNA. White arrowheads highlightsOCDO treated cells with nuclear GR. Scale bar, 10μm. (B and C) Scatterplots showingnuclear/cytoplasmic ratios of GR after 1 and 4 hour treatments with 100nM Dexamethasone(Dex) or 10μM OCDO in MDA-MB-468 and MDA-MB-231 cells, quantified using cell profiler.Higher values indicate more nuclear GR. Red bars show mean ratio. N 1.9
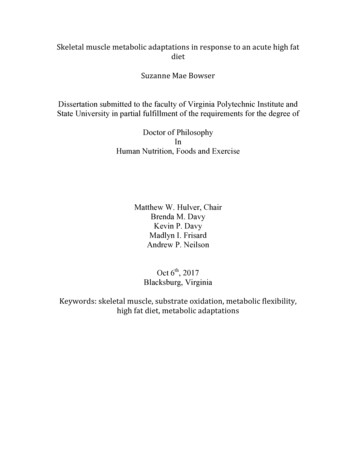
Figure 4: Quantification of ligand induced nuclear GR translocation in MDA-MB-468and MDA-MB-231 cells after 24 hours. (A) Higher magnification images from appendixfigures C and D. As indicated, green GR, red actin and blue DNA. White arrowheads highlightsOCDO treated cells with nuclear GR. Scale bar, 10μm. (B and C) Scatterplots showingnuclear/cytoplasmic ratios of GR after 24 hours treatments with 100nM Dexamethasone (Dex)or 10μM OCDO in MDA-MB-468 and MDA-MB-231 cells, quantified using cell profiler. Highervalues indicate more nuclear GR. Red bars show mean ratio. N 1.10
Does OCDO activate GR and LXR to drive transcription?A reporter gene assay (a synthetic system designed to measure transcription factoractivity) was used to investigate transcription. MDA-MB-231 and MDA-MB-468 cellswere transfected with a specific response element that drives luciferase enzymeexpression fused to the promoter region of a GR or LXR target gene (TAT3 andABCA1 respectively). When the transfected cells are treated with a drug targeting thetranscription factor that regulates that gene’s expression and luciferin substrate isadded, light is produced (Figure 5). A luminometer measures the light output; the morelight there is the more transcription factor activation there is. Cells were treated withOCDO and two positive controls, Dexamethasone and GW3965 (known GR and LXRagonists respectively).Figure 5: Diagrammatic representation of the GR and LXR reporters. (A)Transcription factor (TF) binding to the transcription factor response element (TFRE)activates luciferase production. When luciferin substrate is added light is produced.(B) The glucocorticoid receptor (GR) specific reporter which works as described in (A).Activation of the GR promoter of the TAT3 gene results in light production. (C) TheLiver X Receptor (LXR) specific reporter which works as described in (A). Activationof the LXR promoter of the ABCA1 gene results in light production. TAT3-Luc was agenerous gift from Dr J Iniguez-Lluhi (16). ABCA1-Luc was purchased from Addgene(#86442 (17)).11
Dexamethasone-treated cells showed a dose response for both cell lines transfectedwith the GR reporter. In MDA-MB-468 and MDA-MB-231 cells the mean luciferaseactivity increased modestly as OCDO concentration reached 3μM (Figure 6). Theresponse to OCDO was not as potent as Dexamethasone, indicated by the responseto significantly lower concentrations of Dexamethasone compared to OCDO.Figure 6: Activation of the GR responsive TAT3-Luc reporter by OCDO. MDA-MB-468and MDA-MB-231 cells were transfected with a TAT3-Luc reporter plasmid then treated withserial dilutions of Dexamethasone or OCDO in charcoal stripped calf serum for 16 hours. Foldchange in luciferase activity relative to luciferase activity in DMSO vehicle control treated cells.Error bars show standard error of the mean (A and B) and standard deviations from technicalreplicates (C and D). (A and B) n 2. (C and D) N 1.These preliminary data suggest that OCDO causes GR to translocate into the nucleusin MDA-MB-231 cells but possibly not in MDA-MB-468 cells. However, OCDOmediated GR-regulated transcription in both cells lines. Insufficient numbers of repeats12
were completed for the immunofluorescence and luciferase assays due to limited timeand hence no statistical analysis could be performed. Thus the hypothesis thatDexamethasone and OCDO cause GR translocation into the nucleus cannot beaccepted nor rejected. The data so far is promising however in supporting thehypothesis.MDA-MB-231 and MDA-MB-468 cells transfected with the LXR reporter showed doseresponses for GW3965 and OCDO (Figure 7). Thus the preliminary results suggestthat OCDO can activate GR- and LXR-mediated transcription in MDA-MB-468 andMDA-MB-231 cells although there was a greater response to LXR in MDA-MB-231cells than MDA-MB-468 cells.Figure 7: Activation of the LXR responsive ABCA1-Luc reporter by OCDO. MDA-MB-468and MDA-MB-231 cells were transfected with an ABCA1-Luc reporter plasmid and treatedwith serial dilutions of GW3965 and OCDO in charcoal stripped serum for 16 hours. Foldchange in luciferase activity relative to luciferase activity in DMSO vehicle control treated cells.Error bars show standard error of the mean for N 2 (A and B) and standard deviation of threetechnical repeats (C and D). (A and B) n 2. (C and D) N 1.13
What endogenous genes to GR and LXR coregulate?To identify genes that OCDO may have an effect on via GR- and LXR-mediatedtranscription, available online Chromatin Immunoprecipitation-sequencing (ChIP-seq)datasets for GR and LXR were quality assessed during the lockdown period. Ideallywe would have done ChIP-seq on our cells and the second best option would havebeen comparing datasets for GR and LXR in human breast. However, research onLXR is in its infancy so limited datasets were available. Other datasets had to beanalysed to select the best possible comparison (Table 1). For me, this was an insightinto potential limitations within research and how science can’t always use the goldstandard methods but other methods may be available that, although aren’t ideal ontheir own, when used together they are a useful substitute. In this project that meantidentifying possible important genes in TNBC coregulated by GR and LXR andconfirming their regulation using PCR.No direct human tissue comparisons could be made because of poor quality datasetsfor either GR or LXR for any given available tissue (Table 1). As mouse datasets arecommonly used to predict responses in humans, NR binding data in same tissuemouse datasets were considered as a possible proxy. However, when these wereoverlaid with GR in human normal and TNBC breast tissue there was negligibleoverlap possibly due to the complexity of human breast tissue and 5000 gene targetsbeing too restrictive (Figure 8). Increasing the number of gene targets selected above5000 was an option but this risked including more constitutively activated genes thatare not important to TNBC pathology. Therefore, it was next considered whether GRin human breast could be compared with LXR in another human tissue. The bestcomparison was between GR in normal and TNBC breast and LXRα in human adiposetissue which showed 243 genes coregulated by GR and LXRα specific to TNBC(Figure 9).14
Table 1: List of available human LXRα, LXRβ, and corresponding GR gene targetdatasets available for analysis from the Cistrome database (18,19). A dash indicates thatno datasets were available. Cistrome database ID, dataset uality,Cistrome ID (ref)Cistrome ID (ref)Cistrome ID (ref)Normal – goodBreast(normal and87683,Human--TNBC)(20)TNBC – sHumanHumanGoodGood69800,69805,(22)(23)-Poor8397, 41168, )(32)
Figure: 8: Overlay of human and mouse ChIP-seq data for GR and LXRs. Publicly availableChIP-seq data for GR, LXR and LXRβ were analysed using the Cistrome database. For eachdataset, the top 5000 peaks annotated to genes (note some genes had multiple peaks) wereselected and then compared using BioVenn (33). (A) Shows overlap between glucocorticoidreceptor (GR) in normal human breast (MCF10A), human TNBC (MDA-MB-231), and mousemacrophages and for the Liver X Receptor (LXR and LXRβ) in mouse macrophages. (B) Showsoverlap between GR binding sites in normal human breast, human TNBC, and mouse hepatocytesand LXRβ binding sites mouse hepatocytes. Numbers represent the number of gene targets (notthe number of peaks). Details of datasets are presented in Table 1.Figure 9: Overlay of human ChIP-seq data for GR and LXRs. Publicly available ChIP-seqdata for GR, LXR and LXRβ were analysed using the Cistrome database. For each dataset,the top 5000 peaks annotated to genes (note some genes had multiple peaks) were selectedand then compared using BioVenn (33). Figure shows overlap between GR binding sites innormal human breast (MCF10A), human TNBC (MDA-MB-231), and LXR binding sites inhuman adipose tissue. Numbers represent the number of gene targets (not the number ofpeaks). Details of datasets are presented in Table 1 .16
Unbiased gene pathway analysis of those 243 genes using Enrichr (34,35) identifiedthat lipid metabolism is likely to be an important point of GR and LXR crosstalk, whichwas consistent with the literature that outlines both NRs’ functions independently(Figure 10). To test that this was not just a result of using an adipose dataset theanalysis was repeated using LXRα and LXRβ in colorectal adenocarcinoma insteadof adipose and enrichment of fatty acid biosynthesis remained (not shown). Next,genes involved in these pathways were identified. Five lipid genes (FASN, ACACA,ADIPOR2, PRKAB1, and ABCA1) were consistently enriched in these pathways butthese genes could be regulated in different ways (Figure 11). NR binding graphs wereused to identify genes bound by GR and LXR in common sites (36). ABCA1 wasexcluded from further analysis as PCR analysis completed in the project but notdiscussed in this report suggested OCDO did not activate ABCA1 transcription. Whilethe ACACA gene had binding sites for GR, LXRα and LXRβ, there were no clearregions where binding sites were aligned (Figure 12A) suggesting GR and LXR mayregulate ACACA independently. Meanwhile binding sites were more closely alignedfor ADIPOR2, FASN, and PRKAB1 suggesting they GR and LXR may regulate thesegenes by crosstalk (Figure 12B-D). Therefore, these genes would have been takenforward for further analysis if the Coronavirus pandemic had not occurred.17
Figure 10: Gene ontology analysis of common gene targets for GR and LXRa. The listof 243 GR and LXR coregulated genes from figure 9, were input into Enrichr, a platform whichsearches a panel of ontology databases to predict altered pathways based on genesignatures. Graph shows significantly enriched pathways from three databases;Wikipathways, KEGG and Bioplanet. Bold font indicates pathways related to lipid metabolism.-log10 p value is plotted in each case, so higher values denote increased significance.18
Figure 11: Clustergram analysis of the 243 GR and LXRa shared gene targets. Theanalysis from figure 10 was extended to visualise individual genes within the top 10 enrichedpathways. Clustergrams shows significant regulation of genes that are enriched in the top 10ontologies (red squares) from all three databases; Wikipathways, KEGG and Bioplanet. Redfont indicates candidate genes that were highlighted by multiple independent databases.19
Figure 12: Mapping LXRa and GR, binding sites using data from the Cistrome database.Gene tracks for the three nuclear receptors were visualised in UCSC genome browser toidentify common binding (peaks) at, or upstream of transcriptional start sites (28,31,32,36).The four candidate coregulated genes ACACA, ADIPOR2, FASN and PRKAB1 are shown.Arrows below indicate transcriptional start site and direction of transcription. Red dashedboxes highlights potential regions for coregulation. Y-axis shows peak/ binding score. Scalein kilobases (Kb) shown for each gene.DiscussionDue to the Coronavirus pandemic there was not time to complete sufficient biologicalreplicates for the wet lab experiments. This was a frustration, as I had receivedtraining, and gained confidence in a variety of techniques but was unable to build onmy experience. Consequently, no statistical analysis could be completed on the dataand hence it is not possible to determine if any differences seen between treatmentsare due to random chance or biologically meaningful effects. Future work shouldcomplete experimental repeats to enable statistical analysis, complete PCR to confirmGR and LXR regulation of ADIPOR2, FASN, and PRKAB1, and complete LipidToxassays to define the effect of OCDO on lipid accumulation.20
This study adds evidence that OCDO binds directly to GR and activates GR-mediatedtranscription. It also adds evidence that OCDO activates LXR-mediated transcriptionand identifies a point of crosstalk between GR and LXR relevant to metabolism.A COVID-affected course experienceDespite lab work ending prematurely, during my six months in the lab I gained valuableexperiences in the scientific techniques described above. I developed problem-solvingskills from talking with my lab group to work out why a technique I had been trying fora number of weeks wasn’t working (which taught me why research can take a longtime!) to deciding the best datasets to use from the limited number available. Throughthese experiments and being part of weekly lab group meetings I gained anappreciation for the number of variable factors in an experiment, for example theantibody quality. I learnt how to critically appraise a paper during paper criticismtutorials and 1:1 conversations with my supervisors and I developed academic writingskills whilst writing my literature review and project report. Together these experienceshelped me appreciate the level of rigor research requires to demonstrate a theory.Informal lab meetings and seminars were excellent opportunities to hear about otherresearch projects and techniques as well as present my work too.Whilst pre-COVID I was happy working quietly I found working from home during thelockdown period challenging, particularly when we could only exercise once a day,because it was harder to split the day into sections. However, the experience mademe reflect on how I work best but also implement strategies to maintain productivity.Regular meetings with my supervisors were helpful for goal setting and kept the projectprogressing, plus, there was plenty of time for reading papers.There are so many unanswered questions in pathology. I look forward to using theskills which I developed this year in the future to help improve our understanding ofdiseases and new ways of treating them.Word count: 1,997 (excluding figure legends)21
AcknowledgementsThank you to my supervisors, Dr Laura Matthews and Dr James Thorne, for all oftheir support and advice throughout this project and for conceiving the projecthypothesis. Pauline Pfaender completed the string network analysis which identifiedGR and LXR as part of an enriched metabolic signature in TNBC which provided theinstruction for the project. Thank you to Freya Leif, Fiona Leslie, and KathrynMcGinnis for demonstrating the laboratory and analysis techniques to me.Thank you to the Pathological Society and the Wolfson Foundation for theirgenerous sponsorship of this w. Facts and statistics 2019. 2019.Korourian S, Kumarapeli A, Klimberg V. The Breast ComprehensiveManagement of Benign and Malignant Diseases [Internet]. 5th ed. Bland K,Copeland E, Klimberg V, Gradishar W, editors. Philadelphia: Elesvier; 2018.197–206 p. Available 559/the-breast#bookdescriptionSanta-Maria, CA Gradishar W. Adjuvant and Neoadjuvant Systemic Therapiesfor Early-Stage Breast Cancer. In: Bland K, Copeland E, Klimberg V,Gradishar W, editors. The Breast: Comprehensive Management of Benign andMalignant Diseases [Internet]. 5th ed. Elesvier; 2018. p. 752–62. d/pii/B9780323359559000556?token ey M, Haque T, Hassan S. Translating the role of PARP inhibitors in triplenegative breast cancer. Oncoscience [Internet]. 2019;6(1–2):287–8. Availablefrom: 55/NICE. Early and locally advanced breast cancer: diagnosis and management.2018.Cortazar P, Zhang L, Untch M, Mehta K, Costantino JP, Wolmark N, et al.Pathological complete response and long-term clinical benefit in breast cancer:The CTNeoBC pooled analysis. Lancet [Internet]. 2014;384(9938):164–72.Available from: ?X-Amz-SecurityToken 2FQ38OmUaWxxJsf1gqAiEA4iuyRbFRSAHuang W, Glass CK. Nuclear receptors and inflammation control: Molecularmechanisms and pathophysiological relevance. Arterioscler Thromb Vasc Biol.2010;30(8):1542–9.Sever R, Glass CK. Signaling by nuclear receptors. Cold Spring Harb PerspectBiol [Internet]. 2013;5(3):20894. Available 3578364/Evans RM. The steroid and thyroid hormone receptor superfamily. Science22
10.11.12.13.14.15.16.17.18.19.20.21.22.23.24.(80- ) [Internet]. 1988;240(4854):889–95. Available 6159881/Pratt W, Toft D. Steroid Receptor Interactions with Heat Shock Protein andImmunophilin Chaperones. Endocr Rev [Internet]. 1997 Jun 1;18(3):306–60.Available from: 0755Skor MN, Wonder EL, Kocherginsky M, Goyal A, Hall BA, Cai Y, et al.Glucocorticoid receptor antagonism as a novel therapy for triple-negativebreast cancer. Clin Cancer Res. 2013 Nov 15;19(22):6163–72.Han H, Wilks S, Paplomata E, Modiano M, Becerra C, Braiteh F, et al. AbstractP6-12-15: Efficacy results of a phase 1/2 study of glucocorticoid receptor (GR)antagonist mifepristone (MIFE) in combination with eribulin in GR-positivetriple-negative breast cancer (TNBC). In American Association for CancerResearch (AACR); 2017. p. P6-12-15-P6-12–5.Nanda R, Stringer-Reasor EM, Saha P, Kocherginsky M, Gibson J, Libao B, etal. A randomized phase I trial of nanoparticle albumin-bound paclitaxel with orwithout mifepristone for advanced breast cancer. Springerplus [Internet]. 2016Dec 1;5(1). Available df/10.1186/s40064-016-2457-1Pratt WB, Toft DO. Steroid Receptor Interactions with Heat Shock Protein andImmunophilin Chaperones*. Endocr Rev [Internet]. 1997 Jun 1;18(3):306–60.Available from: 0755Voisin M, De Medina P, Mallinger A, Dalenc F, Huc-Claustre E, Leignadier J,et al. Identification of a tumor-promoter cholesterol metabolite in human breastcancers acting through the glucocorticoid receptor. Proc Natl Acad Sci U S A.2017 Oct 31;114(44):E9346–55.Iñiguez-Lluhí JA, Lou DY, Yamamoto KR. Three Amino Acid SubstitutionsSelectively Disrupt the Activation but Not the Repression Function of theGlucocorticoid Receptor N Terminus. J Biol Chem. 1997;272(7):4149–56.Lai SC, Phelps CA, Short AM, Dutta SM, Mu D. Thyroid transcription factor 1enhances cellular statin sensitivity via perturbing cholesterol metabolism.Oncogene. 2018;Mei S, Qin Q, Wu Q, Sun H, Zheng R, Zang C, et al. Cistrome Data Browser:A data portal for ChIP-Seq and chromatin accessibility data in human andmouse. Nucleic Acids Res. 2017;45(D1):D658–62.Zheng R, Wan C, Mei S, Qin Q, Wu Q, Sun H, et al. Cistrome Data Browser:Expanded datasets and new tools for gene regulatory analysis. Nucleic AcidsRes. 2019;47(D1):D729–35.Enuka Y, Feldman ME, Chowdhury A, Srivastava S, Lindzen M, Sas-Chen A,et al. Epigenetic mechanisms underlie the crosstalk between growth factorsand a steroid hormone. Nucleic Acids Res. 2017;45(22):12681–99.Chen Z, Lan X, Wu D, Sunkel B, Ye Z, Huang J, et al. Ligand-dependentgenomic function of glucocorticoid receptor in triple-negative breast cancer.Nat Commun. 2015;6.Kolasinska-Zwierz P, Down T, Latorre I, Liu T, Liu XS, Ahringer J. Differentialchromatin marking of introns and expressed exons by H3K36me3. Nat Genet.2009;41(3):376–81.Savic D, Ramaker RC, Roberts BS, Dean EC, Burwell TC, Meadows SK, et al.Distinct gene regulatory programs define the inhibitory effects of liver Xreceptors and PPARG on cancer cell proliferation. Genome Med. 2016;8(74).Yan J, Enge M, Whitington T, Dave K, Liu J, Sur I, et al. Transcription Factor23
25.26.27.28.29.30.31.32.33.34.35.36.Binding in Human Cells Occurs in Dense Clusters Formed Around CohesinAnchor Sites. Cell [Internet]. 2013;514(4):801–13. Available onen P, Welter-Stahl L, Diwo J, Ryynänen J, Wienecke-Baldacchino A,Heikkinen S, et al. Genome-wide landscape of liver X receptor chromatinbinding and gene regulation in human macrophages. BMC Genomics.2012;13(50).Jing D, Bhadri VA, Beck D, Thoms JAI, Yakob NA, Wong JWH, et al.Opposing regulation of BIM and BCL2 controls glucocorticoid-inducedapoptosis of pediatric acute lymphoblastic leukemia cells. Blood [Internet].2015;125(2):273–83. Available from: i/10.1182/blood-2014-05-576470Galhardo M, Sinkkonen L, Berninger P, Lin J, Sauter T, Heinäniemi M.Integrated analysis of transcript-level regulation of metabolism revealsdisease-relevant nodes of the human metabolic network. Nucleic Acids Res.2014;42(3):1474–96.Oishi Y, Spann NJ, Link VM, Muse ED, Strid T, Edillor C, et al. SREBP1contributes to resolution of pro-inflammatory TLR4 signaling by reprogrammingfatty acid metabolism. Cell Metab [Internet]. 2017;25(2):412–27. Availablefrom: https://pubmed.ncbi.nlm.nih.gov/28041958/Heinz S, Benner C, Spann N, Bertolino E, Lin YC, Laslo P, et al. SimpleCombinations of Lineage-Determining Transcription Factors Prime cisRegulatory Elements Required for Macrophage and B Cell Identities. Mol Cell.2010;38(4):576–89.Oh KS, Patel H, Gottschalk RA, Lee WS, Baek S, Fraser IDC, et al. AntiInflammatory Chromatinscape Suggests Alternative Mechanism
Cell Profiler. Two different microscopes were used to optimise the imaging process. A pipeline was produced using Cell Profiler which reliably identified nuclei and cytoplasm in the EVOS microscope images but this was not possible for the Widefield microscope images despite trying multiple different methods to identify cytoplasm outlines.