Transcription
Eslami, A. and Fellenius, B.H., 1997. Pile capacity by directCPT and CPTU methods applied to 102 case histories.Canadian Geotechnical Journal 34(6) 886–904.
886Pile capacity by direct CPT and CPTu methodsapplied to 102 case historiesAbolfazl Eslami and Bengt H. FelleniusAbstract: Six methods to determine axial pile capacity directly from cone penetration test (CPT) data are presented,discussed, and compared. Five of the methods are CPT methods that apply total stress and a filtered arithmetic average ofcone resistance. One is a recently developed method, CPTu, that considers pore-water pressure and applies an unfilteredgeometric average of cone resistance. To determine unit shaft resistance, the new method uses a new soil profiling chart basedon CPTu data. The six methods are applied to 102 case histories combining CPTu data and capacities obtained in staticloading tests in compression and tension. The pile capacities range from 80 to 8000 kN. The soil profiles range from soft tostiff clay, medium to dense sand, and mixtures of clay, silt, and sand. The pile embedment lengths range from 5 to 67 m andthe pile diameters range from 200 to 900 mm. The new CPTu method for determining pile capacity demonstrates betteragreement with the capacity determined in a static loading test and less scatter than by CPT methods.Key words: cone penetration test, pile capacity, toe resistance, shaft resistance, soil classification.Résumé : Six méthodes utilisées pour déterminer la capacité axiale d’un pieu à partir des résultats de l’essai de pénétration aucône sont présentées, discutées et comparées. Cinq de ces méthodes sont des méthodes CPT (essai de pénétration au cône) quis’expriment en contraintes totales et par une moyenne arithmétique filtrée de la résistance en pointe. La dernière méthode,plus récente, est basée sur le CPTu (piézocône) et prend en compte la pression interstitielle et une moyenne géométrique nonfiltrée de la résistance en pointe. Dans cette méthode, la résistance du fût par unité de surface est déterminée par un nouvelabaque qui profile le sol en fonction des résultats CPTu. Les six méthodes ont été appliquées à 102 cas en combinant lesrésultats CPTu avec les capacités obtenues lors d’essais de chargement statique en compression et en tension. Les capacitésdes pieux vont de 80 kN à 8000 kN. Parmi les sols on trouve des argiles molles à raides, des sables moyennement lâches àdenses et des mélanges d’argile, de silt et de sable. Les longueurs d’enfouissement des pieux varient de 5 à 67 m et leurdiamètre de 200 à 900 mm. La nouvelle méthode CPTu pour déterminer la capacité d’un pieu est plus proche des résultats desessais statiques et est moins dispersée que les méthodes CPT.Mots clés : essai de pénétration au cône, piézocône, capacité d’un pieu, résistance du fût, classification des sols.[Traduit par la rédaction]IntroductionThe geotechnical engineering practice has developed severalmethods and approaches to estimate axial pile capacity. Themethods by necessity include simplifying assumptions and (or)empirical approaches regarding soil stratigraphy and loadtransfer. Therefore, the design often becomes somewhat of aguessing game and a rather subjective exercise. The work presented in this paper aims toward ameliorating the situation inthe area of static analysis of load transfer, basing the approachon in situ testing using the cone penetrometer, specifically thepiezocone, CPTu.The cone penetration test (CPT) is simple, fast, and relatively economical, supplies continuous records with depth, andallows a variety of sensors to be incorporated with the penetrometer. The advantage of using CPT data for pile design, asopposed to basing the analysis on a theoretical model, is thatdependency on “undisturbed” sampling and subsequent conventional laboratory testing are avoided. Moreover, it is notReceived January 30, 1997. Accepted June 25, 1997.A. Eslami. Department of Civil Engineering, University ofOttawa, Ottawa, ON K1N 6N5, Canada.B.H. Fellenius. University of Ottawa1010 Polytek Street, Unit 6, Ottawa, ON K1J 9H8, Canada.Can. Geotech. J. 34: 886–904 (1997).necessary to furnish intermediate parameters, such as earthpressure and bearing capacity coefficients, Ks and Nq. Becauseof similarities between the cone penetrometer and a pile, thepenetrometer can be considered as a model pile. In fact, estimation of pile capacity from CPT data was one of its firstapplications.Case histories from full-scale tests are compiled and analyzed by means of five direct CPT methods for pile capacityestimation employed in current North American practice andthe authors’ recently developed direct CPTu method.Case records database and soil profilingfrom CPTu dataA database of case histories from the results of 102 full-scalepile loading tests is compiled with information on soil type andresults of CPT soundings performed close to the pile locations.The cases were obtained from 36 sources reporting data from40 sites in 13 countries. Table 1 summarizes the main case record data as to reference, pile characteristics, pile loading testresults, and soil profiles.The majority of the case records are from the United States.The soils at the sites consist of sediments of clay (soft clay,stiff clay, silty clay, sandy clay), silt (clayey silt, sandy silt),and sand (clayey sand, silty sand, gravelly sand). About 80% 1997 NRC Canada
887Eslami and FelleniusTable 1. Case record summary.No.CaseReferenceGroup I1UBC3Site locationPile shape and Pile diameter, Embedment Total capacity,materialab (mm)length, D (m)Rult (kN)Soil profile21Campanella et al.1989UBC5Campanella et al.1989NWUPFinno 1989FHWASF O’Neil 1988BGHD1Altaee et al.1992a, 1992bBGHD2Altaee et al.1992a, 1992bPOLA1CH2M Hill 1987POLA2TOE Urkkada 1995TWNTP4 Yen et al. 1989TWNTP5 Yen et al. 1989TWNTP6 Yen et al. 1989L&D314Briaud et al. 1989L&D35Briaud et al. 1989L&D316Briaud et al. 1989L&D32Briaud et al. 1989L&D38Briaud et al. 1989L&D315Briaud et al. 1989A&N2Haustorfer andPlesiotis 1988N&SB144 Nottingham 1975QBSAKonrad and Roy1987UHUC1O’Neil 198122UHUT1O’Neil 1981Tex., U.S.A.P, S27313.248523UHUC11O’Neil 1981Tex., U.S.A.P, S27313.280024UHUT11O’Neil 1981Tex., U.S.A.P, S27313.2520Campanella et al.1989Campanella et al.1989Finno 1989Matsumoto et al.1995Tumay andFahkroo 1981Tumay andFahkroo 1981Tumay andFahkroo 1981Tumay andFahkroo 1981Tumay andFahkroo 1981Tumay andFahkroo 1981Reese et al. 1988B.C., CanadaP, S32413.8290Soft clay, sandB.C., CanadaP, S91567.07500Pa., U.S.A.JapanHP, SP, S45080015.28.210104700Calif., U.S.A.Sq, C3509.5900Soft clay, sand,siltSand, claySand clay (softrock)Sand, clayCalif., U.S.A.Sq, C45036.52950Calif., U.S.A.P, S40037.52800Calif., U.S.A.Tr, C50030.52160Calif., U.S.A.P, S35031.11710Calif., U.S.A.Sq, C75019.82610Silty clay, siltysandSilty clay, siltysandClay, siltysand, clayClay, siltysand, clayFill, sandy clayTex., U.S.A.Rd, C81024.17830Stiff clay, sand234567891011121314151617181920Group 532LSUN2833LSUN21534LSUR3035LTN741B.C., CanadaP, S32416.8630Soft clay, sandB.C., CanadaP, S32431.11100Ill., U.S.A.Calif., U.S.A.IraqP, SP, SSq, C45027328515.29.111.010204901000Soft clay, sand,siltSand, claySandUniform sandIraqSq, C28515.01600Uniform sandCalif., U.S.A.Calif., U.S.A.TaiwanTaiwanTaiwanIll., U.S.A.Ill., U.S.A.Ill., U.S.A.Ill., U.S.A.Ill., U.S.A.Ill., U.S.A.AustraliaOct, COct, CP, SP, SP, SHP, SP, SHP, SP, SP, SHP, SSq, 0446011706308705009458174250Silt, sandSilt, sandSand, clay, sandSand, clay, sandSand, clay, sandSandSandSandSandSandSandSandFla., U.S.A.Que., CanadaP, SP, S27022022.57.576583SandSensitive clayTex., U.S.A.P, S27313.2780Clay, sandyclayClay, sandyclayClay, sandyclayClay, sandyclay 1997 NRC Canada
888Can. Geotech. J. Vol. 34, 1997Table 1 (continued)ReferenceSite locationPile shape and Pile diameter, Embedment Total capacity,materialab (mm)length, D (m)Rult (kN)No.Case36LTN484Tucker 1986Calif., U.S.A.Rd, C4507.6750Soil profile3738LTN742NETH2Reese et al. 1988Viergever 1982Rd, CSq, C81025624.19.3585070039MILANOGambini 1985Tex., U.S.A.TheNetherlandsItalyP, S33010.062540OKLACORd, C66018.236004142L&D31SEATWP, SRd, C30035014.215.813109004344GIT1KP1Neveles andOkla., U.S.A.Donald 1994Briaud et al. 1989 Ill., U.S.A.Horvitz et al. 1981 Wash.,U.S.A.Mayne 1993Ga., U.S.A.Weber 1987BelgiumRd, CHP, S75040016.814.04500350045MP1Weber 1987FranceHP, S40014.0212546KALO14ABelgiumRd, C60012.0550047KALO14BBelgiumRd, C60012.06100Peat, clay, sand48A&N3AustraliaSq, C35510.2130049USPB1Van Impe et al.1988Van Impe et al.1988Haustorfer andPleslotis 1988Albiero et al. 1995Fill, silty sandSoft soil, densesandSoft clay, stiffclayPeat, clay, sandBrazilRd, C3509.464550USPB2Albiero et al. 1995 BrazilRd, C4009.4725515253N&SWPB1 Nottingham 1975N&SWPB2 Nottingham 1975N&SB143 Nottingham 1975Fla., U.S.A.Fla., U.S.A.Fla., U.S.A.Sq, CSq, CP, S4504502708.011.322.51140830162054N&SB1348 Nottingham 1975Fla., U.S.A.Sq, C45014.9172055PRSUrkkada 1996Puerto RicoP, S30028.412405657PRLUFL53Puerto RicoFla., U.S.A.P, SSq, lP, SRd, C27350012.08.716863000Fill, tillSilty sand60YOG1YugoslaviaRd52012.043061A&N1AustraliaSq, C45014.0385062PNTRA5U.K.P, S21925.019063PNTRA6U.K.P, S21932.546064CVVDNCU.K.P, S30510.040065CWDNDU.K.P, S30510.040466CWDNEU.K.P, S30510.038067CWDNFUrkkada 1996Avasarala et al.1994Hunt 1993Decourt andNiayama 1994Milovoc andStevanovic 1982Haustorfer andPlesiotis 1988Almeida et al.1996Almeida et al.1996Aimeida et al.1996Aimeida et al.1996Almeida et al.1996Almeida et al.1996Silt, sand,dense sandClay and silt,silty sandClay and silt,silty sandSilty sandSilty sandSand, densesandSand, densesandPeat, sand, softclayPeat, sand, claySand, siltU.K.P, S30510.0390Silty sand,clay, sandStiff clay, sandFill, clay, siltysandClay, siltysand, claySand, silty clay(shale)SandSandClayDense sand,limestoneStiff clay, silt,clayStiff clay, silt,clayStiff clay, till,silty sandStiff clay, till,silty sandStiff clay, till,silty sandStiff clay, till,silty sand 1997 NRC Canada
889Eslami and FelleniusTable 1 DNK73ONSYA174ONSYB175LSTDA776LSTDA877LSTDB2Group III78JPNOT2ReferenceSite locationPile shape and Pile diameter, Embedment Total capacity,materialab (mm)length, D (m)Rult (kN)Soil profileAlmeida et al.1996Almeida et al.1996Almeida et al.1996Almeida et al.1996Almeida et al.1996Almeida et al.1996Almeida et al.1996Almeida et al.1996Almeida et al.1996Almeida et al.1996U.K.P, S20310.0311U.K.P, S20310.0350U.K.P, S20310.0290U.K.P, S20310.0280U.K.P, S20310.0350NorwayP, S21915.0105Stiff clay, till,silty sandStiff clay, till,silty sandStiff clay, till,silty sandStiff clay, till,silty sandStiff clay, till,silty sandSoft clayNorwayP, S81215.0444Soft clayNorwayP, S21915.078Soft clayNorwayP, S21922.586Soft clayNorwayP, S81215.0374Soft clayMatsumoto et al.1995Matsumoto et al.1995Tumay andFahkroo 1981Tumay andFahkroo 1981Tumay andFahkroo 1981Tumay andFahkroo 1981Avasarala et al.1994Avasarala et al.1994Neveles andDonald 1994Laier 1994JapanP, S8008.23190JapanP, S8008.23250Calif., U.S.A.Rd, C90037.83960Calif., U.S.A.P, S40041.81890Calif., U.S.A.Sq, C45029.01935Stiff clay (softrock)Stiff clay (softrock)Silt, silty clay,sand, siltClay, siltysand, clayClay, sand, clayCalif., U.S.A.Sq, C60019.82025Fill, sandy clayFla., U.S.A.Sq, C35016.01350SandFla., U.S.A.Sq, C50011.02070SandOkla., U.S.A.P, S61018.23850Ala., U.S.A.HP, S31036.32130Ill., U.S.A.Ill., U.S.A.Ill., U.S.A.Ill., U.S.A.Ill., U.S.A.Ill., U.S.A.YugoslaviaHP, SHP, SP, SP, SHP, SHP, .5290036001300180011701260700Sand, silty clay(shale)Sand, siltyclay, sandSandSandSandSandSandSandClayCalif., U.S.A.Rd, C4006.51385Silty sand, sand4009.31370ItalyRd, C50835.85500ItalyRd, C50842.06000Silt, gravellysandSandy slit,dense sandSilty sand,clay, d et al. 1989Briaud et al. 1989Briaud et al. 1989Briaud et al. 1989Briaud et al. 1989Briaud et al. 1989Milovic andStevanovic 1982Richmann andSpeer 1989Richmann andSpeer 1989Appendino 198198PT361Appendino 1981Calif., U.S.A.Rd, C 1997 NRC Canada
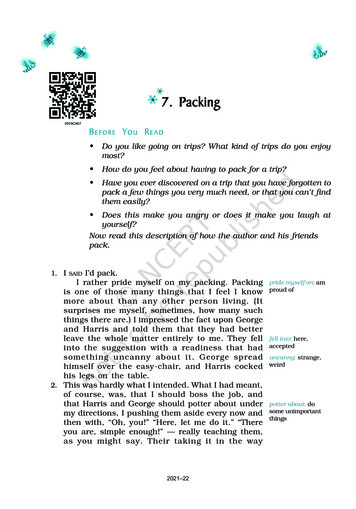
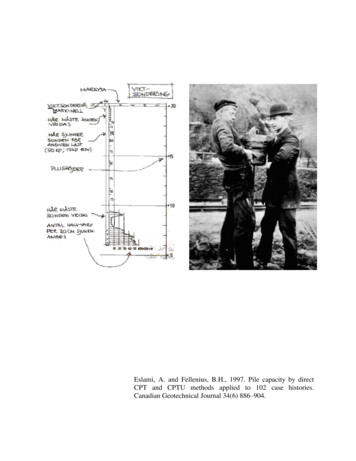
890Can. Geotech. J. Vol. 34, 1997Table 1 16N&SBI42ReferenceNottingham 1975Nottingham 1975Nottingham 1975Nottingham 1975Site locationFla., U.S.A.Fla., U.S.A.Fla., U.S.A.Fla., U.S.A.Pile shape and Pile diameter, Embedment Total capacity,materialab (mm)length, D (m)Rult (kN)Sq, CSq, CSq, CP, S4502503502709.221.315.915.218458101485660Soil profileSand, claySand, silty sandFill, silty sandFill, sand,dense sandP, pipe; Sq, square; Oct, octagonal; HP, H section; Rd, round; Tr, triangular; C, concrete; S, steel.Fig. 1. Typical piezocone profile (data from Yen et al. 1989). Rf, friction ratio; u, pore pressure.of the CPT cases included in the data are obtained by electricalcone and 20% by mechanical cone. All cases from silt and claysoils, about half the total, include pore-pressure measurements.Most of the CPT measurements are at a vertical spacing of300 mm or smaller. A typical CPTu profile taken from one ofthe records is shown in Fig. 1.Most of the piles have a square or round cross section andthe pile materials are steel and concrete. All but 10 of the pileswere installed by driving. The pile embedment lengths rangefrom 5 to 67 m, the pile diameters from 200 to 900 mm, andthe pile capacities from 80 to 8000 kN. The cases have beenseparated into three groups as follows.Group I (cases 1–24 in Table 1) includes 14 compressionstatic loading tests, where the toe and shaft resistances weredetermined separately, and 10 tension tests. Thus, the databaseincludes 14 cases of known toe resistance and 24 cases ofknown shaft resistance.Group II (cases 25–77 in Table 1) includes 34 compression static loading tests for which no separation of shaft andtoe resistances is reported, and 19 tension tests, where the conedata do not include records of sleeve friction.Group III (cases 78–102 in Table 1) includes cases wherethe ultimate resistance was not indisputably reached in thestatic loading test. The maximum load is, therefore, considereda lower-bound capacity in these cases. Some of the producersof the data designated the maximum test load to be the capacityof the pile, which may actually be the case for some of the tests.A primary purpose of the CPT is to identify the soil layerboundaries and determine soil type in terms of the grain size,i.e., soil profiling. Begemann (1953, 1963, 1965) pioneered soil 1997 NRC Canada
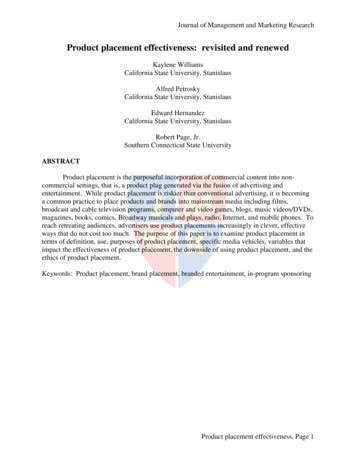
891Eslami and Felleniusprofiling based on mechanical cone data and pointed out thatthe soil type can be related to the CPT friction ratio (ratio ofsleeve friction to cone resistance). The Begemann soil profiling chart presents cone resistance against sleeve friction (mechanical cone data only). Later investigations (Campanella andRobertson 1988) have shown the need for correcting the coneresistance for the pore pressure generated at the cone shoulder.The advent of the piezocone enabled soil profiling that includescone resistance, sleeve friction, and pore pressure measurements.Robertson et al. (1986), Robertson (1990), and Campanellaet al. (1989) proposed soil profiling charts based on piezoconedata by plotting the cone resistance versus friction ratio. Thismanner of plotting means that a variable is plotted versus itsown inverse value in the charts, which violates the fundamental rule that dependent and independent variables must be rigorously separated and distorts the data. The authors prefer touse a profiling diagram similar to that presented by Begemann(1965), with two differences: First, the cone resistance, qc, is corrected for the pore pressure acting on the shoulder. (The correctedresistance is denoted qt.) Second, an “effective” cone resistance,qE, is used instead of the cone resistance, qc (qE qt - u2, whereu2 is the pore pressure measured behind the cone point). Thediagram uses a log–log plot to magnify the relations in soft andloose soil as opposed to the linear plot used by Begemann(1965).The database contains a large amount of cone test data, whichhave been plotted in a cone resistance (qE) versus sleeve friction(fs) diagram. The data points were found to segregate on five mainsoil categories: collapsive–sensitive soil, soft clay – soft silt, siltyclay – stiff clay, silty sand, and sand and gravel, as delineatedin Fig. 2. The boundaries shown in the diagram were obtainedby enveloping approximately 90% of all points of each mainsoil category. A detailed presentation of the profiling methodwill be presented in a separate paper.Pile capacity from CPT dataTwo main approaches for application of cone data to pile design have evolved: indirect and direct methods. Indirect CPTmethods employ soil parameters, such as the friction angle andundrained shear strength estimated from the cone data asevaluated from bearing capacity and (or) cavity expansiontheories, which introduce significant uncertainties. The indirectmethods disregard horizontal stress, include strip-footing bearing capacity theory, and neglect soil compressibility andstrain softening. The authors consider the indirect methodsless suitable for use in engineering practice and will notrefer to them further.Direct CPT methods more or less equate the measured coneresistance to the pile unit resistance. As detailed below, someof the methods use the cone sleeve friction in determining unitshaft resistance. Others proportion the shaft resistance to thecone resistance. Several methods modify the resistance valuesto the difference in diameter between the pile and the cone. Asopposed to the indirect methods, mean effective stress, soilcompressibility, and rigidity affect the pile and the cone in asimilar manner, which eliminates the need to supplement thefield data with laboratory testing and to calculate intermediatevalues, such as the earth pressure coefficient, Ks, and the bearing capacity coefficient, Nq.Fig. 2. New soil profiling chart.To relate the cone resistance to the pile unit toe resistance,current CPT methods determine the arithmetic average of theCPT data over an “influence zone.” Often, the test data include asmall amount of randomly distributed extreme values, “peaks andtroughs,” that may be representative for the response of the coneto the local soil characteristics, but not for a pile having a muchlarger diameter. Keeping the extreme values could result in anaverage that is not representative of the pile resistance at the site.Therefore, before averaging, it is common practice to manuallyfilter and smooth the data, either by applying a “minimum path”rule (Schmertmann 1978) or, more subjectively, by simply removing the peaks and troughs from the records.Current CPT direct methodsThe following direct methods, currently used in North Americanpractice, are considered: (i) Schmertmann and Nottingham,(ii) DeRuiter and Beringen (commonly called the Europeanmethod), (iii) Bustamante and Gianselli (commonly called theFrench method), (iv) Meyerhof, and (v) Tumay and Fakhroo.The Schmertmann and Nottingham method is based on a summary of the work on model and full-scale piles presented byNottingham (1975) and Schmertmann (1978). The unit toe resistance, rt, is taken as equal to the average of the cone resistanceover an influence zone extending from 6b to 8b above the piletoe, where b is the pile diameter, and 0.7b to 4b below the piletoe (see eq. [1]). The average is determined after first filtering theqc data to “minimum-path” values. Details on the filteringand minimum-path rules are given by Schmertmann (1978). Anupper limit of 15 MPa is imposed for the unit toe resistance.[1]rt COCR qcawhere rt is the pile unit toe resistance; COCR is the correlationcoefficient governed by the overconsolidation ratio, OCR, of thesoil; and qca is the arithmetic average of qc in an influence zone.The extent of the influence zone depends on the trend ofthe qc values and follows recommendations by Begemann 1997 NRC Canada
892Can. Geotech. J. Vol. 34, 1997(1963), who based the zone extent on an assumed logarithmicspiral failure pattern for the pile toe.The pile unit shaft resistance, rs, may be determined fromthe sleeve friction as expressed by [2]:[2]r s K fswhere K is a dimensionless coefficient. The K coefficient depends on pile shape and material, cone type, and embedmentratio. In sand, the K coefficient ranges from 0.8 to 2.0, and inclay it ranges from 0.2 to 1.25. Within a depth of the first eightpile diameters below the ground surface, the unit shaft resistance is linearly interpolated from zero at the ground surface tothe value given by [2].Alternatively, in sand, but not in clay, the shaft resistancemay be determined from the cone resistance:[3]rs C qcwhere C is a dimensionless coefficient, which is a function ofthe pile type and ranges from 0.8 to 1.8%. An upper limit of120 kPa is imposed on the unit shaft resistance, rs, whetherdetermined by [2] or [3]. For uplift capacity (tension resistance), the shaft resistance is reduced to 70% of that determined by [2] or [3].The European method (DeRuiter and Beringen 1979) isbased on experience gained from offshore construction in theNorth Sea. For unit toe resistance of a pile in sand, the methodis the same as the Schmertmann and Nottingham method. Inclay, the unit toe resistance is determined from total stressanalysis according to conventional bearing capacity theory asindicated in [4] and [5]:[4]rt Nc Su[5]Su qcNkwhere Nc is the conventional bearing capacity factor; Su is theundrained shear strength; and NK is a dimensionless coefficient,ranging from 15 to 20, reflecting local experience. An upper limitof 15 MPa is imposed for the unit toe resistance. Schmertmann(1978) also states, but without providing details, that the toeresistance value is governed by the overconsolidation ratio,OCR, of the soil.The unit shaft resistance in sand is determined by either [1]with K 1 or [2] with C 0.3%. In clay, the unit shaft resistancemay also be determined from the undrained shear strength, Su,as given in [6]:[6]rs α S uwhere α is the adhesion factor equal to 1.0 and 0.5 for normallyconsolidated and overconsolidated clays, respectively.An upper limit of 120 kPa is imposed on the unit shaftresistance. For tension capacity, the shaft resistance is reducedto 75% of the shaft resistance in compression.The French method (Bustamante and Gianeselli 1982) isbased on experimental work by Laboratoire Central des Pontset Chausees (LCPC). The sleeve friction, fs, is neglected andthe unit toe and unit shaft resistances are both determined fromthe average cone resistance, qc. Bustamante and Gianeselli(1982) provide detailed filtering rules for selecting the averagecone resistance. The unit toe resistance, rt, is estimated to rangefrom 40 to 55% of the average value of qc over a zone of 1.5babove and 1.5b below the pile toe (b is pile diameter).The unit shaft resistance is determined from [3] with the Ccoefficient ranging from 0.5 to 3.0%, as governed by the magnitude of the cone resistance, type of soil, and type of pile.Upper limits of the unit shaft resistance are imposed, rangingfrom 15 to 120 kPa depending on soil type, pile type, and pileinstallation method.The Meyerhof method (Meyerhof 1956, 1976, 1983) isbased on theoretical and experimental studies of deep foundations in sand. The unit toe resistance in sand is given by [7],and the influence of scale effect of piles and shallow penetrationin dense sand strata is considered by applying two modificationfactors, C1 and C2, to the qc average. The unit toe resistance ofa bored pile is reduced to 30% of that determined from [7]:[7]rt qca C1 C2where qca is the arithmetic average of qc in a zone ranging from4b above to 1b below the pile toe; C1 [(b 0.5)/2b]n is amodification factor for scale effect when b 0.5 m, otherwiseC1 1; C2 Db/10b is a modification for penetration into densestrata when Db 10b, otherwise C2 1; n is an exponent equalto 1 for loose sand, 2 for medium dense sand, and 3 for densesand; and Db is the embedment (in m) of the pile in dense sandstrata.The unit shaft resistance is determined from either [1] withK 1, or [2] with C 0.5%. For bored piles, reduction factorsof 70 and 50%, respectively, are applied to the calculated values of shaft resistance.The Tumay and Fakhroo method (Tumay and Fakhroo 1981)is based on an experimental study in clay soils in Louisiana.The unit toe resistance is determined the same way as in theSchmertmann and Nottingham method. The unit shaft resistance is determined according to [2] with the K coefficientdetermined according to [8], where the coefficient is no longerdimensionless:[8]K 0.5 9.5 e 0.09 fswhere the sleeve friction fs is measured in kPa.For a sleeve friction ranging from 10 to 50 kPa, [8] resultsin a K coefficient ranging from about 4.5 to 0.6. An upper limitof 60 kPa is applied to the unit shaft resistance, rs.Comments on the current methodsWhen using either of the five current direct CPT methods,difficulties arise as follows:(1) The CPT methods were developed more than a decade ago,therefore their calibration has not made use of the more accuratemeasurements achievable with modern cone penetrometers.(2) Although the recommendations are specified to soiltype (“clay” or “sand;” very cursorily characterized), the quotedmethods do not include a means for identifying the soil typefrom CPT data. Instead, the soil profile governing the coefficients relies on information from conventional boring andsampling, and laboratory testing, which may not be fullyrelevant to the CPT data.(3) All five CPT methods specify that extreme values beeliminated from the data, that is, they require the measurementsto be filtered. The filtering may cause the operator to unwittingly bias the results if, in removing the extremes, values that 1997 NRC Canada
893Eslami and Felleniusare representative of the pile–soil load transfer are also removed.(4) The CPT methods were developed before the advent ofthe piezocone and, therefore, neglect the pore pressure actingon the cone shoulder (Campanella and Robertson 1988). Thesubsequent error in the cone stress value is smaller in sand,larger in clay.(5) The CPT methods employ total stress values, whereaseffective stress governs the long-term behavior of piles.(6) The current CPT methods are locally developed, that is,they are based on limited types of piles and soils and may notbe relevant outside the local area.(7) The upper limit of 15 MPa, which is imposed on the unittoe resistance in the Schmertmann and Nottingham, European,and Tumay and Fakhroo methods, is not reasonable in very densesands where values of pile unit toe resistance higher than 15 MPafrequently occur. Except for the Meyerhof method, all of the CPTmethods also impose an upper limit to the unit shaft resistance,which cannot be justified because values of pile unit shaft resistancehigher than the recommended limits occur frequently.(8) All five CPT methods involve a judgment in selectingthe coefficient to apply to the average cone resistance used indetermining the unit toe resistance.(9) In the Schmertmann and Nottingham method and theEuropean method, the overconsolidation ratio OCR is used torelate qc to rt. However, although the OCR is often known inclay, it is not easily determined for sand.(10) In the European method, considerable uncertainty results when converting cone data to undrained shear strength,Su, and then using this Su value to estimate the pile toe capacity.The undrained shear strength is not a unique parameter anddepends significantly on the type of test used, strain rate, etc.Furthermore, drained soil characteristics also govern long-termpile capacity in cohesive soils. The use of undrained strengthcharacteristics for long-term capacity is therefore not justified.(11) In the French method, the 1.5b length of the influencezone below the pile toe is too short. (The influence zone is thezone above and below the pile toe over which the cone resistance is averaged.) For example, Meyerhof (1956, 1976) indicated that the length of the influence zone below the pile toemay extend to 10b. Altaee et al. (1992a, 1992b) reported a casewhere the depth was found to be 5b. The length of the zonebelow the pile toe is particularly important if a weaker layerexists near the pile toe, because the ability of the soil to resistthe pile toe load is reduced due to the development of horizontal tension in overlying dense soil.(12) The French method makes no use of sleeve friction,which disregards an important component of the CPT resultsand soil characterization.Obviously, the current methods leave something to be desired with regard to the estimation of pile capacity from conepenetrometer data. The advent of the piezocone has providedthe means for an improved method, and the authors have developed a new method based on CPTu measurements. Thedevelopment of the method necessitated a review of the approach toward the filtering of the cone data to account forvalues that are not representative for determining the coneresistance average. It has also been necessary to discuss thelength of the influence zone over which the representative qcvalue is to be determined.Cone resistance averageNatural soil deposits, particularly sands, produce cone resistance profiles with many peaks and troughs. The cone resistance variations reflect the variations of soil characteristics andstrengths. Therefore, when determining pile toe resistance,which is a function of the soil conditions in a zone above andbelow the pile toe, an average must be determined that is representative for the zone. It is important to note that the pilediameter controls the extent of
ventional laboratory testing are avoided. Moreover, it is not necessary to furnish intermediate parameters, such as earth pressure and bearing capacity coefficients, Ks and Nq. Because of similarities between the cone penetrometer and a pile, the penetrometer can be considered as a model pile. In fact, esti-