Transcription
Retinal Anatomy and Electrode Array Position inRetinitis Pigmentosa Patients After Argus IIImplantation: An International StudyNINEL Z. GREGORI, NATALIA F. CALLAWAY, CATHERINE HOEPPNER, ALEX YUAN,ALEKSANDRA RACHITSKAYA, WILLIAM FEUER, HOSSEIN AMERI, J. FERNANDO AREVALO,ALBERT J. AUGUSTIN, DAVID G. BIRCH, GISLIN DAGNELIE, SALVATORE GRISANTI, JANET L. DAVIS,PAUL HAHN, JAMES T. HANDA, ALLEN C. HO, SUBER S. HUANG, MARK S. HUMAYUN, RAYMOND IEZZI JR,K. THIRAN JAYASUNDERA, GREGG T. KOKAME, BYRON L. LAM, JENNIFER I. LIM, NARESH MANDAVA,SANDRA R. MONTEZUMA, LISA OLMOS DE KOO, PETER SZURMAN, LEJLA VAJZOVIC, PETER WIEDEMANN,JAMES WEILAND, JIONG YAN, AND DAVID N. ZACKS PURPOSE:To assess the retinal anatomy and array position in Argus II retinal prosthesis recipients. DESIGN: Prospective, noncomparative cohort study. METHODS: SETTING: International multicenter study.PATIENTS: Argus II recipients enrolled in the PostMarket Surveillance Studies. PROCEDURES: Spectraldomain optical coherence tomography images collectedfor the Surveillance Studies (NCT01860092 andNCT01490827) were reviewed. Baseline and postoperative macular thickness, electrode-retina distance (gap),optic disc–array overlap, and preretinal membrane presence were recorded at 1, 3, 6, and 12 months. MAINSupplemental Material available at AJO.com.Accepted for publication Jun 13, 2018.From the Bascom Palmer Eye Institute, University of Miami MillerSchool of Medicine, Miami, Florida, USA (N.Z.G., N.F.C., C.H., W.F.,J.L.D., S.S.H., B.L.L.); Cole Eye Institute, Cleveland Clinic, Cleveland,Ohio, USA (A.Y., A.R.); USC Roski Eye Institute, University ofSouthern California, Los Angeles, California, USA (H.A., M.S.H.,L.O.K.); The Wilmer Eye Institute, Johns Hopkins University School ofMedicine, Baltimore, Maryland, USA (J.F.A., J.T.H.); StädtischesKlinikum, Augenklinik, Karlsruhe, Germany (A.J.A.); RetinaFoundation of the Southwest, Dallas, Texas, USA (D.G.B.); LionsVision Research and Rehabilitation Center, The Wilmer Eye Institute,Johns Hopkins University School of Medicine, Baltimore, Maryland,USA (G.D.); University Eye Clinic Luebeck at the University HospitalSchleswig-Holstein, Lübeck, Germany (S.G.); Duke University EyeCenter, Durham, North Carolina, USA (P.H., L.V.); Wills EyeHospital, Thomas Jefferson University, Philadelphia, Pennsylvania,USA (A.C.H.); Retina Center of Ohio, Cleveland, Ohio, USA(S.S.H.); Mayo Clinic, Rochester, Minnesota, USA (R.I.); Kellogg EyeCenter, University of Michigan, Ann Arbor, Michigan, USA (K.T.J.,J.W., D.N.Z.); Retina Consultants of Hawaii, Aiea, Hawaii, USA(G.T.K.); University of Illinois at Chicago, Chicago, Illinois, USA(J.I.L.); University of Colorado, Aurora, Colorado, USA (N.M.);University of Minnesota, Minneapolis, Minnesota, USA (S.R.M.); EyeClinic Sulzbach, Knappschaft Hospital Saar, Sulzbach, Germany (P.S.);Klinik und Poliklinik für Augenheilkunde, UniversitätsklinikumLeipzig, Leipzig, Germany (P.W.); Emory Eye Center, Emory University,Atlanta, Georgia, USA (J.Y.); and USC Ginsburg Institute forBiomedical Therapeutics, Los Angeles, California, USA (M.S.H.).Lisa Olmos de Koo is currently at the University of Washington,Seattle, Washington, USA.Paul Hahn is currently at New Jersey Retina, Teaneck, New Jersey,USA.Inquiries to Ninel Z. Gregori, Bascom Palmer Eye Institute, 900 NW17th St, Miami, FL 33136; e-mail: ngregori@med.miami.edu0002-9394/ 36.00https://doi.org/10.1016/j.ajo.2018.06.012 2018PUBLISHEDOUTCOME MEASURES: Axial retinal thickness and axialgap along the array’s long axis (a line between the tackand handle); maximal retinal thickness and maximal gapalong a B-scan near the tack, midline, and handle. RESULTS: Thirty-three patients from 16 surgical sites inthe United States and Germany were included. Mean axialretinal thickness increased from month 1 through month12 at each location, but reached statistical significanceonly at the array midline (P [ .007). The rate of maximalthickness increase was highest near the array midline(slope [ 6.02, P [ .004), compared to the tack (slope [3.60, P .001) or the handle (slope [ 1.93, P [ .368).The mean axial and maximal gaps decreased over the studyperiod, and the mean maximal gap size decrease was significant at midline (P [ .032). Optic disc–array overlap wasseen in the minority of patients. Preretinal membraneswere common before and after implantation. CONCLUSIONS: Progressive macular thickening underthe array was common and corresponded to decreasedelectrode-retina gap over time. By month 12, the arraywas completely apposed to the macula in approximatelyhalf of the eyes. (Am J Ophthalmol 2018;193:87–99.Ó 2018 Published by Elsevier Inc.)THE ARGUS II RETINAL PROSTHESIS SYSTEM (SECONDSight Medical Products, Inc., Sylmar, California,USA) is the first U.S. Food and DrugAdministration–approved epiretinal implant that electrically stimulates the surviving inner retinal cells to inducevisual perception in patients with severe retinitis pigmentosa (RP) and bare light perception or no light perceptionin both eyes.1 RP causes a gradual destruction of photoreceptor cells; however, some bipolar, amacrine, and ganglioncells and their exons survive in these patients.1–4 The ArgusII prosthesis has been shown to provide the recipients withsome functional vision, useful in orientation and mobilitytasks, and improve quality of life.1,5,6The Argus II retinal prosthesis consists of external components the patient wears, namely a pair of glasses with aBYELSEVIER INC.87
camera on the bridge of the nose and a video processingunit (VPU), which sends a digitized signal to the implantin the eye.4 The implant contains an electrode array with60 200-mm platinum electrodes that deliver electrical stimulation to the surviving inner retina cells.4 The electrodearray is affixed to the macula with a spring-loaded titaniumtack. According to the surgeon’s manual, the array shouldbe centered over the fovea with electrodes oriented approximately 45 degrees diagonal to the horizontal meridian,aiming for either no overlap of the optic disc or overlapby the non-electrode portion of the array only.7 On thedistal end of the array, opposite to the tack, is a handle,which consists of a circular tubing used for surgical manipulation of the array. Each electrode has an associated stimulation threshold, which quantifies the current required forthe individual to perceive a phosphene.4Previously published studies have focused on the implant’s safety and efficacy. The landmark trial (Argus IIRetinal Stimulation System Feasibility Protocol,NCT00407602) followed 30 patients throughout theUnited States, Europe, and Mexico, and reported anacceptable adverse events profile and improved ability tolocalize large objects and movement presented on a computer screen and to perform daily functions in a majorityof patients up to 5 years after implantation.1 Other studieshave focused on factors that affect the perceptual thresholds. A significant correlation has been shown betweenstimulation threshold for perceiving phosphenes and theelectrode-retina distance.4There is, however, a paucity of data regarding changes inretinal anatomy after implantation, position of the electrode array relative to the retinal surface, and stability ofthe array position over time. A recent study of 18 eyes reported slight rotation of the array over time and variableelectrode-retina distance with a surgical procedure adaptedin France using scleral flaps and temporalis fascia autograft.Full apposition of the array was seen in a minority of patients.8 Position of the electrode array is dependent onthe patient’s anatomy, surgeon’s technique, and relativedifficulty in controlling the distance of the array from theretinal surface, especially in cases of high myopia orstaphyloma.8,9The goal of this collaborative effort was to evaluatethe spectral-domain optical coherence tomography (SDOCT) images of the Argus II recipients enrolled inPost-Market Approval studies in the United States andinternational sites in order to assess the retinal anatomyand the array position in these patients. Based on clinicalobservations, we tested the hypothesis that with time theretina thickens in many patients, and the array-retinadistance decreases, improving apposition of the array.This multicenter data analysis represents the largest longitudinal macular anatomy study in Argus II patients, andthe procured information would aid in surgical planning,follow-up, and the development of future implant modelswith the overarching goal of improving artificial vision for88patients with severe vision loss owing to outer retinaldegeneration.METHODSTHE CURRENT STUDY IS A COLLABORATIVE EFFORT OF THEUnited States and international surgical sites participatingin 2 of 3 Post-Market Surveillance Studies of the Argus IIretinal prosthesis, which are prospective, interventional,open-label protocols (ClinicalTrials.gov identifiersNCT01860092 and NCT01490827). The aim of the current analysis was to review the SD-OCT images collectedas part of Post-Market Surveillance Studies in order to evaluate the macular anatomy and electrode array position inthese patients. All investigators of the 3 Post-MarketApproval studies were invited, and only those centerswho agreed to participate in this collaborative analysiswere included (United States and German sites). Onlydata from patients who consented to participate in thePost-Market Surveillance Study in these centers wereincluded. All subjects included in the current study hadsigned a consent form to be enrolled in the Post-MarketSurveillance Study at their institution. Second Sight Medical Products, Inc provided access to de-identified imagescollected prospectively from baseline to month 12 after implantation as part of the Post-Market Study, which hadbeen approved as a prospective study by an institutional review board or ethics committee at each institution and wascompliant with the Health Insurance Portability andAccountability Act (HIPAA) or equivalent. All researchwas conducted in accordance with human subjects researchstandards and tenets of the Declaration of Helsinki.Images were accessed via Second Sight’s HIPAAcompliant, secure, encrypted account used in the PostMarket Surveillance Studies. The same SD-OCT (SpectralisOCT; Heidelberg Engineering, Inc, Heidelberg, Germany,or Cirrus OCT; Carl Zeiss Meditec Inc, Dublin, California,USA) was used to collect images at baseline and postoperatively for each individual patient. Retinal thicknessand electrode-retina distance (the electrode-retina gap)were measured using the caliper tool on the respectiveSD-OCT system software. Measurement protocol wasdesigned and de-identified OCT images were reviewed atthe Bascom Palmer Eye Institute and Cole Eye Institute.The following parameters were investigated during12 months after Argus II implantation: macular thicknesschanges; location (under or adjacent to the array) ofmacular thickening, if present; evolution of the retinaelectrode distance through 1 year after implantation;correlation of the retina-electrode distance with the axiallength; proximity of the array to the optic disc and thefrequency and degree of optic nerve overlap; prevalenceand characteristics of preretinal membranes before andafter implantation.AMERICAN JOURNAL OF OPHTHALMOLOGYSEPTEMBER 2018
Descriptive data were reviewed to study whether theretina was thickest under the array or outside of the array;how many eyes had retinal edema at baseline and howmany developed retinal thickening after implantation ofthe Argus II; how often the preretinal membranes were present at baseline and how frequently they developed afterimplantation; whether the membranes caused tractionaldetachment or array misalignment; and whether the presence of the optic nerve overlap caused any optic nerveswelling.A standardized approach to image evaluation and measurements was developed and strictly followed, as describedbelow. PREOPERATIVEMAXIMALMACULARTHICKNESS:Retinal thickness was measured as the distance from the inner retinal surface to the top of the hyperreflective layer under the retina, which anatomically represents the retinalpigment epithelium. Baseline maximal macular thicknesswas measured as the largest retinal thickness along aB-scan, in 3 locations: superior macula, foveal scan, andinferior macula. These locations approximated the locationof the tack, the array midline, and the handle as closelyas possible. Baseline maximal thicknesses at the superiormacula, through the fovea, and at the inferior maculawere compared to the maximal retinal thicknesses at thetack, midline, and handle, respectively at 1, 3, 6, and12 months post-implantation. POSTOPERATIVE AXIAL AND MAXIMAL MACULARTHICKNESS MEASUREMENTS: Postoperative SD-OCTs at1, 3, 6, and 12 months were analyzed. Retinal thicknesswas measured the same as preoperatively. The axial retinalthickness was measured on the best-quality OCT B-scantaken near the tack, the midline, and the handle at a pointwhere the B-scan intersected the long axis of the array(a line running from the tack to the handle, as shown inFigure 1). In addition, the maximal retinal thickness wasmeasured along these same B-scans in each of these 3 locations. It was documented whether the maximal measurement was located under the array and/or adjacent to thearray. For all follow-up visits, a B-scan at a similar locationwith respect to the array anatomy was measured. If no scanof acceptable quality or correct location was available at aparticular follow-up visit, no measurement was recorded tokeep measurements consistent between visits. MACULARTHICKENING: Macular thickening wasassessed as either present or absent at each follow-up visitby judging the appearance of retinal layers compared tobaseline and earlier postoperative visits, and the locationof thickening (quantified by the maximal macular thickness measurements) was documented as under the arrayand/or adjacent to the array. If the quality of the scan resolution under the array was sufficient, an attempt was madeto distinguish whether intraretinal fluid cysts were present.VOL. 193For all follow-up visits, a B-scan at a similar location waschosen at months 1, 3, 6, and 12. AXIAL AND MAXIMAL ELECTRODE-RETINA GAPMEASUREMENTS: The electrode-retina gap was defined asthe distance between the inner retinal surface and thelower hyperreflective surface of the array marked by theshadows under the electrodes. The axial gap was measuredon the same best-quality B-scans used for axial retinalthickness measurements near the tack, the midline, andthe handle at a point where the B-scan intersected thelong axis of the array (a line running from the tack to thehandle, Figure 1). In addition, the maximal gap under theelectrodes was measured on each of these B-scans atmonths 1, 3, 6, and 12. OPTIC DISC OVERLAP:The optic disc–to-array relationship was examined on the en face OCT images at eachfollow-up visit. Any presence or absence of optic nerveoverlap was noted.Among those with optic nerve overlap, the images werealso assessed to determine if the disc was overlapped by theelectrode-free polymer rim of the array (bumper) solely oralso by the electrodes. The images were evaluated for evidence of optic nerve swelling by inspecting the appearanceof the nerve rim on the en face images. PRERETINAL MEMBRANE EVALUATION:All availableB-scans through the array at each visit were evaluated todetect any preretinal membranes. When a preretinal membrane was identified, it was classified as focal vs diffuse.Diffuse was defined as a membrane present on 5 or morecontiguous B-scans. The membrane was also characterizedas completely adherent vs focally adherent—that is, separated from the inner retinal surface (off the retina), if anyseparation was seen on any B-scan. Finally, the locationof the preretinal membrane was described by quadrant(temporal, inferior, etc), hemifield if 2 contiguous quadrants, or diffuse if present in more than 2 macular quadrants, as much as possible, depending on the quality ofOCT images. STATISTICALanalysis wasANALYSIS: Statisticalperformed using SPSS Version 24.0 (IBM Corp, Armonk,New York, USA). A P value of .05 or less was consideredstatistically significant. The Generalized Estimating Equations models employing a first-order autoregressive correlation structure were used to assess changes in thickness andgap size over time.RESULTS BASELINE PARTICIPANT DATA:SD-OCT images of 33patients from 16 surgical sites located in the United StatesRETINAL ANATOMY AND ARRAY POSITION IN ARGUS II RECIPIENTS89
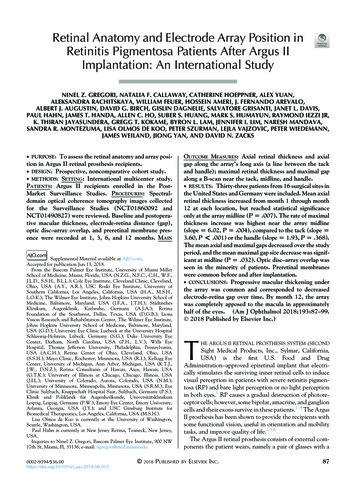
FIGURE 1. Measurement of Argus II optical coherence tomography (OCT) characteristics. (Top) En face OCT view of Argus IIretinal prosthesis implant (Second Sight Medical Products, Inc, Sylmar, California, USA) with B-scan near the tack (Top left),midline (Top middle), and handle (Top right). (Middle) Illustration of the Argus II implant from the surgeon’s manual labeledwith the tack, midline, handle, and the array’s long axis (red line) shown. The red line represents the long axis of the array usedto measure axial thickness and gap. (Bottom) An OCT B-scan near the handle demonstrates how axial and maximal retinal thicknessand electrode-retina gap were measured, and an example of an adherent preretinal hyperreflective membrane (asterisk *). The B-scancuts through the array diagonally and thus the handle is not visible. The A-scan through the array’s long axis is shown as a red verticalline. The blue line represents the axial macular thickness measurement. The yellow line represents the axial electrode-retina gap. Thepurple line shows the maximal retinal thickness along the B-scan. The pink line (indicated by the arrow) shows the maximal electroderetina gap along the B-scan. Measurements were taken using the Heidelberg software program.and Germany were reviewed from preoperative visitthrough month 12 after implantation, as available fromSecond Sight Medical Products, Inc. The baseline demographic information of participants is shown in Table 1.90SD-OCT images were available for review as follows: 28(85%) eyes had OCTs available at preoperative visit, 26(79%) patients had OCTs from at least 2 postoperativevisits, 17 (52%) patients had OCTs from at least 3 visits,AMERICAN JOURNAL OF OPHTHALMOLOGYSEPTEMBER 2018
TABLE 1. Baseline Demographics of ParticipantsCharacteristicResultNumber of participantsNumber of sitesSex, n (%)FemaleMaleMean age 6 SD at time ofimplantation, years [Range]Laterality of implant, n (%)Right eyeLeft eyeMean axial length (mm) 6 SD [Range]3316 MACULAR10 (30%)23 (70%)63 6 10 [46–88]19 (58%)14 (42%)23.2 6 1.0 [21.8–25.9]SD ¼ standard deviation.and 9 (27%) patients had OCTs from all 4 postoperativevisits. AXIAL MACULAR THICKNESS ALONG THE ARRAY’SLONG AXIS: In order to assess the macular thickness evolu-tion under the array, the axial macular thicknesses alongthe long axis of the array, a line between the tack andthe handle, were explored with spaghetti plots for each patient (data not shown), boxplots (Figure 2), and the meanaxial thickness measurements near the handle, midline,and tack at different follow-up points (Table 2). Spaghettiplots and boxplots of the measurements at different followup points demonstrate a high variability between patientsat each location (Figure 2). The median values in theboxplots are indicated by the horizontal line in the boxesencompassing data points in the 25th to the 75th quartiles.The median values remained fairly unchanged at the tackand the handle; however, they steadily increased at midlinefrom month 1 through month 12. These findings werecorroborated by the mean axial macular thicknesses(Table 2), which increase from month 1 through month12 at each location, but reached statistical significanceonly at the array midline (P ¼ .007). MAXIMAL MACULAR THICKNESS BY LOCATION:Themaximal macular thicknesses near the tack, the midline,and the handle levels were measured along the sameB-scan used to assess the axial macular thickness at theselocations. Evolution of the maximal macular thicknessafter implantation was explored by spaghetti plots foreach patient (data not shown), boxplots (Figure 3), andthe mean maximal thicknesses at the handle, midline, andtack at different follow-up points (Table 2). The spaghettiplots and boxplots show large variability between patients.The median maximal macular thickness, represented bythe horizontal line within boxes, increased from baselinethrough month 12 at each location, especially near thearray midline (Figure 3). The mean maximal macularthicknesses increased from baseline at each location, andVOL. 193reached statistical significance near the tack (P .001)and midline (P ¼ .004, Table 2). The rate of maximalthickness increase was highest near the array midline(slope ¼ 6.02, P ¼ .004), compared to the tack (slope ¼3.60, P .001) or the handle (slope ¼ 1.93, P ¼ .368).THICKENING: Macular thickening wasassessed as either present or absent at each follow-up visitby judging the appearance of retinal layers compared tobaseline and earlier postoperative visits. Based on theappearance of the retinal layers and presence of cysticchanges, 6 eyes out of 28 available baseline OCTs(21.4%) were classified as having macular edema prior toimplantation. Five of 6 eyes had diffuse thickening (ie, present on more than 5 contiguous scans). After implantation,the macula appeared thickened in 11 of 21 (52%) eyes atmonth 1, 19 of 27 (70%) eyes at month 3, 13 of 19(68%) eyes at month 6, and 16 of 18 (89%) eyes at month12. To determine whether the retina thickened only underthe array or also adjacent to the array, the location of themaximal macular thickness was recorded as under the arrayor outside, adjacent to the array in each OCT analyzed.Over the study period, the retina was thickest under thearray in the majority of eyes (73%–96%); however, in upto a quarter of OCTs, namely 4%–27% of eyes (dependingon the follow-up time point), the retina was thickest adjacent to the array, mostly in the nasal macula where theretina is naturally thicker than within the central maculaat baseline, or where the array seemed to press on the adjacent retina, causing it to heap up immediately adjacent tothe array edge, a ‘‘snowplow effect’’. Resolution of manyOCT scans was poor under the array, making it difficultto assess for the presence of cysts; thus these data are notreported. Almost none of the scans with adequate resolution showed cystic changes, but the retina appeared boggy.This was consistent throughout 12 months, with no specifictrend noted at any location along the array. ELECTRODE-RETINA GAP:In order to assess the distance between the electrodes and the inner retina, theelectrode-retina gap measurements were taken along thearray’s long axis near the tack, midline, and handle. Inaddition, the maximal gap measurements under the electrodes along the same B-scan near the tack, midline, andhandle were recorded (Table 3). The boxplots demonstrate variability between eyes in the axial and maximalgap measurements (Figures 4 and 5). Along the longaxis, the median axial gap was zero at all follow-up pointsnear the tack and handle, while the median gap atmidline was 165 mm at month 1 and steadily decreasedto zero by month 12 (Figure 4). The median maximalelectrode-retina gap was under 100 mm near the tackand the handle at month 1 and zero at other time points(Figure 5). The median maximal gap at midline was214 mm at month 1 and steadily decreased to 40 mm bymonth 12 (Figure 5).RETINAL ANATOMY AND ARRAY POSITION IN ARGUS II RECIPIENTS91
FIGURE 2. Axial macular thicknesses along array’s long axis by location through month 12 after Argus II implantation. Boxplotswith Tukey’s quartiles are shown for the tack (Left), midline (Center), and handle (Right) with the measured retinal thickness inmicrometers along the array’s long axis during postoperative months 1, 3, 6, and 12. The median value is indicated by the horizontalline in the box encompassing data points in the 25th to the 75th quartiles. The median values remained fairly unchanged at the tackand the handle, but steadily increased at midline from month 1 through month 12. The x-axis represents months after surgery; they-axis represents thickness in micrometers (mm).TABLE 2. Axial and Maximum Macular Thickness by Array Location Through Month 12 After Argus II ImplantationTackMidlineHandleVisitMean AxialThickness AlongLong Axis, mm (SD)Mean MaximalThickness AlongB-Scan, mm (SD)Mean AxialThickness AlongLong Axis, mm (SD)Mean MaximalThickness AlongB-Scan, mm (SD)Mean AxialThickness AlongLong Axis, mm (SD)Mean MaximalThickness AlongB-Scan, mm (SD)Baselinea [n]POM1 [n]POM3 [n]POM6 [n]POM12 [n]Slopeb (SE)P value200.1 (73) [14]216.1 (74) [16]222 (71.7) [13]233.3 (53.5) [9]0.95 (1.68).573230.9 (59.8) [20]227.5 (60.7) [16]272.8 (88.8) [16]254.4 (64.7) [13]279.9 (35.3) [9]3.60 (0.81) .001*216.4 (96.2) [16]265.5 (98.9) [25]289.3 (124.7) [16]355 (144) [14]7.79 (2.91).007*236.5 (51.5) [23]269.3 (85.4) [16]290.4 (89.2) [25]337.5 (118) [16]389.4 (134.4) [14]6.02 (2.08).004*220.3 (60.7) [15]249.6 (97.8) [18]248.7 (102.5) [15]266 (102.8) [14]0.25 (1.63).881233.8 (46.4) [19]266.1 (79.4) [16]280.4 (97.5) [19]302.3 (114.6) [15]317.2 (96.2) [14]1.93 (2.14).368POM ¼ postoperative month; SD ¼ standard deviation; SE ¼ standard error.Statistically significant P values are indicated by an asterisk (*).aFor baseline maximal retinal thickness the maximal thickness along B-scan in the superior macula (ie, near tack), through the fovea (ie, neararray midline), and in the inferior macula (ie, near handle) were measured.b(mm/month) Generalized Estimating Equations model accounting for correlated measurements on the same subjects with visit months fittedas a linear covariate (excluding baseline) with identity link and correlation structure modeled as AR1.The majority of eyes had complete touch of the electrodes and the retina (zero gap) at the tack and the handle(Table 4). The percentage of eyes with zero axial andmaximal gap increased significantly across the follow-upvisits at the midline but not at the tack or the handle,which corresponds to the significant macular thickeningat array midline seen postoperatively. While the meanaxial and maximal gaps decreased over the study period,the decrease in mean maximal gap size at midline was theonly significant trend observed (P ¼ .032, Table 3).A negative correlation between the electrode-retina gapchange and macular thickness change along long axis of thearray was observed from month 1 to month 3 (n ¼ 11,r ¼ 0.69, P ¼ .019), from month 1 to month 6 (n ¼ 10,92r ¼ 0.79, P ¼ .007), and from month 1 to month 12(n ¼ 9, r ¼ 0.83, P ¼ .006). CORRELATION OF ELECTRODE-RETINA GAP WITHAXIAL LENGTH AND TACK APPEARANCE: Axial lengthranged from 21.8 mm to 25.9 mm, with a median of23.2 mm. Axial length was not correlated with large maximalgap. Axial lengths as small as 22.0 mm and as large as25.91 mm were represented among the eyes with a maximalgap larger than 150 mm and larger than 200 mm at anylocation. Moreover, the 22.0 mm eye had larger gaps at thetack, midline, and handle than the 25.91 mm eye.Out of 10 eyes with the maximal electrode-retina gap of150 mm or more at the midline or the handle at month 1, 5AMERICAN JOURNAL OF OPHTHALMOLOGYSEPTEMBER 2018
FIGURE 3. Maximal macular thicknesses along the b-scan by location through month 12 after Argus II implantation. Boxplots withTukey’s quartiles are shown for the tack (Left), midline (Center), and handle (Right) with the maximum retinal thickness along theB-scan measured in micrometers at postoperative months 1, 3, 6, and 12. The median value is indicated by the horizontal line in thebox encompassing data points in the 25th to the 75th quartiles. The x-axis represents months after surgery; the y-axis representsthickness in micrometers (mm).TABLE 3. Mean Axial and Mean Maximal Electrode-Retina Gap by Array Location Through Month 12 After Argus II ImplantationTackVisitPOM1 [n]POM3 [n]POM6 [n]POM12 [n]Slope (SE)P valueaMidlineHandleMean AxialGap Along LongAxis, mm (SD)Mean MaxGap AlongBScan, mm (SD)Mean AxialGap Along LongAxis, mm (SD)Mean MaxGap AlongBScan, mm (SD)Mean AxialGap Along LongAxis, mm (SD)Mean MaxGap AlongBScan, mm (SD)73.7 (131.8) [15]39.8 (85.8) [16]28.2 (51.5) [13]60.6 (119.4) [9] 0.75 (0.87).39386.9 (107.8) [14]59.1 (110) [16]47.5 (79.2) [13]76.0 (124.8) [9] 0.22 (2.41).927167 (156.8) [16]116.2 (140.9) [25]72.6 (107.1) [16]87.0 (150.7) [14] 3.84 (2.41).111188.1 (163.6) [16]149.8 (148.6) [25]98.7 (114.8) [16]116.5 (146.7) [14] 4.84 (2.26).032*66.1 (79.9) [15]52.5 (84.9) [18]49.9 (84.7) [15]62.7 (80.6) [14] 0.14 (2.12).948154.5 (152.1) [15]88.8 (115.3) [19]78.7 (110) [15]91.8 (99.5) [14] 2.92 (2.91).315POM ¼ postoperative month; SD ¼ standard deviation; SE ¼ standard error.Statistically significant P values are indicated by an asterisk (*).a(mm/month) Generalized Estimating Equations model accounting for correlated measurements on the same subjects with visit months fittedas a linear covariate (excluding baseline), with identity link and correlation structure modeled as AR1.had zero axial gap at the tack (ie, no separation between thearray and the retina at the tack). Interestingly, 3 of these 5eyes had a large maximal gap of 85, 108, and 185 mm nearthe tack at month 1, indicating a degree of tilt of the arrayaround the long axis. The 5 remaining eyes demonstratedtack gaps between 32 and 395 mm at month 1. The eyewith a 395-mm gap at the tack had the largest axial gapand maximal gap at the midline (both 483 mm). Twoeyes had a steep curvature of the macula but axial lengthsof 24.2 and 23.7 mm and no obvious staphyloma on preoperative examination, with a large maximal electrode-retinagap of 433 and 483 mm at the midline, respectively(Figure 6, Middle right). Thus, it appears that in someeyes incomplete tacking was responsible for the largeelectrode-retina gap, and in o
the Bascom Palmer Eye Institute and Cole Eye Institute. The following parameters were investigated during 12 months after Argus II implantation: macular thickness changes; location (under or adjacent to the array) of macular thickening, if present; evolution of the retina-electrode distance through 1 year after implantation;