Transcription
TECHNICAL REPORT:INCREASING CIRCADIAN LIGHT EXPOSUREIN OFFICE SPACESHARRY S. TRUMAN BUILDING2210 C STREET NW, WASHINGTON, DCU.S. DEPARTMENT OF STATE BUILDING SA-12401 E STREET NW, WASHINGTON, DCU.S. DEPARTMENT OF STATE BUILDING SA-17600 19TH STREET NW, WASHINGTON, DCSUBMITTED: DECEMBER 1, 2017REVISION: JANUARY 3, 2018REVISION 2: FEBRUARY 2, 2018LIGHTING RESEARCH CENTER, RENSSELAER POLYTECHNIC INSTITUTE21 UNION STREETTROY, NY 12180WWW.LRC.RPI.EDU
Increasing Circadian Light Exposure in Office Spaces, Final Technical Report; Submitted December 1, 2017(revised January 3, 2018, and February 2, 2018)B ACKGROUNDTECHNICAL REPORTLight can have at least 2 effects on humans. First, it synchronizes or entrains thebiological clock to the local time on Earth. Second, light elicits an acute alerting effectfrom people that, similar to the effect of a cup of coffee, can help a person feel lesssleepy, improve reaction times, and reduce attention lapses on certain tasks. The LightingResearch Center at Rensselaer Polytechnic Institute (LRC) developed a metric, circadianstimulus (CS), which is related to the type of light (i.e., its spectrum) and the amount oflight needed to affect the human circadian system, as measured by acute melatoninsuppression. CS is a measure of the effectiveness of the retinal light stimulus for thehuman circadian system from threshold (CS 0.1) to saturation (CS 0.7). Studies havelinked this metric to better circadian synchronization or entrainment as well as greatersubjective and objective alertness in people.1,2 The human circadian clock, in the absenceof any external cues, free-runs with a period that is slightly greater than 24 hours(averaging 24.2 hours). Morning light advances the timing of the biological clock,resulting in earlier bedtimes and earlier morning wake times. Late afternoon/eveninglight, conversely, delays the timing of the biological clock, resulting in earlier bedtimesand earlier morning wake times. Although light in the middle of the day has some effecton the timing of the biological clock, that effect is attenuated compared to light receivedat other times of day.Given that the biological clock’s period is longer than the solar day, humans requireexposure to morning light (high CS) for maintaining proper entrainment with the localtime on Earth. Lack of entrainment, resulting from insufficient exposure to morning CSor excessively high CS in the evening or night, can lead to poor sleep, higher depressionrates, higher stress, and other maladies. In the laboratory, the CS metric has been used topredict melatonin suppression from self-luminous devices,3 and in the field, it has beenused to predict entrainment in nuclear submariners4 as well as sleep quality and mood inoffice workers5 and persons with Alzheimer’s disease living in senior facilities.6 In thesestudies, entrainment was operationally defined in many ways, such as better and longersleep at night, reduced sleep onset latency, lower sleep disturbances scores, and highermelatonin levels at night.In addition to promoting entrainment, light can also elicit an acute, immediate alertingeffect from people at any time of day or night. Earlier studies have demonstrated that theacute alerting effect of light was related to light’s ability to suppress the hormonemelatonin at night. It is now known that high levels of white light as well as low levels ofshort-wavelength light, both delivering high CS, are effective for increasing alertness atnight as well as during the day, when melatonin levels are low, suggesting that othermechanisms are important for alertness in addition to melatonin suppression.1,2,5,7 TheLRC has demonstrated in a series of laboratory studies8,9 that alertness can also beelicited by exposure to long-wavelength (red) light, which delivers very low levels of CSand is very effective for promoting alertness during the post-lunch dip. Red light at thesame photopix lux at the eye was just as effective as a 470-nm (blue) light at elicitingalertness. (As the CS metric is based on the spectral sensitivity of melatonin suppression,which is maximally sensitive to short-wavelength [blue] light and minimally sensitive tolonger wavelength red light, the amount of CS provided by red light is low. In otherwords, red light is less effective than blue light for suppressing nocturnal melatonin levelswhile nonetheless having an alerting effect.) In these studies, alertness was operationally2
Increasing Circadian Light Exposure in Office Spaces, Final Technical Report; Submitted December 1, 2017(revised January 3, 2018, and February 2, 2018)defined in terms of reaction times, electroencephalogram measurements, and selfreported scores for the Karolinska Sleepiness Scale (KSS)10 and Subjective Vitality Scale(SVS)11 measures.The U.S. General Services Administration (GSA) and the LRC have completed 3 fieldstudies in 9 federal office buildings. In the first field study, the LRC and GSAinvestigated the relationship between exposure to morning (8:00 a.m. to 12:00 p.m.) andall-day (8:00 a.m. to 5:00 p.m.) circadian-effective light (CS 0.3) and its effect onoffice workers’ sleep and mood in 5 federal office buildings (Grand Junction, CO,Portland, OR, Seattle, WA, and 2 in Washington, DC).5 Originally, we hypothesized thatbuildings with more daylight availability would deliver higher CS to workers. One of themain lessons learned from that study was that workers’ behavior, combined witharchitectural and interior design features, occluded and reduced daylight penetration inmany spaces. Since not all of the spaces in these buildings had access to daylight,supplemental electric lighting solutions would be needed to achieve the desired CS.The second phase of this research tested a couple of electric lighting solutions that weredesigned to enhance CS at individual workstations with limited access to daylight. Thestudy’s second phase was conducted in 2 federal office buildings (in White RiverJunction, VT, and McLean, VA)12 and in 2 U.S. embassies (in Reykjavik, Iceland, andRiga, Latvia) in geographic locations with limited daylight during the winter.13 The LRCteam developed and installed desktop luminaires designed to deliver a CS 0.3. Thescope of this second phase was smaller than the first, and focused on whether the lightingintervention could increase the alertness and vitality of office workers during the daywhile at work. A total of 36 workers from the 2 U.S. office buildings participated in thestudy during the summer, with 26 workers repeating the study in the fall. In the 2embassies, which are located in higher latitudes (Reykjavik at 64.1º N, Riga at 56.9º N), atotal of 32 workers participated during the winter only.The Phase 1 results showed that compared to office workers who received low levels ofcircadian-effective light (CS 0.15) in the morning (i.e., before 12:00 p.m.), those whoreceived high levels (CS 0.3) in the morning fell asleep faster at night (especially inwinter), experienced better sleep quality, and had overall lower levels of depression. Highlevels of circadian-effective light received during the entire workday (i.e., 8:00 a.m. to5:00 p.m.) were also associated with reduced depression and increased sleep quality.5Initially, these studies focused on determining whether daylight would deliver the desiredCS to office workers, but the results suggested that, as currently designed andimplemented in the 5 buildings, daylight alone was insufficient and that electric lightingwas required to achieve the desired CS at the workers’ eyes. The Phase 2 results showedthat self-reported measures of daytime sleep and the self-reported measures of daytimevitality, alertness, and energy increased with the lighting intervention.G OAL OF THE P RESENT S TUDYThe goal of this follow-up research was to evaluate whether a lighting interventiondesigned to deliver morning CS to promote entrainment and afternoon red light topromote alertness would increase nighttime sleep quality (the focus of Phase 1) anddaytime alertness (the focus of Phase 2) in participants recruited from 3 U.S. Departmentof State (DOS) facilities. It was hypothesized that a CS 0.3 during the morning hourswould provide sufficient circadian stimulation to promote entrainment and alertnesswhile red light would promote afternoon alertness. Unlike the previous study, which ran3
Increasing Circadian Light Exposure in Office Spaces, Final Technical Report; Submitted December 1, 2017(revised January 3, 2018, and February 2, 2018)for 3 consecutive days, the current study ran during 3 consecutive weeks. It is knownfrom the literature that it takes a few days for circadian phase shifting to occur. Alsounlike the previous studies, red light, which has low CS, was used to promote alertnessduring the afternoon. The reason for using low CS in the afternoon was because high CSin the late afternoon may induce a phase delay and, to maintain entrainment, humansneed to phase advance (or receive greater CS exposure in the morning than in theevening). Specifically, the research addressed 3 primary hypotheses:1.2.3.Morning blue light (CS 0.3) will phase advance the clock and promotecircadian entrainment. Because humans have a biological clock that runs with aperiod slightly greater than 24 hours, we need morning light to advance theclock and promote entrainment; participants will go to bed earlier and their sleeponset latency (i.e., the length of time that elapses between wakefulness beforebed and sleep) will be reduced.Morning blue light (CS 0.3) will elicit an acute alerting effect fromparticipants, reducing subjective sleepiness and increasing subjectivevitality/energy scores at noon.Afternoon red light will elicit an acute alerting effect from participants, reducingsubjective sleepiness and increasing subjective vitality/energy scores in theafternoon, especially at 3:00 p.m., close to the time of the post-lunch dip.14,15The saturated red light intervention was selected for the afternoon to provide analerting stimulus while avoiding excessive CS exposure in the latter part of theday, thereby preventing the delay of circadian phase.M ETHODOLOGYP ARTICIPANT R ECRUITMENTThe DOS agreed to participate in this study and recruited workers from 3 of theirfacilities: the Harry S. Truman Building (HST), Building SA-1 (SA-1), and Building SA17 (SA-17), all located in Washington, D.C. (Table 1). LRC and GSA personnelconducted an informational session at DOS to recruit study participants. There were noexclusion criteria for participation. Interested volunteers were enrolled in the study by theDOS immediately after the information session. Twenty participants were enrolled, butone of them (#610 at SA-1) has been excluded from the study’s results pendingconfirmation of compliance with the intervention.Table 1. Summary of Demographic Data for Participants in this Study, by Site.GenderAge(years)aMale(n)Female(n)TotalHarry S. Truman Building44.8 14.551116U.S. Department Of State Building SA-157.5 2.1112U.S. Department Of State Building SA-1750.0 7.0112All sites46.7 13.571320SiteNote: a Mean standard deviation (SD).After enrollment, LRC, GSA, and DOS staff visited each of the volunteer participants toinstall the lighting intervention on their desks and deliver a package containing a4
Increasing Circadian Light Exposure in Office Spaces, Final Technical Report; Submitted December 1, 2017(revised January 3, 2018, and February 2, 2018)Daysimeter, an actigraph, and 5 questionnaires. An LRC researcher explained theprotocol again, obtained consent forms, and answered any questions. One employee fromeach location served as the on-site point of contact, and they collected the sealed packagecontaining the study materials from the participants at the end of the study.Data were collected from 2 participant cohorts over 2 separate 3-week sessions, the firstoccurring from September 25, 2017, to October 13, 2017, and the second occurring fromOctober 16, 2017, to November 3, 2017. Of the 20 participants in the study, 16participants (11 females) volunteered from the HST site, 2 (1 female) volunteered fromthe SA-1 site, and 2 (1 female) volunteered from the SA-17 site (Table 1).M EASUREMENT P ROCEDURESDEVICESThe Daysimeter, a calibrated light-measuring device and activity monitor developed bythe LRC,16 was used to collect personal light and activity data from the participants. TheDaysimeter is calibrated in terms of both orthodox photopic illuminance (lux) andcircadian illuminance (CLA). CLA calibration is based upon how the human circadiansystem responds to light. From the recorded CLA values, it is then possible to determinethe magnitude of CS, which is a measure of a light source’s effectiveness for stimulatingthe circadian system as measured by its ability to acutely suppress the body’s productionof melatonin.17,18 Participants wore the Daysimeter from when they woke up in themorning until they went to bed at night to measure their CS exposure during wakinghours. Participants were asked to remove the Daysimeter when going to bed, and it is notknown whether they performed activities such as using self-luminous displays beforefalling asleep. It should be noted, however, that we assumed that the participants wouldnot substantially change their behavior before bed from week to week, so this washypothesized to be constant during the study period.Participant’s rest–activity patterns were measured via actigraphy (Philips ActiwatchSpectrum Plus, Philips Respironics, Bend OR), which was recorded 24-hours/day duringWeeks 1 and 3 of the study, excluding weekends (see Protocol, below). The Actiwatch,worn in the wrist, is equipped with a highly sensitive accelerometer that measures users’activity or lack thereof, and records when (and for how long) the device has beenremoved.Using data from the actigraphy and the software developed by the device’s manufacturer,the following sleep measures were obtained: (1) sleep start time (time of day); (2) sleepend time (time of day); (3) sleep onset latency, or the length of time that elapses betweenwakefulness before bedtime and sleep (in minutes); (4) sleep efficiency, or the proportionof time spent in bed while actually asleep (percentage); (5) sleep time, or the time thatelapses between falling sleep and waking up (in minutes); and (6) wake time, or theamount of time momentarily spent awake after falling asleep and waking up for the nextday (in minutes).Sleep start time was calculated using the participants’ event diary (time to bed and timeto wake) and the actigraph’s detection of low activity and low light levels for durationsthat are 3 hours. After this period was defined, the proprietary software automaticallydetected the time spent asleep within the rest period.Sleep end time was calculated using the participants’ event diary (time to bed and time towake) and 2 actigraphy measures: increases in activity level (indicated on the actogram’ssolid wake bar) and increases in light level above 1.0 μW/cm2. The light level in this case5
Increasing Circadian Light Exposure in Office Spaces, Final Technical Report; Submitted December 1, 2017(revised January 3, 2018, and February 2, 2018)was recorded by the actigraph under the assumption that, because participants would bewearing the device during sleep, light levels would be low while they were in bed.Sleep onset latency is the time required to fall asleep after initiating the intent to sleep. Inother words, it is the elapsed time between the start of a given rest interval and the sleepinterval start time.Sleep efficiency is indicated by the percentage of time spent in bed sleeping. It is basedon total sleep time divided by interval duration minus total invalid time (sleep–wake) ofthe given rest interval multiplied by 100.Sleep time is calculated from the total number of epochs for the given interval scored assleep by the Actiware software, multiplied by the epoch length.Wake time is the total number of epochs between the start time and end time of a giveninterval scored as awake by the Actiware software.The actigraph data were also used to calculate interdaily stability (IS) and intradailyvariability (IV).19 The IS ratio quantifies the extent to which all recorded 24-hour activityprofiles resemble each other, which represents the day-by-day regularity of the sleep–wake pattern. Higher IS ratios indicate better interdaily stability. The IV ratio quantifiesthe fragmentation of the rhythm, or the frequency and extent of transitions betweenperiods of rest and activity. Lower IV ratios indicate better intradaily variability.Finally, the actigraph data were used to calculate activity acrophase (i.e., the tendency ofthe peak of the activity rhythm), which is the phase angle of a cosine fit to the actigraphactivity data using the method of least squares.20 This measure reports results as the timeof day at which activity was at its maximum. Activity acrophase is a measure of circadianphase (or circadian timing). An earlier acrophase suggests a phase advance of thecircadian clock because peak activity occurred earlier in the day. In the present study,given that the participants were receiving high CS in the morning, at a time when lightadvances the circadian clock, we expected their acrophase to occur earlier in the day afterthe intervention.Q U E S TI O N N A I RE SParticipants completed a series of questionnaires inquiring about sleep habits (PittsburghSleep Quality Index [PSQI] and Karolinska Sleepiness Scale [KSS]) and subjectivefeelings of stress (Perceived Stress Scale [PSS-10]), depression (Center forEpidemiologic Studies Depression Scale [CES-D]), and vitality and alertness (SubjectiveVitality Scale [SVS]). The schedule for participants’ completion of the questionnaires canbe found in Protocol, below. These questionnaires were selected because they have beenused to probe participants’ subjective sleepiness, vitality, and energy levels in previousstudies.The PSQI questionnaire21 is a subjective measure of sleep quality and patternsexperienced by participants for the majority of days and nights over the past month. Itmeasures sleep quality from responses in 7 areas: subjective sleep quality, sleep latency,sleep duration, sleep efficiency, sleep disturbance, use of sleep medication, and daytimedysfunction. Answers are scored on a scale ranging from 0 to 3, and the questionnaireyields a single global score. A global score 5 indicates a poor sleeper. The PSQIquestionnaire was completed once at the beginning of the baseline week and once againat the end of the study.6
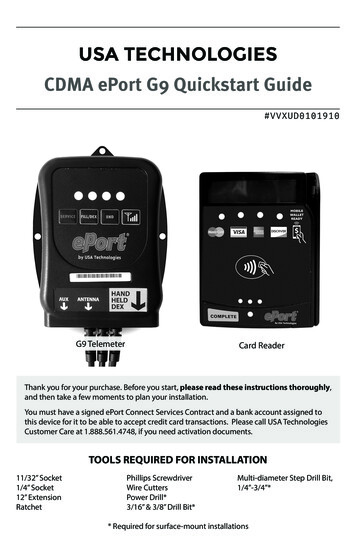
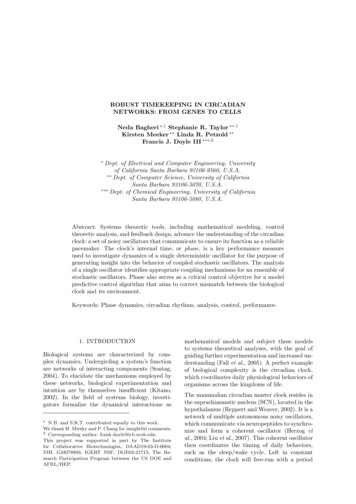
Increasing Circadian Light Exposure in Office Spaces, Final Technical Report; Submitted December 1, 2017(revised January 3, 2018, and February 2, 2018)The KSS questionnaire10 is a subjective measure of sleepiness that assesses participants’present state on a 9-point scale ranging from 1 (“extremely alert”) to 9 (“very sleepy,great effort to keep awake, fighting sleep”). The KSS questionnaire was completed 4times per day (upon arrival and at 12:00 p.m., 3:00 p.m., and departure) on each day ofthe baseline week and the second intervention week (Week 3).The CES-D questionnaire22 is designed to measure depressive symptoms. This 20-itemtest measure asks how often over the past week participants experienced symptomsassociated with depression, such as restless sleep, poor appetite, and feelings ofloneliness. Response options range from 0 to 3 for each item (0 rarely or none of thetime, 1 some or little of the time, 2 moderately or much of the time, 3 most oralmost all the time). Total scores range from 0 to 60, with scores 16 indicating greaterdepressive symptoms. The CES-D questionnaire was completed once at the beginning ofthe baseline week and once again at the end of the study.The PSS-10 questionnaire23 assesses participants' thoughts and feelings over the pastmonth by posing 10 questions concerning how often they have thought or felt a specificway. Answers are scored on a 5-point scale ranging from 0 (never) to 4 (almost always).Total scores 20 are considered to indicate high stress. The PSS-10 questionnaire wascompleted once at the beginning of the baseline week and once again at the end of thestudy.The SVS questionnaire11 assesses participants' perceptions of feeling alive, vital,energetic or energized, alert, awake, and optimistic “at the present time.” Participants’responses to 7 individual statements were scored on a 7-point scale ranging from 1 (not atall true) to 7 (very true). The SVS questionnaire was completed 4 times per day (uponarrival and at 12:00 p.m., 3:00 p.m., and departure) on each day of the baseline week andthe second intervention week (Week 3).L IGHT ING I NTERVENTIOND E S K TO P L U M I N A I RE SThe LRC developed and built 20 plug-in LED luminaires for mounting on desktops nearparticipants’ computer monitors. The luminaires were designed to deliver saturated bluelight in the morning (6:00 a.m. to 12:00 p.m.), white light at midday (12:00 p.m. to 1:30p.m.), and saturated red light in the afternoon (1:30 p.m. to 5:00 p.m.) (Figure 1).Transitions between each of the lighting modes were accomplished in 1 minute. Theluminaire automatically turned off at 5:00 p.m. and remained off until 6:00 a.m. the nextday. The specifications for the 3 lighting interventions are shown in Tables 2 and 3, andtheir spectral power distributions are shown in Figure 2.Figure 1. The luminaire designed for the study, showing its 3 lighting modes.7
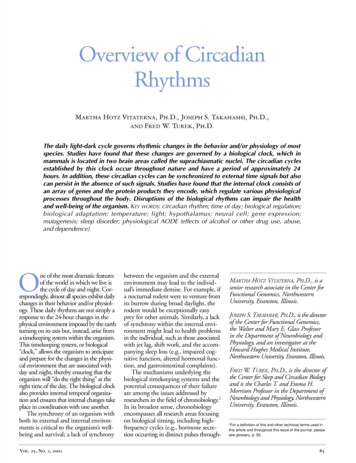
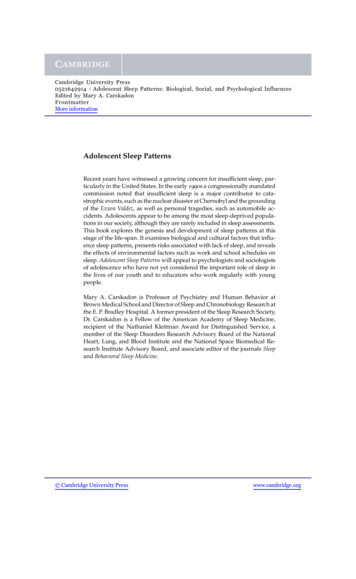
Increasing Circadian Light Exposure in Office Spaces, Final Technical Report; Submitted December 1, 2017(revised January 3, 2018, and February 2, 2018)Table 2. Schedule and specifications for the lighting interventions used in this study.Note that for the white light intervention, a higher light level was required toachieve the criterion CS value 0.3 compared to the saturated blue lightintervention.Time of 0.406:00 a.m. to 12:00 p.m.12:00–1:30 p.m.white (6500 K)n/a2000.301:30–5:00 p.m.red634500Table 3. Calculations of the five α-opic irradiances a and equivalent melanopic lux forthe 3 lighting interventions, following the SI-compliant approach recommended bythe International Commission on Illumination e(μW/cm2)Equivalentmelanopiclux Note: (a) Based upon the spectral irradiance distributions of the light sources, α-opic irradiances are calculatedusing the CIE TN 003:2015 proposed SI-complaint version of the Lucas et al. 24 toolbox, which is available as afreely downloadable electronic document (http://files.cie.co.at/784 TN003 Toolbox.xls).Figure 2. Spectral power distribution of the desktop luminaire’s 3 modes.The saturated blue lighting intervention was selected for the morning to provide high CSand promote alertness and circadian entrainment. The morning blue light was expected toadvance sleep times because morning blue light advances circadian phase. Given that thehuman circadian system free runs with a period slightly greater than 24 hours, morningblue light advances the clock and promotes entrainment (see Background, above). The6500 K white light intervention was selected for midday to provide a smooth transitionfrom the blue to the red light, while still delivering a CS 0.3. The saturated red lightintervention was selected for the afternoon to provide an alerting stimulus while avoidingexcessive CS exposure in the latter part of the day, thereby preventing the delay ofcircadian phase.8
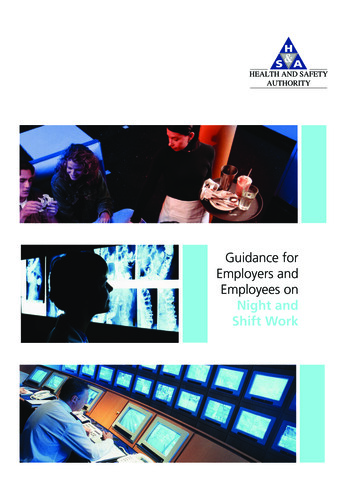
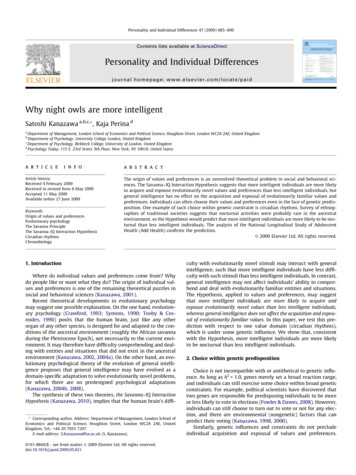
Increasing Circadian Light Exposure in Office Spaces, Final Technical Report; Submitted December 1, 2017(revised January 3, 2018, and February 2, 2018)Each desktop device consisted of 2 fully tunable spectrum 12-in. linear accent luminaires(model G2, Ketra, Austin, TX) placed end to end and housed in a custom-built woodenframe. The luminaires were covered by a domed white acrylic light diffuser (Utilitech ProWrap shop light, Lowe’s, Mooresville, NC) and enclosed with endcaps that were 3Dprinted (3D white PLA filament, Robo, San Diego, CA) by the LRC (Figure 3). Theluminaire was driven by a satellite link controller (model N3, Ketra, Austin, TX) with atouchpad interface (model X1, Ketra, Austin, TX). The assembled desktop devicemeasured 24 in. long 7 in. high 7.5 in. deep.On September 20–21, 2017, the LRC, together with GSA and DOS staff, installed 16luminaires at the HST site, 2 luminaires at the SR-1 site, and 2 luminaires at the SR-17site while also performing on-site photometric assessments of each device. A singleluminaire was installed on each participant’s workplace desktop. As shown in Figure 3,the linear accent housed in each luminaire was mounted and directed at a 30º angle (seeFigure 3, items 3 and 5) to direct the light at participants’ eyes. The linear accentremained in that position for the duration of the lighting intervention.Figure 3. Components of the desktop luminaire: (1) satellite link controller, (2) lightdiffuser, (3) LED linear accent, (4) plywood housing back, (5) pine board base, (6) ½in. 1-in., PVC 90 angle ( 2), (7) connector cable, (8) installed endcap, (9) touchpadinterface.To ensure compliance with the lighting intervention, each workspace was provided with aHOBO occupancy/light data logger (model HOBO UX90-005, Onset ComputerCorporation, Bourne, MA) that monitored desk occupancy and indoor light changes toidentify when participants were seated in front of the desktop luminaire. The HOBO dataindicates that no participants were out of compliance for the lighting intervention(Appendix 2).O N - S I T E P H O T O M E T RI C M E A S U RE M E N T SThe research team performed baseline photometric measurements using an opticalspectrometer (Model USB650 Red Tide Spectrometer, Ocean Optics, Winter Park, FL) orlux meter (Model BTS256-E, Gigahertz-Optik, Türkenfeld, DE). Measurements wererecorded at each participant’s desk, first with the desktop luminaire turned off, and thenfollowed by a single measurement for each of the Desktop luminaire’s lighting modes(totaling 4 measurements per device). All measurements were taken at the participants’eye level (Tables 4 and 5).9
Increasing Circadian Light Exposure in Office Spaces, Final Technical Report; Submitted December 1, 2017(revised January 3, 2018, and February 2, 2018)Table 4. Photometric/Daysimeter measurements taken at the 3 LuxHarry S. Truman Building 123142330151527019177102145357142
Increasing Circadian Light Exposure in Office Spaces, Final Technical Report; Submitted December 1, 2017(revised January 3, 2018, and February 2, 26916—3825153—4824959Building eabluewhitered—0.420.330.11Building SA-17—0.450.310.01—0.430.300.02Notes: Participant 620 (HST site) joined the study after the on-site photometric assessment, so nodata are available. Participant 621 (HST site) was not in the office when the research teamperformed the on-site photometric assessment.(a) Data not available.(b) This workspace had very low general illuminance.Table 5. Calculations of the five α-opic irradiances a and equivalent melanopic lux forthe photometric measurements taken at the 3 sites, following the SI-compliantapproach recommended by the ropicirradiance(μW/cm2)Equivalentmelanopiclux (EML)Harry S. Truman Building 13.0233.7216.7529.4818.7427.378128011
Increasing Circadian Light Exposure in Office Spaces, Final Technical Report; Submitted December 1, 2017(revised January 3, 2018, and February 2, lentmelanopiclux 21.4
technical report: increasing circadian light exposure in office spaces. harry s. truman building 2210 c street nw, washington, dc . u.s. department of state building .