Transcription
Asthma and lower airway diseaseCost of near-roadway and regional air pollution–attributablechildhood asthma in Los Angeles County nzli, MD, PhD,b,c Fred Lurmann, MS,d John Wilson, PhD,eSylvia Brandt, PhD,a Laura Perez, PhD,b,c Nino KufgManuel Pastor, PhD, and Rob McConnell, MDAmherst, Mass, Basel, Switzerland, and Petaluma and Los Angeles, CalifBackground: Emerging evidence suggests that near-roadway airpollution (NRP) exposure causes childhood asthma. Theassociated costs are not well documented.Objective: We estimated the cost of childhood asthmaattributable to residential NRP exposure and regional ozone(O3) and nitrogen dioxide (NO2) levels in Los Angeles County.We developed a novel approach to apportion the costs betweenthese exposures under different pollution scenarios.Methods: We integrated results from a study of willingness to payto reduce the burden of asthma with results from studies of healthcare use and charges to estimate the costs of an asthma case andexacerbation. We applied those costs to the number of asthmacases and exacerbations caused by regional pollution in 2007 andto hypothetical scenarios of a 20% reduction in regional pollutionin combination with a 20% reduction or increase in the proportionof the total population living within 75 m of a major roadway.Results: Cost of air pollution–related asthma in Los AngelesCounty in 2007 was 441 million for O3 and 202 million for NO2in 2010 dollars. Cost of routine care (care in absence ofexacerbation) accounted for 18% of the combined NRP and O3cost and 39% of the combined NRP and NO2 cost; these costs werenot recognized in previous analyses. NRP-attributable asthmaaccounted for 43% (O3) to 51% (NO2) of the total annual cost ofexacerbations and routine care associated with pollution.Hypothetical scenarios showed that costs from increased NRPexposure might offset savings from reduced regional pollution.Conclusions: Our model disaggregates the costs of regionalpollution and NRP exposure and illustrates how they might varyunder alternative exposure scenarios. The cost of air pollution isFrom athe Center for Public Policy and Administration and the Department of ResourceEconomics, University of Massachusetts Amherst; bthe University of Basel;cthe Department of Epidemiology and Public Health, Swiss Tropical and Public HealthInstitute, Basel; dSonoma Technology, Petaluma; eSpatial Science Institute, University ofSouthern California, Los Angeles; fProgram for Environmental and Regional Equity,University of Southern California, Los Angeles; and gthe Department of Preventive Medicine, Keck School of Medicine, University of Southern California, Los Angeles.Supported by the South Coast Air Quality Management District, a California state regulatory agency, with funds from a settlement with BP for violation of air quality regulations; National Institute of Environmental Health Sciences grants R01 ES016535,P01ES011627, P30ES007048, P01ES009581, and 5R01ES014447; U.S. Environmental Protection Agency grants R826708, RD831861, and R831845; and the Hastings Foundation.Disclosure of potential conflict of interest: The authors declare that they have no relevantconflicts of interest.Received for publication January 24, 2014; revised September 15, 2014; accepted forpublication September 24, 2014.Corresponding author: Sylvia Brandt, PhD, Resource Economics and Center for PublicPolicy and Administration, 205 Stockbridge Hall, University of Massachusetts Amherst, Amherst, MA 01002. E-mail: sylvbrandt@gmail.com.0091-6749/ 36.00Ó 2014 American Academy of Allergy, Asthma & .0291028a substantial burden on families and an economic loss forsociety. (J Allergy Clin Immunol 2014;134:1028-35.)Key words: Air pollution, asthma, cost of illness, urban growth,vehicle emissions, willingness to payApproximately 36 million persons in the United States livewithin 300 feet of a 4-lane highway, railroad, or airport.1Emerging evidence suggests that near-roadway air pollution(NRP) exposure causes childhood asthma.2-5 A causal relationship implies that any subsequent asthma exacerbation, regardlessof its precipitating trigger, can be attributed to NRP exposure.6 Inurban areas in Southern California, NRP exposure might accountfor a substantial proportion of all air pollution–relatedexacerbations in children, which are commonly estimated on apopulation level only for regional pollutants.7-9There has been little study of the costs of NRP-related healtheffects,10,11 which can be substantial.12 There are 3 categories ofcosts associated with these effects: direct costs are payments forhealth care; indirect costs reflect opportunity costs, such as lostwages; and willingness to pay (WTP) to avoid the burdenof asthma quantifies negative quality-of-life consequences.13Population estimates of asthma-related costs have generally notquantified the day-to-day experience of asthma, because no robuststudies had appropriately measured it.14-16We developed a model of annual cost of childhood asthma thatintegrated novel methods from economics and epidemiology:WTP to avoid asthma morbidity17 and risk assessment forchildren with NRP-caused asthma.7 We evaluated the cost ofpollution-related childhood asthma in Los Angeles County(LAC) in 2007 and the hypothetical cost per year of pollutionrelated childhood asthma under alternative levels of regionalpollution and exposure to NRP.LAC has a high prevalence of childhood asthma,18 densetraffic corridors, and high levels of regional air pollutants, suchas ozone (O3), nitrogen dioxide (NO2), and particulate matter.These regional levels are expected to continue to decrease as aresult of regulatory efforts.19 Although a reduction in regionalpollution should decrease the cost of asthma, the net effectwhen that reduction is combined with a change in the proportionof the population living near a major roadway is not obvious.Based on the results of a previously published evaluation ofpollution-related asthma exacerbations in LAC,7 we have nowestimated (1) the childhood asthma-related costs attributable toregional and near-roadway pollution in 2007 and (2) the savingsthat might result from a 20% regional pollution reductioncombined with a 20% increase or decrease in the proportion offamilies living in proximity to a major roadway relative to2007 levels.7
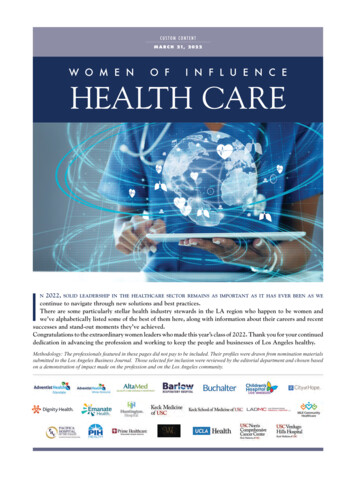
BRANDT ET AL 1029J ALLERGY CLIN IMMUNOLVOLUME 134, NUMBER 5Abbreviations usedCRF: Concentration response functionED: Emergency departmentLAC: Los Angeles CountyNRP: Near-roadway air pollutionNO2: Nitrogen dioxideO3: OzoneWTP: Willingness to payMETHODSPollution-attributable asthma outcomesThe selection of pollutants, estimation of population exposure,concentration response functions (CRFs), and pollution-associated burdenof asthma have been described previously.7 Briefly, we examined the effects ofO3 and NO2 because each has a well-established causal relationship withasthma exacerbations.20,21 In Southern California NO2 can be used as a proxyfor general regional pollution (exclusive of O3), including particulatematter, elemental carbon, and nitric acid, all of which are associated withrespiratory health effects.22,23 O3 is relatively uncorrelated with other regionalpollutants in the Los Angeles air basin.23,24 We avoided double countingpollution-attributable exacerbations by evaluating each pollutant separately.The baseline exposure for all scenarios was the 2007 population-weightedproportion of LAC children living near a major roadway and the 2007 levels ofregional pollution.7 A CRF for NRP was based on residence within 75 m of amajor roadway, a proxy for NRP exposure relevant for Southern California.5,9Major roadways included freeways, highways, or major arterial roads(functional road classes FRC01, FRC03, and FRC04 from the TeleAtlasMultiNet roads network7). In the first scenario we estimated totalasthma-associated costs of having 17.8% of the population living near majorroadways by constructing a hypothetical in which this population’s NRPexposure was reduced to background levels. We examined the costs imposedby the NO2 and O3 levels observed in LAC in 2007 compared with theirmean values in cleaner comparison cities in the Southern California Children’sHealth Study that year (Scenarios 1A and 1B, respectively). The 2007 baselinemeasures of 24-hour NO2 across census tracts in LAC ranged from 6.2 to 31.4ppb (population-weighted mean, 23.3 ppb). In Scenario 1A we calculated theeffect of a reduction in population-weighted NO2 exposure to 4 ppb acrossall census tracts. The 2007 baseline measures of 8-hour daily maximums forO3 across LAC ranged from 30.5 to 55.6 ppb (population-weighted mean,39.3 ppb). In Scenario 1B we reduced the population-weighted O3 exposureto 36.3 ppb. This first scenario generates the full asthma burden of thecombined effects of NRP and regional pollution in LAC compared with thatseen in cleaner communities.To illustrate the change in costs with respect to the 2 components ofpollution-attributable asthma, we constructed hypothetical scenarios in whicha decrease in levels of each regional pollutant was combined with either a 20%decrease (second scenario) or a 20% increase (third scenario) in the populationpercentage exposed to NRP. Because 17.8% of LAC children live near amajor roadway, a change of 20% constitutes 3.56 percentage points. Thehypothetical reductions in NO2 and O3 concentrations are plausible and basedon projections from the current air quality plan for Southern California.19Health effects and their costs were estimated for a single year. Whencalculating outcomes in the hypothetical scenarios, we assumed that changesin the prevalence of asthma and resulting exacerbations were fully realized andinstantaneous. These assumptions allowed us to compare costs across all of thescenarios and avoided the need for discounting.For each scenario, we used the near-roadway CRF to estimate theprevalence of asthma cases attributable to NRP in a given year.9 We estimated3 types of exacerbations among children in LAC for 1 year7: regionalpollution-triggered outcomes among children with NRP-attributable asthma(Fig 1, Box 3); outcomes triggered by other factors among children withNRP-attributable asthma (Fig 1, Box 2); and regional pollution-triggeredoutcomes among children with asthma caused by factors other than NRP(‘‘other-cause asthma’’; Fig 1, Box 6). Asthma exacerbation–related outcomesincluded bronchitis episodes, hospital admissions, emergency department(ED) visits, doctor’s office visits, and school absences for respiratory illness(for O3 only). Bronchitis, which was defined as a productive cough lasting 3months or more, is a sensitive marker of NRP-attributable asthmaexacerbations25 and is distinct from viral or bacterial bronchitis. We estimatedthe annual frequency of each outcome attributable to these regional pollutantsby using published CRFs for Southern California children when available orother appropriate CRFs when not. Tables E1-E3 in this article’s OnlineRepository at www.jacionline.org provide details on CRFs and baseline rates.Direct and indirect costs of an exacerbationFor each outcome, we estimated the direct cost of goods and services andthe indirect cost of caregivers’ lost wages. For the direct costs of health care,we used the amount charged rather than the amount paid because amountscharged are not confounded by insurance status. All costs were expressed in2010 dollars,26 and sources are summarized in Table E2.Direct costs of hospitalization and ED visits were calculated as the sum offacilities’ and physicians’ charges.27,28 The direct cost of an office visit wasestimated by using the national mean charge for a physician’s office visit.29The direct cost of asthma inhalers (rescue and controller medications) wasthe average of the price for each inhaler category weighted by the typicaluse of each category.30 The average price for each category of drug was theweighted mean of the name brand and generic prices.31,32The indirect costs for office visits, ED visits, and hospitalizations were thevalue of the caregiver’s time spent traveling,33 waiting,34 and receivingcare27,35,36 and were taken from secondary databases and peer-reviewedpublications. We used 1 workday (8 hours) as the time for a school absenceand valued time at the average wage rate.37 Although this is the standardapproach to valuing indirect costs, it overlooks the fact that caregivers ofasthmatic children sometimes leave the labor force to provide care.38 Thesecaregivers face lower expected lifetime earnings even when they do returnto the labor force.39Direct and indirect costs of routine careChildren with asthma need more routine care than other children. Thesefixed costs of asthma (Fig 1, Box 1) include medication use and treatment forexcess ear and sinus infections, an asthma-related comorbidity. The expectedquantity for each outcome was estimated for children aged 0 to 17 years inLAC by using the peer-reviewed literature and secondary databases(see Table E2).30,40,41 Costs were calculated by using the same approach asfor exacerbations.Direct and indirect costs of a bronchitis episodeEach bronchitis episode includes 5 potential costs: school absences,42antibiotic prescriptions,43-46 office visits,47,48 ED visits,47,48 and inpatienthospital stays.47,48 We estimated the number of office visits, ED visits, andhospital stays as the mean rate for children with asthma using the 2007Medical Expenditure Panel Survey. These estimates are significantly lowerthan some reported rates.49WTPBronchitis and asthma substantially affect quality of life.13,49,50 The value ofthis effect is quantified as the WTP to avoid this burden by using contingentvaluation. A contingent valuation study offers participants a hypotheticalhealth-related product, quotes prices, and inquires about WTP. Surveys mustbe designed to elicit values specific to desired health outcomes and to ensurevalid responses.16 To meet these criteria, we used the results of a contingentvaluation study conducted in California among families with asthmaticchildren.17The WTP study17 was designed to estimate a WTP beyond the household’scurrent expenditures and included ‘‘debriefing’’ questions to ensure that theWTP was based on a desire to reduce the pain and suffering of asthma.Thus the estimate is specific to asthma and additive to the other costs. The
1030 BRANDT ET ALJ ALLERGY CLIN IMMUNOLNOVEMBER 2014NRP-caused asthmaRoutine careOther-cause asthmaController medicationComorbidities episodesNONEDays with symptoms[Box 4][Box 1]Other-cause exacerbationsBronchitis episodesHospital admissionsEmergency department visitsNONEDoctor's office visits[Box 5]School absences[Box 2]Regional pollution-causedexacerbationsBronchitis episodesBronchitis episodesHospital admissionsHospital admissionsEmergency department visitsEmergency department visitsDoctor's office visitsDoctor's office visitsSchool absencesSchool absences[Box 3][Box 6]FIG 1. Outcomes associated with exacerbations and routine care attributable to pollution.quality-of-life burden of a single day of symptoms was calculated as the meanWTP divided by the mean number of symptom days that would have beenavoided by using the hypothetical product.17 The hypothetical product offereda 50% reduction in days with asthma symptoms, and therefore we doubled thatestimate to determine the WTP to avoid a case of asthma.17Using the WTP results,17 we calculated the quality-of-life value of symptomdays for bronchitis and ear and sinus infections. We multiplied the mean numberof symptom days in excess of those in children without asthma41 by the WTP toavoid a day with symptoms.17 The CRF was based on bronchitis lasting at least 3months.25 We used a more conservative value of 35 symptom days per episodebased on other studies examining the cost of cough lasting more than 4weeks.50-52 The WTP estimate was used to assign costs to bronchitis episodesand ear and sinus infections17 because it is specific to children, is consistentwith our outcome definitions, and meets the guidelines for validity.16 OurWTP estimates for these outcomes are more conservative than values extrapolated from the existing literature by the US Environmental Protection Agency.53RESULTSWe previously reported detailed estimates of the burden ofpollution-attributable asthma in LAC that serve as the basis for ourcost estimates.7 Briefly, we estimated that 27,100 cases ofchildhood asthma (95% CI, 4,900-51,200) are attributable tocurrent NRP exposure, which is equivalent to 8% of the total currentasthma burden in LAC. If proximity to roadways were reduced as inScenario 2, there would be 5,900 (95% CI, 1,000-11,800) fewercases of childhood asthma; increasing proximity as in Scenario 3would have the exact opposite effect. Table I7 shows the changein the numbers of exacerbations under each scenario relative tothe 2007 baseline. Among children with asthma, substantialproportions of the 2007 burden of bronchitis (57%), hospitalizations (20%), ED visits (11%), doctor’s office visits (12%), andschool absences (31%) were attributable to the combined effectof NRP exposure and regional pollution (Scenarios 1A and 1B inTable I). The magnitude of bronchitis episodes attributable topollution reflects the susceptibility of the population of asthmaticchildren and the prevalence of asthma consequent to NRP exposure.A reduction in regional pollution and NRP exposure (Scenario 2)decreases all asthma outcomes; a reduction in regional pollutionaccompanied by an increase in NRP exposure (Scenario 3)increases all outcomes among those children with asthma becauseof NRP. Despite the decrease in regional pollution, the increase incases of asthma caused by NRP exposure leads to a net increasein ED visits, doctor’s office visits, and school absences (Scenario3 in Table I).Table II27,33-36 shows the mean annual cost for a typical asthmacase and the cost for a single bronchitis episode broken down intodirect cost (column [2]), indirect cost (column [3]), and WTP(column [4]). The total annual cost of routine care (not includingacute exacerbations) plus the quality-of-life cost as measured byWTP is approximately 3,000 for a single asthma case. The costfor a single episode of bronchitis is 1,500.The cost per year of asthma outcomes attributable to NRP andregional pollution for each scenario is the product of the quantityof each outcome caused by pollution in that scenario (Table I,column 4) and the cost of each outcome (Table II, sum of columns[2], [3], and [4]). Table III shows the costs of the bronchitisepisodes, hospital admissions, ED visits, doctor’s office visits,and school absences (O3 only) caused by regional air pollutionfor children with asthma caused by NRP (column [1]) andchildren with other-cause asthma (column [2]). Column (3) showsthe cost of those outcomes caused by triggers other than regionalpollution among children with asthma caused by NRP. The sum ofthe cost of these outcomes for NO2 and exacerbation caused byother triggers among those children with NRP-attributableasthma was 123 million (Table III, row [5] and column [5]).A large portion ( 108 million) is due to bronchitis episodesbrought on by pollution exposure. The cost of all outcomes amongchildren with NRP-attributable asthma (the sum of the total rowfor NO2 in column [1] of Table III [ 9 million] and the totalrow for NO2 in column [3] of Table III [ 15 million]) accountedfor about 20% of the 123 million total.The cost of outcomes caused by O3 and exacerbations causedby other triggers among children with NRP-related asthma totaled 362 million (Table III, Scenario 1B). The differences betweenScenario 1B and Scenario 1A are largely due to school absencescaused by O3. Across all O3 outcomes, 30% of the potentialsavings were due to reducing exacerbations among childrenwith NRP-attributable asthma.Scenarios 2 and 3 in Table III illustrate the combined effects ofthe 20% change in NRP exposure and the 20% reduction inregional pollution. We reported the estimated costs for the regionalpollutant most responsible for each outcome: NO2 for all outcomesexcept school absences. Thus if regional pollution were 20% lowerthan 2007 levels and the proportion of the population near theroadways were reduced, there would be a decrease in the frequencyof each outcome (from Table I, Scenario 2) and a decrease in totalcosts (Table III, Scenario 2) of approximately 66 million. If thedecrease in regional pollution were accompanied by an increasein NRP exposure, then there would be an increase in each outcomethat is triggered by regional air pollution or other factors amongthose with NRP-attributable asthma (from Table I, Scenario 3,columns [1] and [3], in brackets to indicate an increase in diseaseburden). The total increase in costs would be 24 million (Table III,Scenario 3, columns [1] plus [3]). There would be a decrease in outcomes among those children with other-cause asthma (fromTable I, Scenario 3, column [2]) and consequently a decrease incosts of 43 million (Table III, Scenario 3, column [2]). The netdecrease in the total cost of all exacerbations in Scenario 3 wouldbe 20 million. The exacerbations caused by factors other than airpollution among children with NRP-attributable asthma (column[3]) account for most of the large difference between Scenarios 2
BRANDT ET AL 1031J ALLERGY CLIN IMMUNOLVOLUME 134, NUMBER 5TABLE I. Decrease (increase in brackets) in the number of asthma outcomes under different exposure scenarios relative tobaseline NRP exposure and regional pollutionDecrease (increase in brackets) in outcomes attributableto regional air pollution among those with asthmacaused by:NRP (1)Other factors (2)Both NRP and otherfactors (1)1(2)Decrease (increase inbrackets) in outcomes dueto other causes amongthose with asthma causedby NRPTotal decrease (increase inbrackets) in outcomes(1)1(2)1(3)(3)(4)Scenario 1A: Reduction in NRP exposure and regional NO2 levels to background levelsBronchitis episodes5,60059,50065,1005,10095% spital admissions3034037523595% CI5-65265-420295-45050-450ED visits353704051,57095% CI5-8565-67075-725320-2,970Doctor’s office visits8709,20010,10019,80095% ario 1B: Reduction in NRP exposure and regional O3 levels to background levelsBronchitis episodes1,61017,20018,8009,10095% CI0-4,050530-32,100590-34,9001,900-17,600Hospital admissions1.920.722.627095% CI0.3-4.210-31.710.9-34.350-510ED visits111211331,59095% CI2-2375-16784-181330-3,020Doctor’s office visits5963269220,60095% CI6-144160-1,111175-1,2074,200-39,100School absences27,900302,000329,90086,20095% ,700Scenario 2: Decrease in proportion of children living near major roadways and 20% reduction in regional pollution34017,60017,9002,000Bronchitis episodes (NO2)95% CI30-8204,800-29,3004,900-29,900400-4,100Hospital admissions (NO2)175806095% CI0-360-9560-9510-12028080350ED visits (NO2)95% CI0-415-14515-15070-700Doctor’s office visits (NO2)402,0202,0604,50095% 4,400School absences (O3)95% CI0-930970-36,510980-37,120980-46,800Scenario 3: Increase in proportion of children living near major roadways and 20% reduction in regional pollution[339]17,92917,589[2,009]Bronchitis episodes (NO2)95% 1]7977[58]Hospital admissions (NO2)95% CI[3]-062-9660-94[11]-[116]ED visits (NO2)[2]8180[352]95% CI[4]-015-14814-145[67]-[703]Doctor’s office visits (NO2)[39]2,0592,020[4,519]95% 19418,846[24,367]School absences (O3)95% 2,499][7,305]-1,552[55,21][34,370]-23,222Estimates are reproduced from Perez et al7 and baseline outcomes, population and concentration-response functions are reported there. The baseline for each scenario is 2007 levelsof NRP exposure and regional pollution. Scenario 1 is a 17.8 percentage point decrease in NRP exposure (to background levels of zero), decrease of 19.3 ppb of NO2 (Scenario1A), and decrease of 3.03 ppb of O3 (Scenario 1B). Scenario 2 corresponds to a 3.56 percentage point decrease in NRP exposure, decrease of 3.9 ppb of NO2, and decrease of 0.61ppb of O3 relative to the 2007 baseline. Scenario 3 corresponds to a 3.56 percentage point increase in NRP exposure, decrease of 3.9 ppb of NO2, and decrease of 0.61 ppb of O3relative to the 2007 baseline. Values within brackets are an increase in the number of outcomes.and 3 (a reduction of 23 million per year in Scenario 2 and anincrease of almost that amount in Scenario 3).For each scenario, Table IV shows the sum of the costs ofexacerbations (column [1], which is the sum of columns [1], [2],and [3] in Table III]) and routine care for NRP-attributable asthmacases (column [2]). Scenarios 1A and 1B in Table IV reflect thetotal burden of NRP and regional pollution beyond that of cleanercomparison communities. A 100% reduction in major roadwayproximity with a reduction in NO2 levels to those in cleancommunities (Scenario 1A) would save approximately 203million annually. Elimination of NRP proximity and reductionof O3 to clean community levels (Scenario 1B) would save almost 441 million yearly. In Scenario 1A 39% of the total cost of thecurrent burden of NRP and regional NO2 concentrations is dueto the cost of routine care for NRP-attributable asthma cases(the analogous figure for O3 is 18%). These NRP fixed costs
1032 BRANDT ET ALJ ALLERGY CLIN IMMUNOLNOVEMBER 2014TABLE II. Costs of routine asthma care for a single case of asthma and costs of a single bronchitis episode (in 2010 US dollars)Annual cost for routine asthma caseMean annualoccurrence (1)Quality of lifeMedicationInhaled ’s office visits (nonurgent)Mean cost of antibioticsUrgent care visitsHospital admissionsDays with symptomsTotal cost per year1Direct cost peroccurrence (2)Indirect costs peroccurrence* (3)WTP (4)Annual cost per asthmacase 513318934215652,93417Cost for a typical bronchitis episodeDoctor’s office visitsED visitsHospital admissionsSchool absencesAntibioticsDays with symptomsTotal cost per episodeMean occurrence per bronchitisepisode (1)Direct cost peroccurrence (2)Indirect cost peroccurrence* 7220NANAWTP per day (4)17Mean cost per bronchitisepisode (1)*(21314)17957174440995951,544NA, Not applicable.*Mean times were as follows: 46.6 minutes for roundtrip travel for medical purpose,33 23 minutes waiting for office visit,34 24 minutes for receiving care,35 3.16 hours for visitingthe ED,36 and 2.2 days for an asthma admission and 3.3 days for a bronchitis admission.27have not been considered in previous regulatory risk assessments.The total cost savings achieved by reducing both regional pollution and proximity exposure (Scenario 2) are approximately 84million; in comparison, increasing NRP exposure while reducingregional pollution provides a cost savings of only 2 million(Scenario 3). Thus Scenario 3 suggests that the cost of theincreased number of asthma cases due to NRP-attributable asthmaeliminates almost all the savings of reducing regional pollution.The asthma-related effect of NRP is the sum of the cost of allexacerbations among children with NRP-attributable asthma(columns [1] and [3] from Table III) and the cost of routine carefor NRP-attributable cases (column [2] from Table IV). Thus ifNRP exposure were eliminated, 104 and 189 million couldbe saved, respectively, by also reducing NO2 and O3 levels tolevels seen in clean communities.DISCUSSIONThe cost of air pollution–attributable childhood asthma is large,between 203 million (for NO2) and 441 million (for O3) in 2007.For perspective, that was 6% and 13%, respectively, of the healthdepartment’s total expenditures on all health services for uninsuredresidents in LAC.54 A 20% decrease in regional pollutionaccompanied by a 20% decrease in the proportion of children livingnear major roads would reduce the cost of asthma by approximately 81 million more than if that decrease in regional pollution wereaccompanied by a 20% increase in the proportion of the populationliving near major roads. If policies such as replacing automobileswith electric vehicles or creating buffers between major roadwaysand children’s homes and schools are effective in eliminating casesof asthma attributable to traffic proximity exposure, the reductionin the total cost of the combined pollution-attributable burden wouldbe 51% for NO2 and 43% for O3.Expenditures to cover the direct costs of asthma represent a lossto society. In Los Angeles 32% of children are covered by publicinsurance (Medi-Cal or Healthy Families)55; therefore publicfunds pay for 32% of the direct pollution-attributable costs ofasthma ( 34 million a year for NO2). If this public expenditurewere eliminated, that money could be used to extend Medi-Calinsurance to an additional 33,700 children each year (based onthe cost of coverage and average health care expenditures56).Two doses of varicella vaccinations could be provided to anadditional 135,218 children each year.57 If we invested therecovered funds in education, then full-time preschool could beprovided for an additional 2,358 children, producing a societalbenefit of 49 to 132 million a year (based on returns toinvestment in early education58).Our methodology relied on 2 key assumptions. First, we assumedthat without exposure to NRP, the child would not
Asthma and lower airway disease Cost of near-roadway and regional air pollution-attributable childhood asthma in Los Angeles County Sylvia Brandt, PhD,a Laura Perez, PhD,b,c Nino K unzli, MD, PhD, b,c Fred Lurmann, MS,d John Wilson, PhD,e Manuel Pastor, PhD,f and Rob McConnell, MDg Amherst, Mass, Basel, Switzerland, and Petaluma and Los Angeles, Calif .