Transcription
International Journal of Academic Research in Business and Social Sciences2017, Vol. 7, No. 10ISSN: 2222-6990Inflight Service Quality of Malaysia Airlines: ValidationUsing SEM and AMOS*Ibrahim Rose, Zainudin Awang, and Shukri YazidFaculty of Economics & Management Sciences, Universiti Sultan Zainal Abidin (UniSZA)MalaysiaDOI:10.6007/IJARBSS/v7-i10/3395 URL: ACTThis study analysed Malaysia Airlines’ inflight service quality (IFSQUAL) from the perception ofpassenger satisfaction because it was important to know passenger’s quality perceptionregarding the airline’s quality improvement. A total of 2,000 complete questionnaires weresuccessfully compiled to build a sampling frame, and a total of 282 questionnaires wereselected using a simple random sampling technique, which was one of the probability samplingmethods. The data were analysed using the IBM-SPSS Amos 23.0 software. The latent constructmeasurement model had been validated through the Confirmatory Factor Analysis (CFA)procedure, and developed 30-item scale based on 4 distinct dimensions: Personal Attributes,Flight Safety, Inflight Service, and Passenger Satisfaction. The finding of Structural EquationModelling (SEM) showed that approximately 93% of the variance in Passenger Satisfaction wasaccounted for with the predictors (R2 0.930). The direct and indirect (mediation) hypothesistesting had been verified with bootstrapping with 1000 samples, and 95% confidence level.Results revealed; five hypotheses were significant on the direct effect, and two mediationeffects were not significant. We were able to identify the gap of this study; inflight servicequality was not a ‘quick-fix’, and thus had to be approached from a long-term perspective.Keywords: Airline, Inflight Services Quality, Passenger Satisfaction, SEM, AMOSINTRODUCTIONAir transportation plays an important role in moving people, or products fast from one place toanother either domestically or internationally. Airline industry is also at the heart of the traveland tourism industry, and is the main contributor to many countries’ overall economy throughinternational tourist arrivals (Oyewole et al., 2007; Zahari et al., 2011; Norazah, 2014; Rahim,2016; Rose et al., 2016). The positive development of the travel, and tourism industry hascreated great competition among the large and small airline companies for passengersatisfaction (Pincus 2001; Jankalová, 2016; Rose et al., 2016). Broad marketing with a full rangeof innovative strategies can exploit to the fullest advantage through its quality inflight service ininflight entertainment, cabin facilities, flight safety policy and its competent flight attendant.This study aims to introduce the system of measuring the inflight service quality (IFSQUAL) frompassenger’s perspective; hence it is imperative to deal with this issue for passenger satisfaction.The IFSQUAL falls under the airline’s product and inflight service excellence. To measure it is478www.hrmars.com
International Journal of Academic Research in Business and Social Sciences2017, Vol. 7, No. 10ISSN: 2222-6990more often being mentioned as part of the corporate practice, but it also being done at thetheoretical level (Jankalová, 2014; Giovanis, et al., 2015; Ranaweera & Sigala, 2015). Thesituation in the area of measuring it is quite different from multinational institutions, nonprofit, and public organisations. We assume that passenger’s perception of IFSQUAL includesmore than mere satisfaction from the provided service as derive from the passenger’sperspective on their disadvantages or inconveniences (Zeithaml et al., 2013; Jankalová, 2016;Rose et al., 2016), which perceive that passenger’s opinion is affected also by the way her/hisrequest is received, method of timing for the need of satisfaction, clarity and willingness,accuracy, and punctuality of dealing with the requests.Juran (1974) coins quality as ‘fitness for use’ in user-based approach. Crosby (1979) interpretsquality as ‘conformance to requirements’ in manufacturing-based approach. There are fivemain approaches that identify the definition of quality (Garvin, 1984; Yarimoglu, 2014;Jankalová, 2016):1. The transcendent approach of philosophy; according to the transcendent view, qualitymeans ‘innate excellence’. It is a mark of uncompromising standards and high attainment,which can be recognised only through experience.2. The product-based approach of economics, which quality is perceived as ‘a precise andmeasurable variable’ and variances in quality reflect differences in the quantity element, orattribute, so that better quality can only be obtained at a higher cost.3. The user-based approach of economics, marketing, and operations management; quality isassociated with the satisfaction. The supreme quality means the best satisfaction ofconsumers’ preferences.4. The manufacturing-based; defined quality as ‘making it right the first time’. This is a supplybased and concerned with engineering and manufacturing practice. The airline is alsoinvolved in engineering to ensure its aircrafts are airworthy.5. Value-based approaches of operation management; defined quality in terms of cost andprice. Usually perceived as a function of price.Another categorisation of approaches to defining inflight service quality:1. Perceived quality vs. objective quality: Passenger does not use the term of quality in the same way as researchers and marketersdo; they define it conceptually (the conceptual means distinguishes between mechanisticand humanistic quality) (Garvin, 1983; Dodds & Monroe, 1984; Holbrook & Corfman,1985; Jacoby & Olson, 1985; Zeithaml, 1987; Rose et al., 2016). Mechanistic quality involves an objective aspect or feature of a thing or event, humanisticquality involves the subjective response of flight attendant towards objects, and istherefore a highly relativistic phenomenon that differs between judges (Holbrook &Corfman, 1985; Jankalová, 2016).2. Quality as attitude: The importance of the inflight service quality as an overall evaluation issimilar to attitude (Olshavsky, 1985; Parasuraman et al., 1985; Jankalová, 2016).3. Quality vs. satisfaction: Perceived inflight service quality is a global judgment, or attitude,479www.hrmars.com
International Journal of Academic Research in Business and Social Sciences2017, Vol. 7, No. 10ISSN: 2222-6990relating to the superiority of the inflight service, whereas satisfaction is related to a specifictransaction (Howard & Sheth, 1969; Hunt, 1979; Oliver, 1981; Jankalová, 2016; Rose et al.,2016).4. Expectations compared to perceptions: Perceived inflight service quality is therefore viewedas the degree and direction of discrepancy between passenger’s perceptions andexpectations (expectations can be viewed as passenger’s desires/wants, merely what s/hefeels the airline should offer rather than would offer (Sasser et al., 1978; Grönroos, 1982;Lehtinen & Lehtinen, 1982; Parasuraman et al., 1985; Jankalová, 2016; Rose et al, 2016).In the universal quality methods; present competitive environment can aid measuring systemstaking into account the environment of inflight service provision and individual quality of theflight attendant (Zeithaml et al., 2013; Yarimoglu, 2014; Rose et al., 2016), which both the coexistence and inconsistency of individual approaches to defining the concept of IFSQUALgradually can bring the need to determine the quality dimensions of inflight service.There are some major differences about inflight service, flight safety policy, and product. Thenature of inflight service is intangible whereas product is tangible, and policy of flight safety istangible (Edkins & Coakes, 2007; Sengupta, 2011; Yang & Chang, 2012; Oster et al., 2013; Roseet al., 2016). Since inflight service is intangible, measurement of IFSQUAL can be morecomplicated because IFSQUAL is measuring all at the same time (Zeithaml et al., 2013; Rahim,2016; Rose et al., 2016). IFSQUAL measures how much the inflight service being renderedmeets the passenger satisfaction. In order to measure the intangible quality of inflight service;the term ‘perceived’ is commonly used by researchers (Parasuraman et al., 1985; Yarimoglu,2014; Rose et al., 2016). Perceived IFSQUAL is a result of the comparison of perceptions aboutinflight service delivery process and the actual outcome of inflight service (Grönroos, 1984;Wirtz et al., 2012; Jankalová, 2016; Rose et al., 2016). Sweeney et al. (1997), Jankalová (2016),Rose et al. (2016) analysed whether service quality in service encounter stage affects perceivedvalue and consumer willingness to buy; as a result of the study, they found that service qualityperceptions in service encounter stage affects consumers more than product quality. Rahim(2016), Rose et al. (2016), and Sandada and Matibiri (2016) mention, due to increasingcompetition in the market has led many airlines to consider quality as a strategic tool. IFSQUALis becoming more important and the airline should improve its inflight service to gainsustainable competitive advantage, passenger satisfaction, and loyalty (Rahim, 2016; Rose etal., 2016; Sandada & Matibiri, 2016). In extant literature shows that passengers who aredissatisfied with inflight service spread their experiences to more than three other people(Chinunda, 2013; Jankalová, 2016; Rose et al., 2016). Not everyone will identify with that kindof perception, but airline should realise that it will not achieve business excellence without theconstant cycle of measuring the quality of its own inflight service (Shewhart, 1931; Vincoli,2014).480www.hrmars.com
International Journal of Academic Research in Business and Social Sciences2017, Vol. 7, No. 10ISSN: 2222-6990METHODMalaysia Airlines was the unit of analysis, and passengers were the survey respondents of thisstudy (Awang, 2014; Trochim et al., 2015). We selected Malaysia as the country to beinvestigated, and the airline industry as the organisation to be examined. This airline hadregistered with Department of Civil Aviation Malaysia for air/ground operator certification. Itcomprised of international passengers who had at least travelled once in the last 12 monthsarrived at Kuala Lumpur International Airport (KLIA), which meant the participants had a clearview about airline(s) inflight service. We chose KLIA because it was the main internationalairport that handled international flights in Malaysia. Observed the precise and specific scope ofthe above, the target population of the study were: (1) All international flights above 6 hoursonly; as these flights served more than one meal service per flight. Those flights were fromLondon, Melbourne, Sydney, Adelaide, Jeddah, Narita, Incheon, and Beijing; becausepassengers were able to experience more from these flights; (2) Arrived at KLIA on MalaysiaAirlines only (not from all airlines in the world); (3) At KLIA only (not at any other airports).Population and SamplingThe average number of total passengers travelling with this airline was about 50,000 on 360flights a day (Malaysia Airlines, n.d.). The next level was to select the group of internationalpassengers from which the sample was actually selected, and termed as the sampling frame(Awang, 2014; Trochim et al., 2015). The sampling frame was identical to the target populatingsince it was desirable that all passengers of the target population were potential passengers, orthe sample. The sampling frame for this research comprised all passengers travelling withMalaysia Airlines and arriving from international flights during two months’ period of Februaryand March 2015. We expected approximately 30% of the distributed questionnaire to becompleted, and returned within four months after the survey distributions were completed.QuestionnaireWe distributed 2,000 questionnaires on 40 selected flights at a rate of 50 questionnaires foreach flight directly to passengers who agreed to contribute in the study (refer to Table 1).Though questionnaires were distributed to those passengers who agreed to participate, only915 questionnaires were returned giving the response rate of 45.75%. After careful scrutiny ofthe data, the completed questionnaires were coded and statistically analysed. Sample size of900 (45%) was retained for further analysis on the random sampling by using SPSS 23.0. Theexcluded questionnaires were either inaccurate or incomplete responses.481www.hrmars.com
International Journal of Academic Research in Business and Social Sciences2017, Vol. 7, No. 10ISSN: 2222-6990Table 1: Collecting Data on Selected Flights of the Eight ***Beijing****7th*****8th*****SamplingIn the case of this study, because of the mobile and polarised passengers on the jet plane therewas no proper sampling frame for the specific available passengers, hence the study had todevelop the sampling frame for this purposes. We distributed questionnaire randomly to 50incoming passengers per flight at KLIA. The obtained responses of 2,000 samples were listedinto a grand list of passengers, and then the study employed the probability random samplingprocedure to obtain a random sample of 282 passengers from the sampling frame for this study(Awang, 2014; Hair et al., 2015; Trochim et al., 2015), sampling design helped this study tounderstand easily the research process, and to analyse data.Sampling DesignSampling was the selection of a subset of cases of the total number of units in order to beable to draw general conclusions about the entire body of units (Babbie, 2013; Awang, 2014;Trochim et al., 2015). We selected an appropriate method of sampling to generalise results,especially when the population was very large (Babbie 2013; Awang, 2014; Hair et al. (2015). Itwas considered unusual if this study were to survey a big total of population because thisresearch type was cross-sectional; as it had to comply with airline’s policy; had to comply withKLIA’s policy; had financial constraints and time limit.Sample for heterogeneities were to include all opinions, or views (Takeuchi, 2008; Tashakkori &Teddlie, 2010; Awang, 2014; Trochim et al., 2015). Awang (2014), and Trochim et al. (2015)mentioned that in many brainstorming, or nominal group processes (including conceptmapping), heterogeneity sampling were used because the primary interest was in getting broadspectrum of ideas, not identifying the ‘average’ or ‘modal instance’ ones, in fact, the samplingwas not about people, but ideas. Indeed and undoubtedly, in order to get all of the ideas, andespecially the outlier or unusual ones, broad and diverse ranges of participants were included(Hair et al., 2015; Trochim et al., 2015; Bakar & Afthanorhan, 2016). That was the reason 2,000questionnaires were distributed to eight international flights.482www.hrmars.com
International Journal of Academic Research in Business and Social Sciences2017, Vol. 7, No. 10ISSN: 2222-6990Sample Size for Structural Equation Modelling (SEM)There were many approaches, including a number of different formulas, for calculating samplesize. To employ SEM in this study there was no clear-cut answer of how many number ofrespondents should be obtained because every research differs (among other things) in termsof the population characteristics, and the number of constructs that were employed in a model(Tanaka, 1993; Awang, 2014; 2015; Hair et al., 2014; 2015).Research Instruments (Questionnaire Design)This study’s questionnaire comprised of two main sections and took approximately eightminutes to complete. In answering the questions, respondents were required to circle the mostsuitable answer on the scale. The questionnaire was in English because it was an internationallanguage, using simple, and direct question. The intention was to keep the questionnairesimple, so that it would not take too much of the respondent’s time (Parasuraman et al., 1988;Awang, 2014; Trochim et al., 2015). It was a 2-page questionnaire to keep in environmentallyresponsible and user friendly way. In the questionnaire survey the 7-point Interval scale wasemployed, which was possible to be quantified in the research, and to see two differentcontraries (Likert, 1932; Parasuraman et al., 1985; 1988; Pitt et al., 1995; Johns, 2010; Losby &Wetmore, 2012; Sekaran & Bougie, 2013; Awang, 2014; Trochim et al., 2015).Section A: Focused on respondent’s profile, there were seven questions.Section B: Refer to Appendix Aa) This section focused on personal attributes as an independent variable. Initially, there were10 questions before exploratory factor analysis (EFA); the questions were measuring therespondent’s acknowledgement of the personal attributes aspects of the flight attendant,which they observed and experienced during their journey. Those characteristics were obviousin IFSQUAL because the flight attendant had attended various training programmes as their ongoing personal development. This section measured the respondent’s agreement towards flightattendant’s personal attributes throughout the flight.b) The questionnaire was measuring flight safety as another independent variable. Initially,there were 10 questions; the questions were measuring respondents’ understanding of theexistence of the flight safety as it was considered to be important to the extreme of humans,things or situations in the form of policies. This section measured the respondent’sunderstanding and awareness of the flight safety during their journey.c) This questionnaire focused on inflight service, as the mediator. Initially, there were 10questions; the instruments for this section were created from a comprehensive literaturereview and training manuals, hypotheses, and researcher’s working experience as a flightattendant. This section measured the respondent’s perception of the inflight service offered bythe airline.483www.hrmars.com
International Journal of Academic Research in Business and Social Sciences2017, Vol. 7, No. 10ISSN: 2222-6990d) The questionnaire focused on passenger satisfaction as dependent variable towards theoverall quality from passenger expectation and experience. Initially, there were 10 questions;the questions were influencing respondent’s knowledge. The instruments for this section werecreated from a comprehensive literature review, from researcher’s working experience as shereceived face-to-face feedback from passengers during flight, and her observation whentravelled with other airlines. This section influenced, and measured the respondent’s feedbackabout the airline’s products, inflight service and their awareness of flight safety.Measurement of ConstructEssentially, too few items would not capture the construct, but too many items would tire thesubject, who would either not answer the items or would not answer them carefully (Pett et al.,2003; Sekaran & Bougie, 2013; Awang, 2014; Trochim et al., 2015). Babbie (2013), Sekaran &Bougie (2013), and Trochim et al. (2015) mentioned that most researchers made the mistake ofasking too many questions, which was the greatest enemy in survey research that caused poorresponse rate. They suggested clear and concise questionnaires to get the best response. Theycontinued to explain that in determining the number of items that was initially needed to beincluded in an instrument, researchers must consider the format of the item, time availability ofthe subject, and the characteristics of the population from the data to be gathered. This studyemployed its survey instruments designed by extant researchers. They were the prominentresearchers in service quality, and had designed instruments to measure items associated withpersonal attributes, flight safety, inflight service, and passenger satisfaction. Hence, we adaptedand customised their items below to suit with our study, which were verified and validated bytwo experts on the content for the content validity (Awang, 2014).Parasuraman et al. (1985) analysed the dimensions of service quality, which offered animportant framework for defining and measuring service quality. Parasuraman et al. (1985)developed the GAP Service Quality Model through the findings from exploratory research. TheGAP relations and names were shown below (Parasuraman et al., 1985; Wirtz et al., 2012;Saglik et al., 2014; Yarimoglu, 2014):GAP 1: Customer expectation-management perceptions gap (the Knowledge Gap).GAP 2: Management perception-service quality specifications gap (the Policy Gap).GAP 3: Service quality specifications-service delivery gap (the Delivery Gap).GAP 4: Service delivery-external communications gap (the Communications Gap).GAP 5: Expected service-perceived service gap (the Service Quality Gap).Haywood-Farmer (1988) discussed his service quality model comprising of three basicattributes, which the model associated with Parasuraman et al.’s Service Quality Determinants(1985). Parasuraman et al. (1988) develop simplified SERVQUAL, which was an advanced modelfor measuring service quality. In SERVQUAL model there were 5 dimensions and 22 itemspresented in 7-point Likert scale. SERVQUAL measured especially functional service qualitythrough empirical studies in banking, credit card, repair and maintenance, and long-distancetelephone services, which had been adopted/adapted by other researchers for other types of484www.hrmars.com
International Journal of Academic Research in Business and Social Sciences2017, Vol. 7, No. 10ISSN: 2222-6990studies (Haywood-Farmer, 1988; Bari et al., 2001; Saglik et al., 2014; Yarimoglu, 2014; Debasish& Dey, 2015).Cronin and Taylor (1992) developed SERVPERF, which was a performance-only model formeasuring service quality with empirical studies in banking, pest control, dry-cleaning, and fastfood sectors. They developed a service quality scale dimensions of expectation (22 items-sameas SERVQUAL), performance (22 items-same as SERVQUAL), importance (22 items-same asSERVQUAL), future purchase behaviour (1 item), overall quality (1 item), and satisfaction (1item), which were measured by 7-point semantic differential scale. Performance-basedSERVPERF scale and the gap-based SERVQUAL scale could measure service quality(Parasuraman et al., 1988; Cronin & Taylor, 1992; Saglik et al., 2014; Yarimoglu, 2014; Alotaibi,2015; Debasish & Dey, 2015).Bari et al. (2001) discussed airline service quality (AIRQUAL) model including five basicattributes. To achieve their goal they followed two important methods; the first method wasthe sequence of 8 steps presented by Churchill (1999). Secondly, the AIRQUAL was alsoassociated with SERVQUAL instrument revealed by Parasuraman et al. (1988) that were basedon Perceptions–Expectations, which was known as a disconfirmation Paradigm (Alotaibi, 2015).Table 2 was analysed to adapt and customise the items in our study.Table 2: Dimensions of Service Quality ModelsStudyModelDimensionParasuraman et al.,GAP ModelReliability, Responsiveness, Competence, Access,1985Courtesy, Communication, Credibility, Security,Understanding/Knowing the Customer, TangiblesHaywood-Farmer,ServicePhysical facilities, processes and procedures; People1988Qualitybehaviour and conviviality; Professional judgmentAttributesParasuraman et al.,SERVQUALTangibles, Reliability, Responsiveness, Assurance,1988EmpathyCronin & Taylor,SERVPERFSame as SERVQUAL but with performance only1992statementsBari et al., 2001AIRQUALAirline tangibles, Terminal tangibles, Personnel,Empathy, ImageRahim, 2016ServiceReliability, Responsiveness, Assurance, Customisation,QualityEmployees, Facilities, Flight patterns, Passengersatisfaction, Customer loyaltyRose et al., 2016InflightPersonal Attributes, Inflight Service, Flight Safety,ServiceCustomer SatisfactionQuality485www.hrmars.com
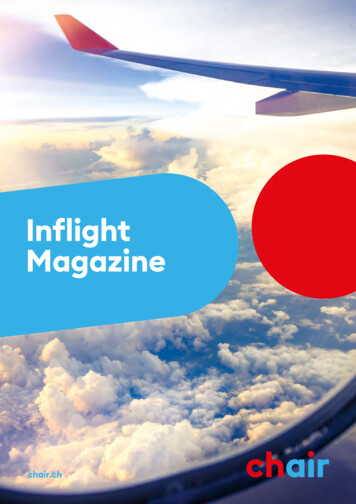
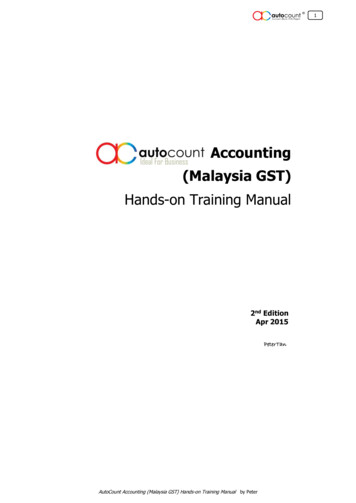
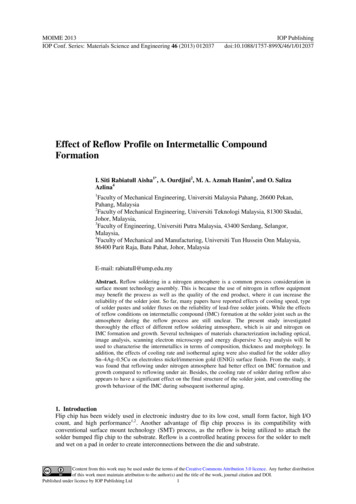
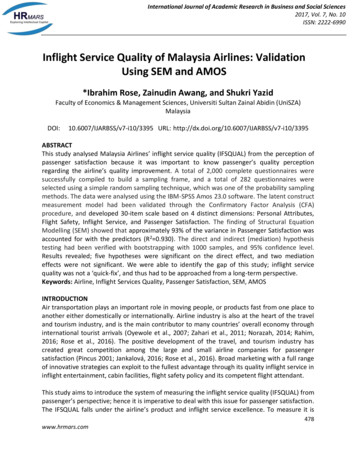
International Journal of Academic Research in Business and Social Sciences2017, Vol. 7, No. 10ISSN: 2222-6990RESULTS & DISCUSSIONThis study applied the two-steps approach of modelling and analysing the structural modelnamely Confirmatory Factor Analysis (CFA) and SEM. According to Hair et al. (2014), Awang(2015), and Byrne (2016) the measurement model of latent constructs must pass three types ofvalidity: (1) Construct Validity was assessed through Fitness Indexes of the MeasurementModel; (2) Convergent Validity was assessed through Average Variance Extracted (AVE); (3)Discriminant Validity was assessed through the Discriminant Validity Index Summary. As for thereliability, it was assessed though the Composite Reliability (CR). The CR replaced the InternalReliability measurement using Cronbach’s Alpha as this study was analysing using SEM, and thelatent construct was considered valid when fitness indexes achieved the three Model Fitcategories (see Table 3) (Awang, 2014; 2015; Hair et al., 2014; 2015; Bakar & Afthanorhan,2016; Byrne, 2016; Hoque et al, 2017).We simplified the analyses by converting the second order construct into first order by takingthe composite mean for every sub-construct. Afthanorhan et al. (2014), Hair et al. (2014),Awang (2015), Byrne (2016), and Hoque et al. (2017) mentioned that prior to modelling thestructural model and executing SEM, researcher must prove that all constructs involved in themodel were discriminant of each other, or they were not highly correlated especially betweenthe exogenous constructs; if the two exogenous constructs were highly correlated (correlationcoefficient greater than 0.85), then a serious problem called Multi-collinearity occurred.Following the above theory by them, the two exogenous (Personal Attributes and Flight Safety),mediation (Inflight Service), and endogenous (Passenger Satisfaction) constructs in the modelbecame second-order constructs with certain number of sub-constructs and every subconstruct was measured using certain number of items from the questionnaire.Pooled Measurement Model for All ConstructsFor this procedure, all constructs were combined together and executed the Pooled-CFA;the conversion was carried out by computing a single composite mean for items in every subconstruct of the measurement model (Afthanorhan et al., 2014; Awang, 2015; Byrne, 2016;Bakar & Afthanorhan, 2016; Hoque et al, 2017). Figure 1 demonstrated the initial measurementmodel for each construct in the Pooled Measurement model.In Figure 1, the fitness indexes did not meet the required level as proposed by Afthanorhan etal. (2014), Hair et al. (2014), Awang (2015), Byrne (2016), and Hoque et al. (2017); in order toremedy this problem, they suggested researcher must inspect the poor factor loading items,and remove them from the model (one item at a time from each sub-construct and re-analysethe CFA); the process continued until the measurement model achieved the threshold values.We identified eight poor factor loading items less than 0.6 namely IFSQ1 (0.17), IFSQ5 (0.20),IFSQ6 (0.23), IFSQ10 (0.33), PAX7 (0.37), PAX1 (0.53), PAX2 (0.54), and PAX6 (0.57). These pooritems had caused the model to be unfit. In Figure 2, the Fitness Indexes readings were good andfit after several procedures, and the significance level for coefficients was p 0.001, see Table 3.486www.hrmars.com
International Journal of Academic Research in Business and Social Sciences2017, Vol. 7, No. 10ISSN: 2222-6990! Figure 1: The Initial Measurement Model!487www.hrmars.com
International Journal of Academic Research in Business and Social Sciences2017, Vol. 7, No. 10ISSN: 2222-6990Figure 2: The Final Measurement Model after PAX6 was removed!Assessment for Validity and ReliabilityAfter few CFA procedures, the measurement model results were as follows:a) Construct validity (Table 3). The fitness indexes as the constructs had achieved therequired level (Afthanorhan et al., 2014; Awang et al., 2015; Byrne, 2016; Hoque et al.,2017).488www.hrmars.com
International Journal of Academic Research in Business and Social Sciences2017, Vol. 7, No. 10ISSN: 2222-6990Table 3: Construct ValidityModel FitCategoryResultAbsolute FitRMSEA 0.06IndexGFI0.86IncrementalFit IndexParsimoniousFit IndexFit CriteriaRange 0.05 to 0.1Close to 0.95AGFI0.83Close to 0.95CFI0.94Close to 0.95NFI0.89Close to 0.95TLI0.94Close to 0.95ChiSq/ 1.885dfBelow 5.00ReferenceAcceptableHu & Bentler, 1999;Awang, 2015; Byrne, 2016Jöreskog & Sörbom, 1996;Awang, 2015; Byrne, 2016Jöreskog & Sörbom, 1996;Awang, 2015, Byrne, 2016Hu & Bentler, 1999;Awang, 2015, Byrne, 2016Hu & Bentler, 1999;Awang, 2015, Byrne, 2016Hu & Bentler, 1999;Awang, 2015, Byrne, 2016Hair et al., 2014;Awang, 2015, Byrne, 2016YesYesYesYesYesYesYesNB: The indexes in bold were recommended since they were frequently reported in literature (Awang, 2015).b) Convergent validity. All items in measurement model were statistically significant. Theconvergent validity was also verified by computing AVE and CR (Table 4) for every construct.Afthanorhan et al. (2014), Hair et al. (2014), Awang (2015), Byrne (2016), and Hoque et al.(2017) agreed that the values of AVE should not less than 0.5, and CR should not less than 0.6;low result could affect low AVE and CR; as both were computed based on the factor loading.Table 4: AVE and CR for the main constructsConstructComponentFactor LoadingPersonal Attributes llsFlight ht ice0.83SatisfactionSatisfactionSafety .84C) Discriminant validity (Table 5). This study model was free from redundant items. Thediagonal values in bold were the square root of AVE, which was higher than the values in itsrow and column, thus the discriminant validity had achieved the required level (Afthanorhan et489www.hrmars.com
International Journal of Academic Research in Business and Social Sciences2017, Vol. 7, No. 10ISSN: 2222-6990al., 2014; Hair et al., 2014; Awang, 2015; Awang et al., 2015; Byrne, 2016). While other valueswere the
This study analysed Malaysia Airlines' inflight service quality (IFSQUAL) from the perception of passenger satisfaction because it was important to know passenger's quality perception regarding the airline's quality improvement. A total of 2,000 complete questionnaires were successfully compiled to build a sampling frame, and a total of .