Transcription
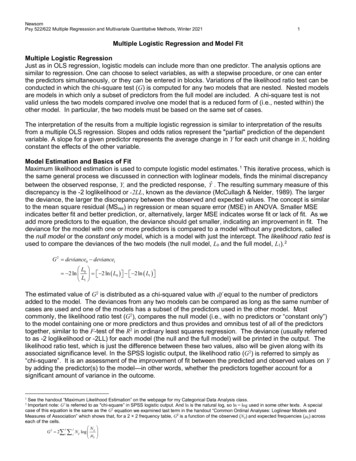
NewsomPsy 522/622 Multiple Regresssion and Multivariate Quantitative Methods, Winter 20211Multiple Logistic Regression and Model FitMultiple Logistic RegressionJust as in OLS regression, logistic models can include more than one predictor. The analysis options aresimilar to regression. One can choose to select variables, as with a stepwise procedure, or one can enterthe predictors simultaneously, or they can be entered in blocks. Variations of the likelihood ratio test can beconducted in which the chi-square test (G) is computed for any two models that are nested. Nested modelsare models in which only a subset of predictors from the full model are included. A chi-square test is notvalid unless the two models compared involve one model that is a reduced form of (i.e., nested within) theother model. In particular, the two models must be based on the same set of cases.The interpretation of the results from a multiple logistic regression is similar to interpretation of the resultsfrom a multiple OLS regression. Slopes and odds ratios represent the "partial" prediction of the dependentvariable. A slope for a given predictor represents the average change in Y for each unit change in X, holdingconstant the effects of the other variable.Model Estimation and Basics of FitMaximum likelihood estimation is used to compute logistic model estimates. 1 This iterative process, which isthe same general process we discussed in connection with loglinear models, finds the minimal discrepancybetween the observed response, Y, and the predicted response, Yˆ . The resulting summary measure of thisdiscrepancy is the -2 loglikelihood or -2LL, known as the deviance (McCullagh & Nelder, 1989). The largerthe deviance, the larger the discrepancy between the observed and expected values. The concept is similarto the mean square residual (MSres) in regression or mean square error (MSE) in ANOVA. Smaller MSEindicates better fit and better prediction, or, alternatively, larger MSE indicates worse fit or lack of fit. As weadd more predictors to the equation, the deviance should get smaller, indicating an improvement in fit. Thedeviance for the model with one or more predictors is compared to a model without any predictors, calledthe null model or the constant only model, which is a model with just the intercept. The likelihood ratio test isused to compare the deviances of the two models (the null model, L0 and the full model, L1). 2G 2 deviance0 deviance1 L 2 ln 0 2 ln ( L0 ) 2 ln ( L1 ) L1 The estimated value of G2 is distributed as a chi-squared value with df equal to the number of predictorsadded to the model. The deviances from any two models can be compared as long as the same number ofcases are used and one of the models has a subset of the predictors used in the other model. Mostcommonly, the likelihood ratio test (G2), compares the null model (i.e., with no predictors or “constant only”)to the model containing one or more predictors and thus provides and omnibus test of all of the predictorstogether, similar to the F-test of the R2 in ordinary least squares regression. The deviance (usually referredto as -2 loglikelihood or -2LL) for each model (the null and the full model) will be printed in the output. Thelikelihood ratio test, which is just the difference between these two values, also will be given along with itsassociated significance level. In the SPSS logistic output, the likelihood ratio (G2) is referred to simply as“chi-square”. It is an assessment of the improvement of fit between the predicted and observed values on Yby adding the predictor(s) to the model—in other words, whether the predictors together account for asignificant amount of variance in the outcome.See the handout “Maximum Likelihood Estimation” on the webpage for my Categorical Data Analysis class.Important note: G2 is referred to as "chi-square” in SPSS logistic output. And ln is the natural log, so ln log used in some other texts. A specialcase of this equation is the same as the G2 equation we examined last term in the handout “Common Ordinal Analyses: Loglinear Models andMeasures of Association” which shows that, for a 2 2 frequency table, G2 is a function of the observed (Nij) and expected frequencies (µij) acrosseach of the cells. N IJG 2 2 i j N ij log ij µ ij 12
NewsomPsy 522/622 Multiple Regresssion and Multivariate Quantitative Methods, Winter 20212Although the likelihood ratio test is usually used for an omnibus test of all the predictors together, a specialcase of the likelihood ratio test is with just one variable added to the model and so gives test of thesignificance of that one predictor. That is the same hypothesis tested by the Wald ratio described above. Athird alternative, the score test (or Lagrange multiplier test) is also based on partial derivatives of thelikelihood function evaluated at Β0. The score test is not printed in most software packages for individualparameters and is not reported very often by researchers. The Wald, likelihood ratio, and score tests willusually give a very similar result, and are in fact asymptotically equivalent (Cox & Hinkley, 1972), but thelikelihood ratio and score test tend to perform better in many situations (e.g., Hauck & Donner, 1977). TheWald test assumes a symmetric confidence interval whereas the likelihood ratio does not. Although rarelysee outside of texts, the Wald test can be computed for a set of variables, but the likelihood ratio is nearlyalways the method of testing a set of variables added to the model.Alternative Measures of FitClassification Tables. Most regression procedures print a classification table in the output. The classificationtable is a 2 2 table of the observed values on the outcome (e.g., 0 ”no”, 1 ”yes) and then the valuespredicted for the outcome by the logistic model. Then the percentage of correctly predicted values (percentof 0s and 1s) correctly predicted by the model is given. Some criteria for deciding what is a correctprediction is need, and by default the program will use the probability that Y 1 exceeding .5 as “correct.”Although authors often report percent correct from the classification as an indicator of fit, it has an inherentproblem in the use of .5 as an arbitrary cutoff for correct that is influenced by the base rate value of theprobability that Y 1 (see Box 13.2.8 in the Cohen, Cohen, West, & Aiken, 2003 text). So, I tend not to usethe percent correctly classified and tend to take it with a grain of salt when other researchers report it.Hosmer-Lemeshow Test. The likelihood ratio test (G2) does not always perform well (Hosmer & Lemeshow,1980; McCullagh 1985; Xu, 1996), especially when data are sparse. The term “sparse” refers to acircumstance in which there are few observed values (and therefore few expected values) in the cellsformed by crossing all of the values of all of the predictors. An alternative test developed by Hosmer andLemeshow (1980) is commonly printed with logistic regression output. The Hosmer-Lemeshow test isperformed by dividing the predicted probabilities into deciles (10 groups based on percentile ranks) andthen computing a Pearson chi-square that compares the predicted to the observed frequencies (in a 2 10table). Lower values (and nonsignificance) indicate a good fit to the data and, therefore, good overall modelfit. Unfortunately, even Hosmer and Lemeshow (2013) do not recommend using their test unless the samplesize is at least 400 (when sparseness may not be as much of a problem) because of insufficient power; andit has other potential problems (Allison, 2014; Hosmer, Hosmer, Le Cessie, & Lemshow, 1997). There areseveral other potential alternative fit tests, such as the standardized Pearson test or the Stukel test, whichare not widely available in software packages and appear to be less often used by researchers (see Allison,2014 for an excellent summary), some of which may also require larger sample sizes for sufficient power(Hosmer & Lemeshow, 2013).Information Criteria. You will also hear about several absolute fit indices, such as the Akaike informationcriteria (AIC) or Bayesian information criteria (BIC), which can be useful for comparing models (lower valuesindicate better fit). (SPSS does not print several other global fit indices that are sometimes used byresearchers testing logistic regression models). The AIC and BIC do not have values that are informative bythemselves because they are fairly simply derived from the deviance using adjustments for sample size andnumber of predictors. Because the deviance itself depends on the size of the model, variances of thevariables involved, and other factors, it has no possible standard of magnitude and thus neither does theAIC or BIC (there are no statistical tests for these indices and no cutoff for what constitutes a good fit).Indices like the AIC and BIC are occasionally used, however, to try to compare non-nested models (modelsthat do not have the same cases and where one model has a subset of predictors from the other model).When models are nested, the likelihood ratio (difference in deviances) can be used as a statistical test (chisquare value), so there is not really a need for the AIC or BIC in that case. The AIC and BIC are perhapsthe most commonly used but there are several other similar indices, such as the AICC and aBIC. Theequations below show the AIC and BIC are fairly simply derived of the deviance (-2LL value), shown belowwith p as the number of predictors and n as the sample size.
NewsomPsy 522/622 Multiple Regresssion and Multivariate Quantitative Methods, Winter 20213 2 LL 2 ( p 1)AIC 2 LL log ( n ) ( p 1)BIC R2 for Logistic Regression. In logistic regression, there is no true R2 value as there is in OLS regression.However, because deviance can be thought of as a measure of how poorly the model fits (i.e., lack of fitbetween observed and predicted values), an analogy can be made to sum of squares residual in ordinaryleast squares. The proportion of unaccounted for variance that is reduced by adding variables to the modelis the same as the proportion of variance accounted for, or R2.2Rlogistic 2 LLnull 2 LLk 2 LLnull2 ROLSSStotal SS residual SS regression SStotalSStotalWhere the null model is the logistic model with just the constant and the k model contains all the predictorsin the model.There are a number of pseudo-R2 values that have been proposed using this general logic, including theCox and Snell (Cox & Snell, 1989; Cragg & Uhler, 1970; Maddala,1983), Nagelkerke (1991), McFadden(1974), and Tjur (2009) indexes, among others (see Allison, 2014, for a review). As two common examples,consider the following:Cox & Snell Pseudo-R2 2 LLnull R2 1 2 LLk 2/ nBecause the Cox and Snell R-squared value cannot reach 1.0, Nagelkerke modified it. The correctionincreases the Cox and Snell version to make 1.0 a possible value for R-squared.Nagelkerke Pseudo-R22/ n 2 LLnull 1 2 LLk R2 2/ n1 ( 2 LLnull )At this point, there does not seem to be much agreement on which R-square approach is best (seehttps://statisticalhorizons.com/r2logistic for a brief discussion and references), and researchers do not seemto report any one of them as often as they should. My recommendation for any that you choose to use, donot use them as definitive or exact values for the percentage of variance accounted for and to make somereference to the “approximate percentage of variance accounted for”.Tests of a Single PredictorIn the case of a simple logistic regression (i.e., only a single predictor), the tests of overall fit and the tests ofthe predictor test the same hypothesis: is the predictor useful in predicting the outcome? The Wald test isthe usual test for the significance of a single predictor (is Bpop 0? or is ORpop 1.0?). 3 Thus, for simplelogistic both the likelihood ratio for the full model and the Wald test for the significance of the predictor testthe same hypothesis. A third alternative is the score test (sometimes referred to as the “LagrangeMultiplier” test).The likelihood ratio, Wald, and score test of the significance of a single predictor are said to be“asymptotically” equivalent, which means that their significance values will converge with larger N. WithAlthough the Wald test can theoretically be used to test multiple coefficients simultaneously (see Long, 1997, p. 90), it is generally only used inpractice and by most software programs as a test of a single coefficient (given either as a z-test or chi-square test).3
NewsomPsy 522/622 Multiple Regresssion and Multivariate Quantitative Methods, Winter 20214small samples, however, they are not likely to be equal and may sometimes lead to different statisticalconclusions (i.e., significance). The likelihood ratio test for a single predictor is usually recommended bylogistic texts as the most powerful (although some authors have stated that neither the Wald nor the LR testare superior). Wald tests are known to have low power (higher Type II errors) and can be biased whenthere is insufficient data (i.e., expected frequency is too low) for each category or value of X. However, Ihave seen very few researchers use the likelihood ratio test for tests of individual predictors. One reasonmay be that the statistical packages do not provide this test for each predictor, making hand computationsand multiple analyses necessary. This is inconvenient, especially for larger models. If the analysis has alarge N, researchers are likely to be less concerned about the differences. There seems to be less knownabout the performance of the score test (cf. Hosmer, Hosmer, Le Cessie, & Lemshow, 1997; Xie,Pendergast, & Clarke, 2008) at least across a range of conditions, and it is not currently available in manysoftware packages for individual predictors (although it shows up under "variables not in the equation" inSPSS).References and Further ReadingAllison, P. D. (2014). Measures of fit for logistic regression. SAS Global Forum, Washington, DC.Cox, D. R., & Hinkley, D. V. (1974). Theoretical Statistics. London: Chapman & Hall.Hauck Jr, W. W., & Donner, A. (1977). Wald's test as applied to hypotheses in logit analysis. Journal of the american statisticalassociation, 72(360a), 851-853.Hosmer Jr, D. W., Lemeshow, S., & Sturdivant, R. X. (2013). Applied logistic regression, third edition. New York: Wiley.Hosmer, D. W., & Lemesbow, S. (1980). Goodness of fit tests for the multiple logistic regression model. Communications in statistics-Theory andMethods, 9, 1043-1069.Hosmer, D. W., Hosmer, T., Le Cessie, S., & Lemeshow, S. (1997). A comparison of goodness-of-fit tests for the logistic regression model. Statisticsin medicine, 16, 965-980.Long, J.S. (1997). Regression models for categorical and limited dependent variables. Thousand Oaks, CA: Sage.McCullagh, P. (1985). On the asymptotic distribution of Pearson’s statistics in linear exponential family models. International Statistical Review 53,61–67.McCullagh, P., & Nelder, J. A. (1989). Generalized linear models (Vol. 37). CRC press.Menard, S. (2010). Logistic regression: From introductory to advanced concepts and applications, second edition. Sage Publications.O’Connel, A.A. (2006). Logistic regression models for ordinal response variables. Thousand Oaks: Sage. QASS #146.Xie, X. J., Pendergast, J., & Clarke, W. (2008). Increasing the power: A practical approach to goodness-of-fit test for logistic regression models withcontinuous predictors. Computational Statistics & Data Analysis, 52(5), 2703-2713.Xu, H. (1996). Extensions of the Hosmer-Lemeshow goodness-of-fit test (Doctoral dissertation, University of Massachusetts at Amherst).
NewsomPsy 522/622 Multiple Regresssion and Multivariate Quantitative Methods, Winter 20215Summary Table of Statistical Tests in Logistic RegressionOverall Model FitDevianceLikelihood Ratio TestAlternative TermsStatistical DescriptionNotesD, Deviance (ordeviance chi-square),-2LL, -2 log likelihoodG, “Chi-square” inSPSS, LR test, nestedmodel chi-square testBased on minimization of themaximum likelihood functionCan be computed for any model, distributedas chi-square valueG χ 2 2 LLnull ( 2 LLk )Comparison of null or constant only modelto the full model which includes thepredictors. Can be used to compare anytwo “nested” models.or equivalently, L G χ 2 2 ln null Lk Hosmer & LemeshowGoodness of Fit TestNonePearson chi-square is used in aspecial procedure where a continuouspredictor is categorized into severalgroupsPsuedo R2sCox & Snell,Nagelkerke, RL2,McFadden, TjurSee formulas on previous page.None, occasionallypresented as a z-testrather than chi-squareLagrange Multiplier test(LM)B2SEB2Predictor SignificanceWald Chi-squareScore TestLikelihood Ratio TestSee above discussionUses first derivative of likelihoodfunction for B 0 (the Wald is based onthe second derivative).Same computation as in the abovesection but the “null model” isreplaced by a model with one fewerpredictors. The difference in fit is thena test of a single predictor.Can provide improved estimates of fit whenthe sample size is large. With smallsamples (with n 400, according toHosmer & Lemeshow, 2000), its use is notrecommended.There is not universal consensus on whichis best and there are others that have beenproposed. Use as a supplement to the LRand present as "approximate" proportion ofvariance accounted for. Be prepared tocalculate someone else's favorite value.Most commonly used test of significance ofan individual predictor (Bpop 0), distributedas chi-square with one dfNot very commonly reported and notcurrently available in SPSS for individualpredictors.Compares model with and without aparticular predictor, but, in SPSS, tests of asingle predictor's significance must beobtained through hierarchical (nested)model comparisons.
associated significance level. In the SPSS logistic output, the likelihood ratio (G 2) is referred to simply as "chi-square". It is an assessment of the improvement of fit between the predicted and observed values on Y by adding the predictor(s) to the model—in other words, whether the predictors together account for a


