Transcription
Fragile FamiliesCensus Tract MeasuresRestricted Use Data AppendageBaseline, 1, 3, 5, 9, and 15 year WavesJanuary 2018Bendheim-ThomanCenter for Research on Child WellbeingWallace HallPrinceton UniversityPrinceton, NJ 08544http://crcw.princeton.eduColumbia Population Research Center1255 Amsterdam Avenue, Room 715Columbia UniversityNew York, NY 10027http://cupop.columbia.edu/Prepared by staff in the Bendheim-Thoman Center for Research on Child Wellbeing (CRCW),Princeton University. For more information about Fragile Families, please visit our web site athttp://fragilefamilies.princeton.edu/ or email ffdata@princeton.edu
DATA APPENDAGE OVERVIEWThe Fragile Families Census Tract Measures Restricted Use Data Appendage(ffgeo3 all pub1.dta) contains Census tract-level contextual data that correspond to theresidence of respondents at Baseline and during the 1, 3, 5, 9, and 15-year follow-up waves ofthe Fragile Families and Child Wellbeing Study (FFCWS). The current data appendage is anupdate that combines the previously released data appendages for Baseline through year 9,(ffgeo all pub1.dta and ffgeo2 all pub1.dta) and a new appendage for the 15-year data. Thecontextual variables included in the current data appendage are identical to the contextualvariables that appeared in the previous data appendages. Variables consist of aggregatecharacteristics on individuals, families, households, and housing units within Census tracts.Contextual data for waves 1-5 correspond to the current residence of the biological mother andbiological father at the wave(s) in which they were interviewed. Contextual data for wave 6correspond to the current residence of the focal child’s primary caregiver (PCG) -- biologicalmother, biological father, other family, or other non-family caregivers.FILE LAYOUTThe file contains 4,898 observations (one per family), sorted by idnum.VARIABLE NAMING CONVENTIONContextual variable names are 7-14 characters long. The first 3 characters contain thevariable prefix. The next 4-5 characters contain the variable suffix, which includes anabbreviated description of the contextual data. The last 4 characters for the 15-year data, indicateif the variable was constructed from 2015 ACS 5-year estimates, the 2010 Census or the 2000Census. The variable names are constructed as follows:PositionCharacterIndicates1tCensus tract-level measure (all variables in appendage)2mfpMother residenceFather residencePrimary Caregiver (PCG) residence (15-year)3123456Baseline InterviewFirst follow-up interview (1-year)Second follow-up interview (3-year)Third follow-up interview (5-year)Fourth follow-up interview (9-year)Fifth follow-up interview (15-year)4-8**** (e.g., phisp)Contextual data (e.g., Percent of population Hispanic)9-14cen00cen10acs15Data source – 2000 Decennial CensusData source – 2010 Decennial CensusData source – American Community Survey, 2011-2015 5year estimatesFragile FamiliesCensus Tract MeasuresRestricted Use Data Appendage2ffgeo3 all pub1.dtaJanuary 2018
For example, variable tp6pfrgn acs15: the prefix (position 1-3) tp6 refers to a Census tractlevel measure (t) corresponding to the PCG’s residence (p) at the sixth follow-up interview(15- year) (6); the suffix (pfrgn acs15) refers to percent of population foreign born, as foundin the ACS 2015 5-year estimates data.GEOGRAPHYU.S. Census tractsAll contextual data are reported at the Census tract level and correspond to the currentresidence of respondents at each wave. Census tracts are statistical subdivisions of a county,averaging about 4,000 inhabitants, and designed by the U.S. Census Bureau to be relativelypermanent over time. All Census tracts that appear in waves 1-5 use 2000 Census tract boundarydefinitions; tracts in wave 6 use the 2010 Census tract boundary definitions. For moreinformation, see: https://www.census.gov/geo/Geo-coding processThe primary residential addresses reported by focal children’s biological mothers andfathers or PCG at each wave were used to geo-code respondents into U.S. Census tractsaccording to 2000 Census tract boundary definitions for waves 1-5, and U.S. Census tractsaccording to the 2010 Census tract definitions for wave 6.Pseudo Census tract identifiersTo protect the privacy of respondents, the actual state, county, and Census tract ofresidence are not included in the current data appendage. However, it includes pseudo Censustract identifier variables (t*tract). These variables do not represent actual U.S. Census tracts, butare used to indicate which respondents live in the same Census tract. The pseudo Census tractidentifiers are consistent between mothers and fathers, and across waves and contextual dataappendages for waves 1 through 5. Therefore, they can be used as an indicator of whether thefocal children’s mothers and fathers resided in the same Census tract from one survey wave to thenext.The 2010 pseudo tract identifiers (tp6tract cen10) are not consistent with those inprevious waves. Boundaries of tracts are subject to change between Census years, and the Censusreports tracts where more than 2.5% of the area changed as “substantially changed” tracts. A listof substantially changed tracts may be obtained at https://www.census.gov/geo/mapsdata/data/tract rel download.html. Around 10-15% of the Fragile Families sample resides inthese “substantially changed” tracts.DATA SOURCESU.S. Census BureauContextual data in waves 1-5 included in the current data appendage was obtainedfrom the U.S. 2000 Decennial Census. Data was downloaded fromhttp://factfinder2.census.gov.Contextual data in wave 6 included in the current data appendage was obtained fromthe U.S. 2010 Decennial Census as well as the American Community Survey 2015 5-yearestimates.Fragile FamiliesCensus Tract MeasuresRestricted Use Data Appendage3ffgeo3 all pub1.dtaJanuary 2018
American Community SurveyIn addition to using data from the 2010 Decennial Census, the contextual data forwave 6 includes data from the American Community Survey (ACS) 2015 5-year estimates.The ACS is an annual survey conducted by the Census Bureau, sampling about 3.5 millionhousing unit addresses in every county in the nation. It is designed to provide more up-to-dateinformation about the population at a local level between each decennial census. The 5-yearestimates used in wave 6 are based on data gathered between January 1, 2011 and December31, 2015. The 5-year estimates are preferable to the one-year ACS estimates because they givea more precise measure for small geographies, like Census tracts.Data from the ACS is used in place of some Census data due to the change in Censusdata reporting. From 1970-2000, the Census had both a long- and short-form questionnaire.Every household received the short-form, and a sample received the long-form questionnaire.The long-form questionnaire included questions about educational attainment, income,employment, wealth, and country of origin. The 2010 Census did away with the long-formquestionnaire, opting instead for a shorter, 10-question survey sent to all households. Since2010, the ACS has gathered the data previously reported in the Census long-formquestionnaire.Variables found in both the 2010 Census and the 2015 ACS are both included in thecurrent appendage. Those variables found in the ACS include the suffix “ acs15”, and theidentifier “ACS 2015 5-year estimates” in the variable label.For the 2015 ACS poverty level variables (p50pl-p200p), each level was reported bythe ACS in age groups (i.e. under 6, 6 to 11, 12 to 17, etc.), while that same data was simplyreported at each ratio level in the 2000 Census. To get a percentage of the total population ateach poverty level, each age group was summed at each poverty level and divided by the totalpopulation of each tract.The 2015 ACS variable for median rent as a percent of income (mrphi) had values of10.0- and 50.0 , which were recoded to 9.9 and 50.1 respectively.Additional information about the ACS and multi-year estimates is available . Data was downloaded fromhttp://factfinder2.census.gov.Random “noise”Some random noise has been introduced into the data to ensure that respondents’ Censustracts cannot be identified on the basis of the characteristics provided in this file. This noiseshould have no impact on analyses.MISSING VALUESAll missing values for contextual variables are coded using similar conventions found inother FFCWS data files. More specifically, the following three missing codes are used:-9 Not in waveThe respondent did not participate in interview/assessment-7 N/AThe respondent participated in interview/assessment;however, the respondent’s residence could not be determined.-3 MissingThe respondent participated in interview/assessment and theresidence was determined; however, contextual data is unavailable.Fragile FamiliesCensus Tract MeasuresRestricted Use Data Appendage4ffgeo3 all pub1.dtaJanuary 2018
ACKNOWLEDGEMENTSThe 5- and 9-year file construction work was supported by Mary Clare Lennon andAnthony Buttaro at City University of New York, and the Built Environment and Health Projectat Columbia University.Fragile FamiliesCensus Tract MeasuresRestricted Use Data Appendage5ffgeo3 all pub1.dtaJanuary 2018
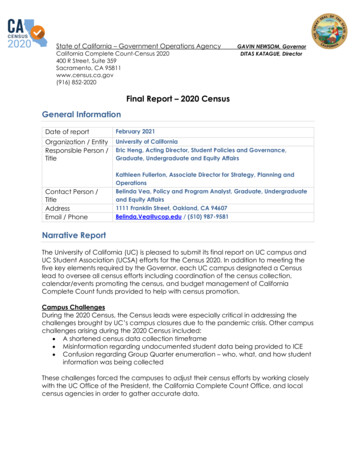
DATA DICTIONARYNote: Variable names listed in the data dictionary exclude the 4-character length prefixes. Please refer to the Variable NamingConvention section for more information about variable prefixes.U.S. Census20001U.S. Census 2010ACS 2015 5-yearEstimates2Percent of population HispanicXXXpwhtePercent of population non-Hispanic WhiteXXXpblckPercent of population non-Hispanic BlackXXXpaminPercent of population non-Hispanic AmericanIndian/Native AmericanXXXpasiaPercent of population non-Hispanic AsianXXXppaciPercent of population non-Hispanic NativeHawaiian/Pacific IslanderXXXpothrPercent of population non-Hispanic other raceXXXpfrgnPercent foreign bornXVariableDescriptionphisppchbrpfhhrPercent of female population of childbearingage (15-49)Percent of family households with kids 18headed by femalesXXXXXXXXXmpphhMean number of persons per householdXpschPercent of population 16-19 enrolled in schoolXXp25hsPercent of 25 population with HS educationXXp25bPercent of 25 population with bachelor's orhigherXXpempPercent of civilian labor force (16 ) employedX12Data from the U.S. Decennial Census 2000 used in waves 1-5.Data from the U.S. Decennial Census 2010 and ACS 2015 5-year Estimates used in wave 6.XX
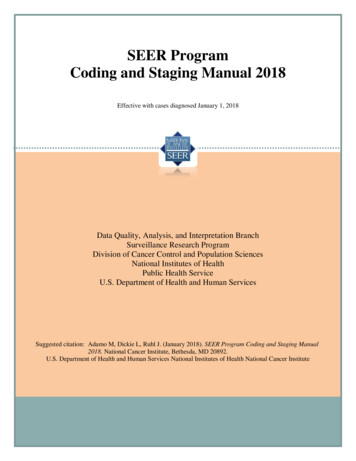
VariableDescriptionU.S. Census 2000U.S. Census 2010ACS 2015 5-year EstimatespuempPercent of civilian labor force (16 )unemployedXXXpvachPercent of housing units vacantXXXpbf40Percent of housing units built before 1940XprentpnophpplumPercent of occupied housing units renteroccupiedPercent of occupied housing units withoutphone servicePercent of housing units lacking completeplumbingXXXXXXXXrphiMedian gross rent as percent of HH incomeXXmrentMedian monthly gross rentXXmhvalMedian housing valueXXmyearMedian year builtXXppubaPercent of households on public assistanceXXpfbplPercent of families below poverty levelXXpb10kPercent of families with income cent of families with income 10K to 14,999Percent of families with income 15K to 24,999Percent of families with income 25K to 34,999Percent of families with income 35K to 49,999Percent of families with income 50K to 74,999Percent of families with income 75K to 99,999
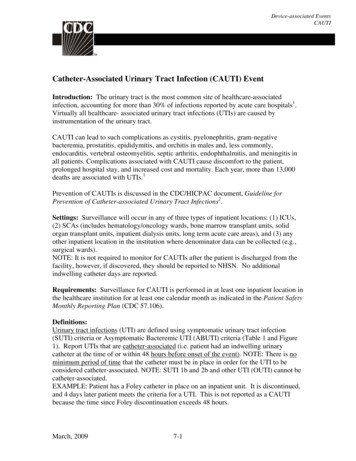
VariableDescriptionp100kPercent of families with income 100K to 149,999XXp150kPercent of families with income 150K XXmhincMedian HH 9pp174pp184pp199pp200pPercent of persons with income less than .50 ofpoverty linePercent of persons with income .50 to .74 ofpoverty linePercent of persons with income .75 to .99 ofpoverty linePercent of persons with income 1.00 to 1.24 ofpoverty linePercent of persons with income 1.25 to 1.49 ofpoverty linePercent of persons with income 1.50 to 1.74 ofpoverty linePercent of persons with income 1.75 to 1.84 ofpoverty linePercent of persons with income 1.85 to 1.99 ofpoverty linePercent of persons with income 2.00 & overpoverty lineU.S. Census 2000U.S. Census 2010ACS 2015 5-year Estimates
DATA DICTIONARY Note: Variable names listed in the data dictionary exclude the 4-character length prefixes.Please refer to the Variable Naming Convention section for more information about variable prefixes. Variable Description U.S. Census 20001 2 U.S. Census 2010 ACS 2015 5-year Estimates phisp Percent of population Hispanic X X X