Transcription
case studyAnalyses of Diesel Use for Mine Hauland Transport OperationsFortescue Metals Groups Ltd Downer EDI Mining Pty Ltd Leighton Contractors Pty LimitedDiesel is a significant energy source for the miningindustry. It is used for material transport processessuch as the hauling of ore and overburden.Trucks and trains constitute one of the keydiesel‑using activities.The understanding of the energy efficiency ofa haul truck or locomotive should not be limitedto the analysis of vehicle-specific parameters.Mining companies can often find greater benefitsby expanding the analysis to include many otherfactors that affect the amount of energy usedacross an entire fleet, including road gradientand elevation.The rigorous approach required by the EnergyEfficiency Opportunities (EEO) Program enablesa corporation to determine the energy savingsfrom projects and the cost of implementing theseprojects. A systematic and thorough approachfocuses efforts on the most energy intensiveprocesses, the key energy and material flows inthe process and where opportunities for increasedefficiency are likely to lie.As EEO takes a data-driven approach toidentifying energy-savings opportunitiesby collecting and analysing energy use andproduction data (including the factors impactingon both), it can enable companies to viewcommon processes from new perspectivesand identify additional opportunities.This Case Study aims to provide miningcompanies with examples of comprehensiveanalyses of diesel use in mining operations usedby Fortescue Metals Group Ltd, Downer EDIMining Pty Ltd and Leighton Contractors PtyLimited. It provides several examples of analyticaltechniques that have been used in the miningsector to develop a rigorous understandingof energy and material flows, and enable theidentification of energy savings for haul truckoperations and rail operations.This Case Study demonstrates analyses of dieseluse in trucks by trending energy data over time,development of models and simulations, useof indicators, and benchmarking, includingtheoretical benchmarking. It also shows how anEnergy-Mass Balance (EMB) has been appliedto rail operations. All of these processes can beused by companies to understand energy use,manage energy performance, improve businessdecision making and identify potential energyefficiency opportunities.Diesel Use in Mining OperationsAs of 2008–09, 40 reporting EEO companies inthe mining sector consumed 308 PJ of energyof which 52.5 PJ was diesel (17%) for haulageand electricity generation. These EEO miningcompanies had identified 3 PJ (or 6%) worthof savings directly related to diesel use. Thesecompanies adopted 66% of these identifiedsavings in diesel use.
2Energy Efficiency Opportunities Case StudyTruck Operations in MiningResults at a glanceFortescue Metals Group identified and quantifiedthe energy costs associated with stopping haultrucks unnecessarily, which equated to 361 kL(13,935 GJ)1 of diesel per annum for the Caterpillar777 fleet and 407 kL (15,710 GJ) of diesel perannum for the Terex 3700 AC fleet for a singlestop sign per payload cycle.Trucks are used to haul overburden and ore fromthe pit to a dump site, stockpile or to the nextstage of a mining process. Their use is scheduledin conjunction with other machinery, such asexcavators, loaders and diggers, according tothe site layout and production capacity.Fortescue also found additional savings througha change to the engine control unit of the haultrucks. Modelling showed a 2.3% reduction infuel consumption, with an increase in cycle timeof 1.8%, resulting in a fleet-wide fuel savings of232 kL (8,955 GJ) of diesel per annum.In rail operations, Fortescue found that theinstallation of an automatic start-stop systemwould reduce idle time, with savings estimated at675 kL (26,055 GJ) of diesel per annum. Numericalmodelling also found that savings of between300 kL (11,580 GJ) to 500 kL (19,300 GJ) of dieselcould be achieved by reducing the speed of trainsto reduce waiting times at crossing points.Downer EDI Mining developed performanceindicators that use an ‘equivalent flat haul’calculation to account for elevation changeson a specific mine route. The indicators providea more consistent measure of true energyperformance, enabling the company to trackenergy intensity over time. The Commodoreopen-cut coal mine in South East Queenslandhas been used as the pilot site for energyefficiency improvements at DEDIM. The energyintensity of the Commodore mine has improvedby 18.2% over five years.Photo courtesy of Downer EDI Mining Pty LtdTrucks use a significant amount of diesel, and areexpensive to purchase and maintain. Operatingprocedures influence energy use and maintenancecosts. Truck velocity, especially cornering speeds,braking patterns and road surface characteristicscan affect tyre wear and replacement costs.In open cut mining, many parameters can affect theefficiency of the fleet, such as:Leighton Contractors developed a Best TruckRatio model to evaluate and benchmark theefficiency of fleet operations across a single siteand multiple operations, where the nature of thework undertaken varied greatly. Mine plan and mine layout Speed, payload and cycle time Tyre wear and rolling resistance Age and maintenance of the vehicles Dump site designThis model provides an indication of how efficienttheir fleet is in comparison with what is practicallyand realistically possible. It is providing a rigorousanalytical tool which Leighton is using to supportdecision making processes. Idle time Engine operating parameters and transmissionshift patternsFortescue Metals Group, Downer EDI Mining, andLeighton Contractors, have each developed athorough analytical method to investigate energyuse in their haul truck operations.1All fuel conversions reference the Department of ClimateChange and Energy Efficiency, National GreenhouseAccounts (NGA) Factors, July 2010.
Analyses of Diesel Use for Mine Haul and Transport OperationsEnergy Analysis Of Truck OperationsData collection and measurementThere are several data sources that can be used asinputs to an energy efficiency analysis of haul trucks.Mining companies typically maintain recordsof total diesel use across the mining fleet. Insome cases the fuel consumption of individualtrucks is measured by recording the amount offuel that is filled into each vehicle, while otheroperations simply measure total fuel dispensedto the fleet. Fortescue was able to acquire datafor fuel deliveries to each haul truck from theirfuel management system, and those of theircontractors. These accounting systems arenecessary for compliance with Australia’s diesel fuelrebate legislation. Diesel using EEO corporationscan leverage these record-keeping systems toaddress some of the Key Requirements of theEEO Assessment Framework.Many mining vehicles have onboard datacollection capabilities. Fortescue’s fleet ofCaterpillar 777 trucks used the onboard VitalInformation Management System (VIMS) tocapture information from sensors and controllersthroughout the vehicle, enabling detailedanalysis of vehicle performance and engineoperating conditions.Fortescue worked closely with Caterpillar todevelop a detailed understanding of relevantVIMS parameters. For many of the values recorded,it was important to understand how the VIMSsystem determined when each mode of thepayload cycle started and stopped.In addition to the quantitative data available fromfuel and vehicle systems, Fortescue found it usefulto also gather qualitative information. Many factorsaffect the energy efficiency of the trucks, such as:the diversity of routes; truck utilisation patterns(which can increase the complexity of the analysis);historic information on mine development; siteproduction; and other contextual details thatenable a more comprehensive understanding offuel records and truck utilisation data.3Fortescue Metals GroupThe Fortescue Metals Group Ltd is a rapidlygrowing iron ore company operating inWestern Australia. Fortescue’s Chichesteroperations consist of the Cloudbreak andChristmas Creek sites, which are currentlymining at the rate of 55 million tonnes perannum. With further planned expansions atthe Solomon deposits, Fortescue’s productionis planned to increase to 155 million tonnesper annum by 2013. When the assessmentwas undertaken, Fortescue was predominantlyusing Caterpillar 777 and Terex 3700 haul trucksin these sites, some of which were owned andoperated by mining contractors.Analysis and Opportunity IdentificationThe data drawn from real-time truck data,fuel records, knowledge of the mine plan andproduction cycles, enabled the development ofmodels and simulations which allowed Fortescueto examine the energy use and productivity ofexisting practices, and explore how changeswould affect the efficiency of fleet operations.Truck operating modeFortescue examined the range of fuel consumptionrates, trip distances, vehicle speeds, and otherparameters to understand energy use in differentmodes of operation.The time spent during each mode of operationis presented in Figure 1. There are five modesdefined within a single payload cycle, namely: Travelling while empty Loading Stopped while loaded Travelling while loaded Stopped while emptyThe vertical axis of the graph in Figure 4 illustratesthe amount of time spent in each operating mode,and indicates that the greatest amount of time isspent stopped while empty.
4Energy Efficiency Opportunities Case StudyThe Cost of Stopping a Truck8:00The Fortescue fleet includes Caterpillar andTerex haul trucks. Fortescue worked with bothmanufacturers to model the fuel cost associatedwith stopping and then accelerating a loadedtruck as compared to the truck continuing alongat a constant speed.6:40Time (mm:ss)5:204:002:40The speed and fuel use for the two modelledscenarios is illustrated in Figure 2. The blue tracesin Figure 2 indicate the speed (kph) and fuel use(L) for the vehicle travelling the specified distancewithout stopping, while the red traces indicatethe speed and fuel use for a vehicle that stopsonce while travelling the specified distance.The difference between the two scenarios providedthe estimated fuel savings that could be achievedthrough the elimination of one stop per cycle.1:20StoppedTravelling LoadedStopped LoadingLoadingTravelling Empty0:00Figure 1: Example of Caterpillar 777F operating modes within apayload cycleThis information, combined with the fuel consumptionrate (litres per hour) during each mode of operation,provided a deeper understanding of baselineenergy use and the relationship between fuel useand productivity. The model allowed Fortescueto estimate the results of changes to cycle times,payload, and number of trucks.The analysis of the different modes of operationin the payload cycle allowed Fortescue to identify andevaluate the value of reducing the time stopped whenempty and optimising truck cycles and scheduling.When extrapolated across the entire fleet,Fortescue estimated that removing an unnecessarystop sign from each truck cycle could reduce fuelconsumption by 361 kL (13,935 GJ) per annumacross the Cat 777F fleet, and 407 kL (15,710 GJ)per annum across the Terex 3700 fleet.This knowledge can be integrated into mineplan costing and design processes to improveenergy efficiency along with reductions inmaintenance costs.Fuel use (L)Speed (kph)777F Stop SimulationDistance (m)Stop SpeedStop Fuel UseFigure 2: Caterpillar 777F Stop SimulationNo Stop SpeedNo Stop Fuel Use
Analyses of Diesel Use for Mine Haul and Transport OperationsEngine Control Unit modellingHaul trucks are equipped with an Engine ControlUnit (ECU) that uses an engine map to control therelationship between power, torque and enginespeed. On the Caterpillar 777F haul trucks used byFortescue, an ‘economy mode’ is available whichreduces the power of the vehicle by approximately4.5% for gears 2 and above. A reduction in powerreduces the fuel consumption of the engine, butmay also result in a reduction in productivity.The Caterpillar 777F trucks owned by Fortescuewere delivered with the economy mode availableas an option within the ECU. A technician wasable to set the ECU for economy mode usinga diagnostic computer. Other Caterpillar 777Dtrucks operating at the site, which are ownedby contractors, did not have the economy modeoption available and would require the ECU tobe re-programmed to implement the change.To help make a decision on whether to employeconomy mode on the Cat 777F fleet, Fortescuerequired an understanding of current energyPhoto courtesy of Fortescue Metals Group5use and performance, and the fuel savings andproductivity impact of a change to economy mode.Caterpillar provided Fortescue with modelsimulations for four sample haul loads. The modelcalculated the cycle time (minutes) and fuel use(litres diesel per hour) for both ‘standard’ and‘economy’ modes.The modelling showed that a 2.3% averagereduction in fuel use could be achieved across thefour sample routes, with an increase in cycle timeof 1.8%. When extrapolated across the fleet ofCat 777F trucks, the savings were estimated to be232 kL (8,955 GJ) per annum. It should be notedthat Fortescue’s operations are relatively flat andthis potential opportunity may be less applicableto deeper mining operations2.2Note: This depends on existing energy use profiles andfactors impacting on operations.
6Energy Efficiency Opportunities Case StudyKey Performance Indicators forMine Fleet ApplicationsPurpose of Key Performance Indicators(KPIs)Many industries use Key Performance Indicators(KPIs) to evaluate the performance of abusiness activity. A properly designed KPI willprovide managers with a discrete quantitativeindicator of the status of one or more importantbusiness parameters. The KPI can be assessedcontinuously or periodically, and can be trackedto monitor changes in performance over time.One indicator currently used by the miningindustry is fuel consumption expressed aslitres per bank cubic metre3 (litres/BCM). Thisindicator is easy to calculate, but does not takeinto account the differences between minesites or changes within individual mines (suchas haul routes and distances; increasing dumpheights; pit or underground depths). Given thesignificant contribution of these factors to mineefficiency, litres/BCM is potentially a very limitedperformance indicator and does not capturethe effects of other variables. It can also bemisleading to suggest that a haul fleet’s efficiencyis decreasing due to an increase in litres/BCM. Similarly, a comparison of the litres/BCMfor different mines is potentially meaninglessgiven that a mine with a lower litres/BCM valuemay actually have less efficient operations andhaulage equipment than a mine with a higherlitre/BCM value.Companies should determine the keyperformance indicators that enable an adequateanalysis and management of energy use. Inpractice this may require a set of indicatorsto be developed. To effectively track energyperformance, companies will need to developa framework that adequately considers thevariables affecting operations to provide a fair ornormalised picture of the operation’s energy useand enable potential efficiency improvements tobe identified.3A bank cubic metre (BCM) represents the contentsof a cubic metre of rock in place, before it is drilledand blasted.Downer EDI MiningDowner EDI Mining Pty Ltd (DEDIM), a divisionof the Downer Group, provides contract miningand mine services at 45 sites in Australia.In 2009–10 DEDIM employed almost 3,000people and moved over 121 million bank cubicmetres (BCM) of overburden and product onmine sites.DEDIM is a major provider of integratedcontract mining services for both open-cutand underground mining operations. Besidesoperating and managing mines, key servicesinclude exploration drilling, blasting, crushing,tyre management and rehabilitation. Coal,gold and iron ore are the main commoditiescurrently mined by DEDIM.Energy use (as reported under the EEOprogram) for which the DEDIM business unitwas deemed to have operational control inthe 2009–10 financial year was 0.27 PJ, withthe main energy sources being diesel fuel andbiodiesel B20 – a blend of 20% biodiesel and80% petroleum diesel. The majority of energyis used in mobile fleet and equipment on minesites to transport minerals and waste.DEDIM’s ApproachTo capture the effects of several variables in a singleanalysis, DEDIM developed its own energy andgreenhouse gas (GHG) performance measure – theDowner Energy and Emissions Measure (DEEM).This enables the company to measure and improveits fuel and energy efficiency. It also measuresthe reductions in GHG emissions of its miningoperations. The DEEM considers the sources anddestinations of material mined, together withthe mass and volume of material moved and thefuel used to move the material. DEDIM uses twoseparate indicators; one for haulage and anotherfor excavators and equipment.Indicator for haulage: The GJ/tonne‑km indicatorapplies to haulage-related equipment, such ashaul trucks, road trains, water trucks, scrapersand graders.
Analyses of Diesel Use for Mine Haul and Transport OperationsIndicator for excavators and equipment: TheGJ/tonne material moved indicator applies toexcavation-related equipment, such as excavators,dozers, loaders and surface miners. Ancillaryequipment, such as lighting plants, generatorsand pumps, are also considered in the non-haulindicator, as these are considered to be essentialequipment for the operation.Calculation of the DEEMThe simplified process for calculating the DEEM ispresented in Figure 3. The base data that is usedto calculate the DEEM is the total fuel consumedand the BCM moved. This is converted to thecommon measure of litres of diesel per tonnemoved (L/tonne). The L/tonne measure is thenadjusted for equipment fuel use, distance travelledand change in elevation to normalise the effect ofchanges in the material movement task, resultingin a fuel efficiency factor measured in L/tonne-kilometre. As a final step, the fuel efficiency factoris converted to units of energy (GJ) and greenhousegas emissions (tonnes CO2-e).Equivalent Flat HaulThe ‘equivalent flat haul’ (EFH) parameter wasdefined to describe the characteristics of the haulroute travelled. The EFH is a calculated parameterthat accounts for both the distance from the sourceto the destination, and the elevation change fromthe source to the destination. The EFH normalisesthe elevation change and distance travelled, whichenables a comparison of the energy consumed andtonnage moved for a mining activity.For a given material movement task, illustratedin Figure 4, the DEEM accounts for the energyrequired to move the material, the tonnage moved,and the EFH.Base DataCommon 12,000,00010,000,000Total Mine BCM0.51Total Mine Fuel 80.470.460FY 05/06FY 06/07FY 07/080.45FY 08/09FY 05/06Convert to Energy and GHGFY 06/07FY 07/080.50Non-Haul GHG t CO2-e/tonne0.400.45Haul GHG t 0.200.10FY 06/07FY 07/08FY 08/09FY 08/09Adjust for Distance0.15000FY 05/067FY 09/10Figure 3: Summary of the DEEM calculation .110000.05000FY 05/06FY 06/07FY 07/08FY 08/09YearLitres/Tonne(Excavators, dozers and ancillary)Litres/Tonne.Km(Haul Trucks, Water Trucks and Graders)
8Energy Efficiency Opportunities Case Studyrole in mine planning, design and operations,the project engineers’ involvement ensured thatthe DEEM is credible, accurate and transparent.GJ and tCO2-etonnage movedxequivalent flat haulDestinationSourceFigure 4: Illustration of Equivalent Flat HaulApplication of the DEEMThe DEEM compares and links the weekly to monthlyhaul and non-haul energy performance to on-siteoperational activities, decisions and conditions.Performance data can be analysed and comparedfor a mine site to identify trends and factors thathave either positively or negatively influencedenergy efficiency. The DEEM can reveal many factorsthat have a direct or indirect influence on energyefficiency, such as changes in equipment size, theperformance of different operators, the influence ofproduction schedules or volumes on fleet efficiency,the effect of rainfall on road conditions, and manyother factors. The DEEM’s variation can be accuratelycorrelated with and explained in terms of these andother quantifiable factors. These factors and theirinfluences are then taken into consideration in futureplanning and operational decision-making.While the DEEM is a useful energy tool forperformance tracking and reporting, it is alsomore useful for informing business improvementdecisions than a simple indicator such aslitres/BCM. DEDIM applies this approach toidentify where factors contributing to efficiencyimprovements at one mine and/or mine typemay be measured and implemented at another.Typical solutions include applying different miningmethods, mine planning and design changes,haul road changes (length, gradients, designand materials), changing equipment operatorbehaviour, mining plant selection, and fuel types.DEDIM’s Technical Services Department and itsmining project engineers developed, trialled andimplemented the DEEM to ensure its applicabilityacross all projects and sites. Given their leadingThe project engineers also have ownership ofthe DEEM, and are responsible for calculatingand reporting the monthly DEEM performanceof their respective projects. This process enablesand encourages DEDIM’s mine project managersto test and understand the energy performanceimplications of their decisions and, hence, toinclude energy-efficiency considerations in theirday-to-day decision-making.Mine comparisonsThe graphs presented in Figure 5 and Figure 6compare the annual performance, on a monthlybasis of three mines, each mining a differentcommodity. The haulage-related indicator inFigure 5 illustrates that haulage on Mine 1 is moreenergy-intensive than on Mines 2 and 3, whileFigure 6 illustrates that excavation on Mine 1is less energy-intensive than on Mines 2 and 3.Several factors can influence the energy intensitymeasured by the DEEM across different sites: Rock hardness and fragmentation. Sites with hardrock are often more energy-intensive to excavate. Density of the material being excavatedand hauled. Material moved through blasting, and workrequired by dozers and loaders to shift materialinto haul trucks. Fleet selection, including size of equipmentin use at the site, as fewer numbers of largerequipment can result in greater energyefficiency and productivity. Mine planning integrating energy efficiency,including haul slope optimisation, haul roadand dump configuration and optimisation canreduce the energy intensity. Energy-efficiency measures deployed thatinclude a cumulative suite of improvements forDEDIM, including operator training, automationof lighting plants and idle time minimisation.
Analyses of Diesel Use for Mine Haul and Transport OperationsGJ/tonne-km(haulage related indicator)0.006000.00525GJ / 0.00000Mine 1Mine 2Mine 3Figure 5: Comparison of monthly haul energy use for three sample minesGJ/tonne material moved(excavation related indicator)0.02000GJ / tonne material 02500.00000Mine 1Mine 2Mine 3Figure 6: Comparison of monthly excavation energy use for three sample minesTracking energy performance over timeThe trend presented in Figure 7 demonstratesthe link between monthly energy performanceand mining activities for an open cut coal mine.Trending of the energy indicators is more usefulthan simply trending monthly energy use. Fueluse could increase or decrease due to changesin production activity or other factors that canobscure energy-efficiency insights. The use of keyperformance indicators, such as the DEEM, canprompt managers to enquire into the observedchanges in energy efficiency over time, and deeperanalysis can reveal insights into the factors thatdrive energy efficiency on the site.There are many factors that influence energy useon a mine, and many indicators are required totrack changes in energy use. The DEEM exampleillustrates how using appropriate indicatorsthat normalise for key sources of variability canhelp to give a better indication of true energyperformance. Examination of indicators over timecan provide a useful basis for business decisionsand may help to identify opportunities to improveenergy performance.9
10Energy Efficiency Opportunities Case 00.00300.00200Non Haul GJ/tonne0.00200.00100Haul GJ/tonne.km0.00100.000000.0000Increase in digger and truckshifts to catch up on coal andO/B losses after floodsDuring power plant shut-downperiod, focussed on movingwaste over short distances tothe in-pit dumps.Low utilisation of dozer push& excavator productionFigure 7: Trend of monthly performanceIt is beneficial for mining companies to be able tocompare their performance against a consistent setof indicators. By calculating the DEEM for multiplesites, DEDIM is able to draw comparisons andinsights across different activities and operations.DEDIM has used the DEEM to set annual targetsfor reducing energy intensity, and to track projectand company performance against the target.The Commodore open-cut coal mine in SouthEast Queensland has been used as the pilot sitePhoto courtesy of Downer EDI Mining Pty Ltdfor energy-efficiency improvements at DEDIM.The energy intensity of the Commodore mine hasimproved by 18.2% over five years. DEDIM hasused the DEEM to measure an 8% reduction inenergy intensity for 2009/10, against a companywide target of 3%. With the confidence gainedfrom past performance, and a continuedimprovement program pipeline identified for2010–11, DEDIM has set an energy-intensityreduction target of a further 2%.
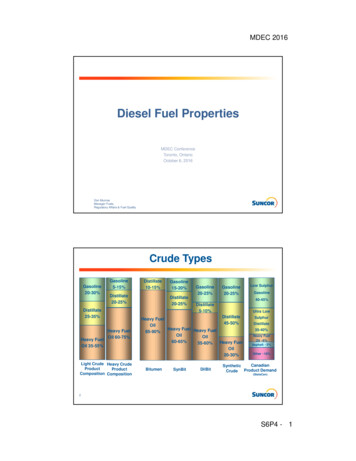
Analyses of Diesel Use for Mine Haul and Transport OperationsBenchmarking Truck OperationsPurpose of benchmarking, includingtheoretical benchmarkingBenchmarking provides a means to measure andidentify best-practices within a single organisation,or across multiple organisations.There are many variables that can affect haul truckenergy efficiency. Simplistic performance indicators,such as litres of diesel per tonne moved, are oftentoo blunt to provide useful insights into the factorsthat drive efficiency because they do not accountfor factors such as the distance travelled, thepayload per cycle, or other characteristics of anindividual hauling task.Calculations of theoretical energy efficiency maynot reflect the level of performance that canrealistically be achieved but can be a useful toolto track improvements in energy efficiency. Thedevelopment of relevant theoretical benchmarksprovide organisations with a practical energyefficiency measurement tool that quantifies bestpractice, and highlights areas where improvementscan be made.Best truck ratioAfter gathering real-time haul cycle data, GPS data,and mine site information, Leighton Contractorsdeveloped a series of mass and energy equationswhich were designed to compare actual truckperformance against the theoretical bestperformance. This technique essentially calculatesthe best theoretical performance a haul truck iscapable of in order to move a mass of materialfrom one location to another based on vehicle andsite characteristics. The actual performance can becompared to the theoretical energy use for a specifictruck, resulting in the ‘Best Truck Ratio’ (BTR).Actual energy useBTR ---Theoretical best truck energy useFor a defined material movement task via aspecific haul path, the BTR is the ratio of the actualenergy consumed to perform the task over thebest-practice benchmark energy consumption.11Leighton ContractorsWith operations in 19 coal, iron ore, goldand manganese mines in Australia and NewZealand, Leighton Contractors Pty Ltd is oneof Australia’s largest contract mining providers.With one of the largest mobile equipmentfleets in the country, the Leighton fleet movesin excess of 240 million cubic metres perannum. Leighton Contractors operates at bothbrown-field sites and green-field start-ups.The Leighton fleet includes over 300 large haultrucks, as well as many other types of mobileplant and equipment.For example, if a haul truck achieves a BTR of 2.0that indicates that the actual fuel consumption wastwice that of the best-practice benchmark.application of the btrThe BTR allows Leighton to compare theperformance of their operations between sites,trucks, operators, and other parameters. Morespecifically, haul trucks can be compared onevery cycle of a particular day and site. As thisis a ratio of actual performance against the bestpossible performance for a particular haul cycleit gives a much more accurate indication of theenergy efficiency of the operation than alternativeperformance indicators such as litres/tonne moved.One example is payload optimisation, presentedin Figure 8. For a fixed task of 20 million tonnesmoved, Figure 8 illustrates four payload scenariosand the corresponding BTR. The third scenario,a payload of 154.25 tonnes, is identified as theoptimal scenario with a BTR of 2.22. The other threescenarios score a higher BTR, and would resultin greater fuel use to achieve the same materialmovement outcome. For each scenario the fuelconsumption in litres is stated below the BTR, andfor the three non-optimal scenarios the values inred text indicate the additional fuel required tomove the same amount of material via the samepath at a higher BTR. In effect, setting the payloadat the optimal 154.25 tonnes per cycle would result
12Energy Efficiency Opportunities Case StudyPayloadTruck ModelResults– based on 20 million tonnes movedResults– based on 20 million tonnes movedPayload 126.21Payload 140.22Payload 154.25Payload 168.28Best Truck Ratio:
procedures influence energy use and maintenance costs. Truck velocity, especially cornering speeds, braking patterns and road surface characteristics can affect tyre wear and replacement costs. In open cut mining, many parameters can affect the efficiency of the fleet, such as: Mine plan and mine layout Speed, payload and cycle time

