Transcription
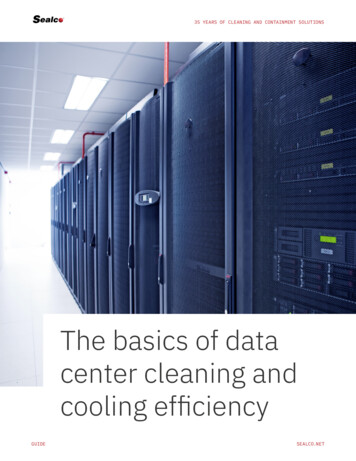
MIGRATING AND CLEANING DATA USING EXCEL:A CASE STUDYJohn Wilton, Master’s Candidate and Anne Matheus, PhDMarist CollegeAbstract: This is a case study from a senior project in an undergraduate Information Systems program. It involves areal agency that could not afford to have the project completed and requested help from a small liberal arts collegein their community. This case study is only one part of a larger project that included the development of a relationaldatabase and the creation of a web based application. The problems associated with the migration of the old datainto the new system seemed insurmountable, but the challenge was accepted and overcome with excellent resultsusing Excel.Key Words: Data Cleansing, Extraction, Load, Migration, Transformation, Data QualityINTRODUCTIONIn the summer of 2009, a not for profit agency requested help to redesign their database system.The agency, Daily Out Reach (DOR), opened its doors in 1974. Their goal is to help meet the basic needsof individuals and families by providing them with resources that are difficult for them to obtain. Theyalso act as an advocate through the referral and follow-up process for needy individuals and families andfind appropriate resources which will enable people’s needs to be met on a long-term basis. They strive topromote community awareness of social problems and generate support for improvement of the system'sresponse to human needs. They operate a food bank, lunch program, health and other support services.DOR’s funding is based on the number of individuals served, type of service and through donations.The ProblemThe current system to track clients and services is a flat file created in MS Access. It containsover 89,000 records, dating back to 1989. Each time a person visits the agency, a new record is created. Itis necessary to enter all the identifying information each time. As a result, much effort is wasted andmany of the data fields are duplicated and error prone. It is also almost impossible to determine therelationships between individuals; i.e. to determine if a client is a head of household and to whom he/sheis related. Clients are restricted to one monetary grant per household and it is therefore necessary to keeptrack of the relationships of the people being served.In addition to requests for funding, this information is necessary to report to sponsoring agencies.Figure 1 is a screen shot of the current system. The following problems will be fixed by creating the newsystem: Inconsistent and redundant data Slow access time Lack of flexibility Need for installation on each PC Inability to incorporate future requirements Difficulty and potential inaccuracy of tracking and reporting client informationEach record has 110 fields. The structure of the database does not support accurate or timely reporting.Monthly, quarterly and annual reports are frequently tabulated by hand. Funding is dependent upon theaccuracy and timeliness of these reports. In addition, third party reimbursement claims are difficult totrack and are not generated by the system, but must be manually created, tracked and recorded inhardcopy.
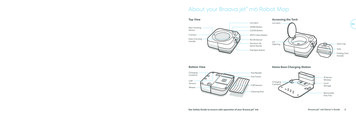
Figure 1: Screenshot of current systemProject PlanThis project has three main phases; the first is to normalize the flat file into a third normal form1relational database. This would allow for easy queries, reports and use of the system without requiringredundant data entry and extensive search and retrieval of information. The second phase of the projectwas to create an easy to use web interface. Finally, the “old” data needed to be migrated into the newsystem because the history of the services given to clients is required to determine eligibility for futureservices. A critical aspect of this project was the fact that if the data could not be migrated successfully,the new system could not be used because it was crucial to be able to track the history of the clients’transactions in the system. This case study will focus on the third phase of this project, the data cleansingand migration of the old data into the new system.However, in order to gain a better understanding of the full project, an Entity Relationshipdiagram is included as well as screen shots of the web interface. The ER diagram is based on thefollowing business rules: One person can have many visits. One person can have one or more addresses. One person can have multiple sources of income. One person can have 0 or more household members. One person can have 0 or more requests. One person can have multiple requests for different items in one visit. One person can have 0 or many service requests.1A two dimensional array containing single–value entries and no duplicate rows; all non key attributes aredependent upon all of the key attributes; and does not have any transitive dependencies. [1]
One person can have 0 or many stuff requests. One person can have 0 or many money requests. One person can have different sources of income each time they visit. One person can have different contact information each time they visit.As a result of the normalization of the database, it is now possible to retrieve the following information: A list of head of household members. The different locations clients have lived in the past. Who requested services by dateso Broken down further by type of service.o Who received services by dateso Broken down further by type of service. The number of clients served per month or year.o Can be grouped and ordered for more structured reports. All moneys distributed with reasons, amounts, and check numbers. All items distributed with reasons and quantities. Demographic information by age group, race, gender, and location.Figure 2: Basic Entity Relationship DiagramFigure 2 is the basic ER structure without some of the pull down lists for simplicity sake. The final ERdiagram includes 33 tables, many of which are simple lists of names and service. The newly designeddatabase is undergoing data migration from the former Access database (flat file) to a relational database.
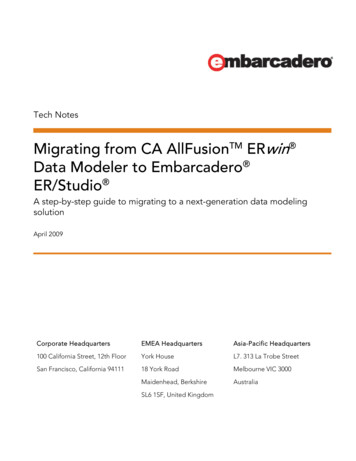
The original database was based on requests, rather than the people.User InterfaceThe new system was created using the Zend framework and coded in PHP. Because of thefunctionality allowed by the relational database, the system can now display entries for different requestson different dates for easy entry and use. Figure 3 is the main screen with the client and visit information.Below you will notice that the Money request information that was entered is present. Since a date whenthe check was issued is not entered, it is represented by zeros for now. Once this information is known,the user can go back and edit the request and put in the new information.Figure 3: User Interface (all data shown is test data and not real clients)The web-based system was developed to allow for access by simultaneous users. The current systemrelied on social security numbers to look up clients' names. The new system uses surrogate primary keys2to retrieve a client’s record.Data Quality IssuesThe original database contains over 89,500 records that include redundancies and errors. In orderto validate the data Excel and VBA were used to check records. This involved parsing strings and lookingfor inconsistencies. Errors within the social security field are an example of some of the errors: Check the length of the social security number (SSN) In the SSN there would be no characters only digits. This was done by parsing the string andusing regular expressions. Something that the organization uses is the letter T-Before a made up social security number. (i.e.T12-34-5678) This had to be incorporated in the extraction, transformation and loading (ETL)logic.In the new system this error is eliminated by adding a checkbox to assure that the users cannotmake up a number. If the SSN is unknown, a number is created by auto incrementing and creating a T2A unique, system-supplied identifier that is created for each row and all other attributes are dependent upon it. Ithas no meaning to the users and is usually hidden from users [1].
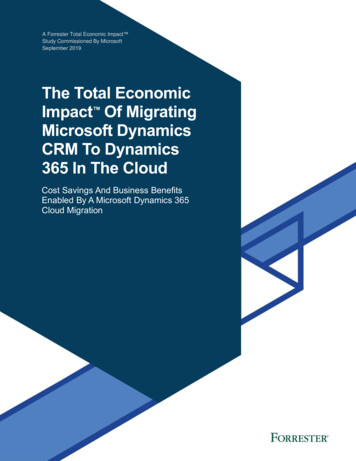
number.Based on the above method of analysis, 79,200 duplicate entries were found; there are 10,300unique individuals with one person – one visit; these are included in the 20,565 people who had multiplevisits.Figure 4: Data Errors (names and SSNs have been removed)In the discipline of information systems, [2, 3, 4, 5], have done extensive work in defining dataquality. In their initial work in defining data quality dimensions, [3] used a factor analysis technique todetermine the characteristics that users attribute to data. The initial process resulted in 179 dimensions.Using an additional sorting process, the data quality dimensions were grouped into four categories [4].Category 1 is intrinsic data quality; intrinsic implies that data has quality in its own right. Contextual isthe next category, and includes the importance of considering the data quality in relation to the context ofthe task. Category 3 is representative, which means that the data is concise, consistent, and easy tomanipulate. Accessibility is the fourth category and refers to the security and accessibility of the data. Thetwo categories that are the most problematic in this project are the intrinsic category and the accessibilitycategory. The intrinsic category of information quality deals with 4 dimensions. Those 4 dimensions areaccuracy, believability, objectivity and reputation. The accessibility category deals with the 2 dimensions.Those 2 dimensions are access and security dimensions. The intrinsic category is best explained “Whenthe quality of the data is directly knowable from the data, then the quality is said to be intrinsic" [6, p 43].The intrinsic data was not accurate because of end user interaction with the system. The end usershad to input clients’ information into the system with no form of front end or back end validation.Examples of this are rampant throughout the data, everything from names having numbers in them toletters within social security numbers. Some of the social security numbers were not even 9 digits, thiscould have been prevented easily through validation techniques.The believability of the data was always in question because of the inaccuracy of the data. Inaddition to the inaccuracy there was no accountability for who entered the records. There were only 2
accounts with multiple end users using those accounts. There was an administrator and something similarto a guest account. Unfortunately with no one being accountable it lead to more errors than expected.The objectivity of the data is compromised. The case worker who is the end user adds an elementof subjectivity to everything he or she does. The end user might make an exception for a client that ismanipulating the system. Many times clients come in and are going through hard times, and other timesthey are exploiting this organization. That is something for the end user to ascertain through his or herown experience.The reputation of the data is one of the worst dimensions throughout the old database. Thissystem has no way of tracking who enters data into the database. Many times a client gives another socialsecurity number and claims he is one person; meanwhile the case worker knows that is not accurateinformation given by the client. Multiple records exist in the system for one client because of fictitioussocial security numbers. Multiple records for one client lead to degradation of the reputation of the data.The accessibility category has the access dimension within it. This is a major problem within theolder system. One end user can access the system at once. Multiple users can not log in which leads toproblems when multiple end users need to access data about the clients. Clients sometimes come in tospeak with someone about their hardships and the end user will actually hand write the visit. After thesystem is available the end user will access the system and enter the data.The security dimension is nonexistent within this system. If the user knows the location of theexecutable file on the server they can access the program. Once a drive is mapped, the location iscompromised because there is no user login. The security of the system is dependent on end users loggingoff their computers whenever they step away from their computers.ETL PROCESSExtractionThe way the data was extracted was through concatenation of strings. An excel spreadsheet wascreated that has a custom module. This module creates SQL insert statements that added all the records tothe proper fields.Steps are as follows:1. Identify what the 110 field headers definitions were2. Match up the 110 to our new relational database with 33 tables3. The records would not match exactly. To reduce errors, use as many drop down boxes aspossible. Instead of typing male or female, you choose one. Male will reflect a 1 while femalewill be 0. So while converting the records you must account for this new implementation. Thiswas done in multiple fields.4. The records must be sorted in order of SSN and then by date. Then the custom module goesthrough the records and assigns a Primary ID, a Request ID and a Service ID.5. The above numbers are handled as placeholders /identifiers. These are what determine the recordslocation with regards to the Person object. The Person object is the parent while each Request IDmust fall under the Primary ID. This is done by sorting and auto incrementing until the SSNchanges.6. The above determines which SQL statement will be executed and if the SSN is the primary ID ora visit from the absence of a Primary ID and the presence of a Request ID. The SQL statementswork off of whatever is generated when the code checks if the below SSN is the same as theabove SSN.7. The Insert statement is generated depending on the SSN. Parameters are matched up with thevalues from the field headers.8. To handle replaced text with integers, execute a find and replace macro in each row as needed.Figure 5 displays the complexity of determining which attribute relates to the original fields, not a trivialprocess.
Figure 5: Coordinating attributes between relations.TransformationThe transfer process was a semi-simple process. We handled this is by taking the above SQLstatements and executing them. This created the 33 tables that made up our relational database. Thetransfer must account for different fields in the database (i.e. the spreadsheet has a String while thedatabase uses a date data type.). These are not handled the same way so it is necessary to use the CStrfunction to convert dates to Strings for the SQL transfer. This is the same with auto incremented numbersas well as integers and doubles. The SQL only handles Strings so the SQL needs to account for that. Thisis done by the constraints set in the fields according to the data types.In addition to having drop down menus to reduce data entry problems there is also JavaScriptvalidation to handle input errors. The records are being converted from a single table into a relationaldatabase. This has been done through deconstructing and analyzing the data. This data is thenreorganized and placed into their respective fields and interrelated tables.LoadWhen loading the records, it is necessary to turn off back end validation. This allows all records to beentered into the database. The order of the load is the most important aspect. First you must load the people to create the parent table Then you must load the visits Next you must load the individual requests The SQL statements that get generated in this orderSQL statements are as follows these are strings that you continue to concatenate after VALUES (with the proper cells. INSERT INTO People (peopleID, SocialSecurityNum, LastName, FirstName, MiddleInitial,DateOfBirth, Gender, PrimaryLanguage, HeadHouse, CaseWorker, Remarks) VALUES (
INSERT INTO addressPhone (peopleID, requestID, address1, address2, city, state, zip,phoneNumber1, phoneNumber2) VALUES ( INSERT INTO Requests (requestID, reasonID, peopleID, requestDate, serviceID, status,decisionDate, preparedBy, enteredBy, comments, followUpDate, followUpToWho) VALUES ( INSERT INTO IncomeSources (incomeSourceID, Source, Description) VALUES (" INSERT INTO MoneyRequests (requestID, reasonForMoney, checkNum, amountUSD,issueDate, paidTo) VALUES ( INSERT INTO StuffRequests (requestID, itemName, quantity, issueDate) VALUES ( INSERT INTO ServiceRequests (requestID, date, advocatedBy, referredBy, agencyName,memo) VALUES ( INSERT INTO Household (primaryPeopleId, householdMemberPeopleId) VALUES (These values are grabbed from the spreadsheet which has all values from the database.Lessons Learned1. Basing the system off of the visit, NOT the individual.Through creating a new system that is based off of the visit, managing the information is madevery clear. For example, if a person makes several visits with a short time frame, the person is onlycounted once, while the visits will be shown as more instances. This does not mean that the numbers willbe skewed or redundant.2. Use of a relational Database to manage informationThrough the use of a relational database, like MySQL, information can be organized and arrangedto meet each of the administrative needs. This technology can also prevent unintended access from beinggranted to those without rights. This was accomplished through the use of a browser based interfacewhich will both vet the information and provide limited Caseworker interaction. Through the use of dropdown menus, much of the data will be entered correctly and within the correct category.Example of this would be someone placing a service request for food and having the person place aservice request for diapers. While there will be some human error, a lot of this will be avoided throughlabeling the fields and having drop down menus that specify what is being done.3. Use of the server and Online capabilities.By utilizing MySQL, enabled the user (backend, not the clients) to simultaneously access thesystem and update records without worrying about interference from one another. This means that manyusers can access various parts of the system without being locked out.4. Reporting of the informationThrough the use of MySQL to generate reports. The Administration will be able to manipulateand update reports in a very clear and concise fashion. This means that they will no longer need tomanually sort through the data and sensitize it so all personal data is removed, that is not required. Thisalso will standardize their reporting techniques and views of information with relative ease.5. Flat file structuresCreating 33 new tables reduces redundancy and promotes accurate input. This has been a verytedious task and creates new and interesting connections between how the data can be viewed and how itcan be manipulated. The organization and interrelations of this program need to be more fully explored tounderstand how the tables relate to the program as a whole and how to implement (or institute) ways toaddress future problems and needs.CONCLUSIONDOR’s current flat file system created an inaccurate and inefficient system that was in need ofreorganization. With the introduction of the new system, the granting agencies will have accurate datafaster, better information concerning the needs of their clients, how often clients frequent DOR, and canaid in having service requests granted or denied based upon a relational model where the information can
be found with a few keystrokes. Speed is an important feature to both the clients and the Administration.The DOR agency requested a new system created with visual basic with a back end databaseusing SQL Server 2008. The student team felt it would not be as flexible and effective as somethingwritten in PHP with a back end in mySQL. After some discussion, the client agreed. Their database wasone table with 90,000 records including only 20,000 unique records. Obviously, “redundancy was a majorproblem”. A relational database was created with 33 new tables to reduce redundancy and incorporateinput accuracy. Limiting end users’ ability to create errors by giving them forced choice lists willsignificantly reduce data entry errors. This was accomplished by creating a system with drop down menusand validation for the front (JavaScript) and back end (PHP). Table 1 is a synopsis of the identifiedproblems and the implemented solutions.Table 1: Problems and SolutionsProblemsOld system data is a flat fileSecurity of old systemLack of accuracy of reportsRedundancy of recordsDesign of old systemLack of end user knowledgeInaccuracy of dataSolutionsThe old system had no hierarchical structure and had no relationships. Thenew system is a relational database with 33 tablesThere was no login required. Users could find the location of theexecutable on the server. When records were entered it was under one username. Now each user must login to the system with a password.Reports that were generated would count 1 person with 10n visits as 11people. The people would be entered multiple times due to the visit drivensystem. The system has now been changed to a people driven system.Each time a person comes to the agency a search is done and if that personis found a visit is added to the parent record if not a new person object iscreated.Take away end user interaction by replacing data entry fields with dropdown lists, check boxes and radio buttons. Example (T-number made upSSN; Format Txx-xx-xxx, user inputs ranged from xxx-xx-xxxT to Rxxxx-xxxx) Reduction of this error is handled by auto incrementing and acheck box that generates a T-number.The following table (Table2) describes the problems in the original database in terms of the actualnumbers and rates of errors and problems. As noted, 88% of the records were duplicates; only 12% of therecords were unique visits. Less than 25% of the people in the system were not duplicates. The method offinding information in the old system required the end user to literally scroll through all 80,000 plusrecords to locate a person who may have been in the system in the past. Reports generated by this systemcould not have been accurate leading to costly and protocol errors.The new system is designed to eliminate the possibility of duplicate entries by providing the enduser with a simple, easily searched database. It is a well-designed relational database that follows therules of referential and domain integrity. It requires login and has roles assigned to users so that only theadministrator role can allow for special functions.One of the risks of implementing the new system is the data will no longer reflect inflated used ofservices. Removing the duplicate entries significantly reduces the number of persons receiving services. Itwas discussed with the administrators at the beginning of the project that this was a possible outcome.
Table 2: A comparison of the old system results and the new systemFACTS & FIGURESORIGINAL DATABASERecords: *89,500100%Duplicates:Unique: One visit only79,20088%10,30012%20,56523%10,26511%People: Total people in databaseDuplicate People: People whohave been to DOR more thanonceDisplay:1 table that displayed all relevantinformation.* records (include redundancy and errors)NEW DATABASEBased on visits rather thanpeople.33 tables created from theoriginal database (1 table).A better understanding of thedata is created.Online AccessibleImproved storage of client and visit dataImproved management controlImproved troubleshooting abilitiesProvide a visual representation of thesystem
REFERENCES[1] Kroenke, David M. & Auer, David J. (2009). Database Processing. Prentice Hall, NJ.[2] Wand, Y. and Wang, R.Y. (1996). Anchoring data quality dimensions in ontologicalfoundations. Communications of the ACM, 39(11), 86 - 95.[3] Wang, R. Y. and Strong, D.M. (1996). Beyond accuracy: What data quality means to data consumers.Journal of Management Information Systems, 12(4), 5 - 34.[4] Strong, D. M., Lee, Y. W. and Wang, R. Y. (1997). Data Quality in Context. Communications of theACM, 40(5), 105 - 110.[5] Pipino, L. L., Lee, Y. W., and Wang, R.Y. (2002). Data Quality Assessment. Communications of theACM, 45(4), 211 - 218.[6] Fisher, C., Lauria, E., Chengular-Smith, I. and Wang, R. (2006). Introduction to InformationQuality. [s.l.]: M.I.T. Information Quality Program, Print.
MIGRATING AND CLEANING DATA USING EXCEL: A CASE STUDY John Wilton, Master’s Candidate and Anne Matheus, PhD Marist College Abstract: This is a case study from a senior project in an undergraduate Information Systems program.It involves a real agency that could not afford to have the project compl