Transcription
4MH555555333333333322222225565666666666Physical functioningRole physicalRole emotionalSocial functioningBodily painVitalityMental healthgiven cluster ‘m,’ we obtain the average of scale ( X m) acrosscluster members scored in the simple manner [20].Summary of notationsX m—average of SF-36 version 1 scale scored in simple mannerwithin cluster mxm—average of new rescored value of single item within cluster mxn—new rescored value of item for an individual n within a clusterWe used the index to refer to an item within the associated scale with the goal of judging how well a rescored H3MH466of such an item best matches the value of the scale. Applyingthe new scoring method to a single item, we then obtain anTheaverage estimate ( xm) across the same(cluster members.)squared difference between the two X m xm2describeshow far apart they are. The mean squared difference acrossall clusters describes how well the estimated scale values,based on the new scoring method applied to a single scaleitem, succeeded at matching the values based on the simplemethod derived from all scale items, and the square root ofthat quantity is what we have termed “extensibility.” A low
Quality of Life Research (2018) 27:2195–22062199value is desirable; that is, if the scale scores based on thenew scoring method and the simple methods always agree,then that new method is extensible. The root-mean-squareddifference describes the sum of statistical and non-statisticalerrors. Non-statistical errors come from a biased estimate,whereas statistical errors are due to random sampling variation. For rescoring methods that produce individual estimates, the statistical errors are described by the standarderror, as calculated using standard formulas for the varianceof a mean.Our goal was to rescore the individual items so that theyoptimally represent the scale within the cluster. Cluster scoring methods assume that each response of each item withincluster m for individual n will take on some value xn. Forexample, in the simple scoring scheme of an item with fiveresponse choices, xn can have values of 0, 25, 50, 75, and100. In the process of matching items to scales, the values ofthese response choices will be rescored. Within each clusterm, our choice of how to rescore each response for each itemwill determine the xm, which is the mean of the scored itemwithin that cluster. If cluster m has Nm respondents and xnis the rescored value of an item for an individual n withinthe cluster:xm Nm1 x .Nm n 1 nThis will be compared to X m that is the mean score, basedon the simple scoring method, of the SF-36 scale thatencompasses the item used to calculate xm , which is basedon the new scoring method. The goal of this scoring methodis to find optimal values for each response of each item for(each cluster) m so that the subsample size-weighted mean of2X m xmfor each item across all clusters is minimized. IfN is the total number of respondents across all of the clusters(201 clusters in this case), Nm is(the number) of respondentswith cluster m, and we weight X m xm2relative to themean cluster size N/201, then for each item, we seek to minimize the quantity.S 201201)2 )2(Nm (1 NmX m xm X m xm .201 m 1 N 201Nm 1The square root of S is what we term cluster-weightedextensibility. In order to minimize these values, we used anon-linear least squares algorithm (“nl” in STATA [21]),which minimizes the sum of squared differences of a nonlinear expression using a pseudo-regression technique that isfitted based on a modified Newton–Raphson algorithm [22].The item values were parameterized in a way that forced thesolution to be monotonic; for example, for the items in thephysical function scale, the score for “limited a lot” has tobe less than the score for “limited a little” in order to avoidunreasonable solutions corresponding to local minima ofthe objective function (the extensibility statistic). We alsoexplored multiple starting values to assure ourselves we hadthe best local minimum extensibility. When extensibility values are reported the expected squared error due to randomsampling is subtracted from “S.” The cluster scoring is available upon request from the senior author.Task 2: matching VR‑12 items to the correspondingSF‑36 scalesFor the second task, matching of VR-12 items to the SF-36scales required a somewhat different approach from thatused to match extracted SF-36 items to their correspondingscales.To define clusters for this particular analysis, our intentwas to use variables that would likely have a similar meaningin cohorts 7 and 8 relative to cohorts 1–6, and on that basis,we chose age, gender, and baseline SF-36 scores.We used the rescored SF-36 items from the first task tocalculate SF-36 scales for the baseline and follow-up surveysfor cohorts 1–6 and the baseline survey for cohorts 7–8.SF-36 scales and corresponding VR-12 items were considered one at a time. Using Classification and RegressionTrees (CART), we modeled follow-up scores in cohorts 1–6for each scale based on the baseline SF-36, age, and gender. From this we obtained 100 clusters where the predictedSF-36 scale score was similar. We averaged the follow-upSF-36 score for each scale within each cluster using data thatspanned cohorts 1–6.We applied the cluster definitions obtained in cohorts1–6 to individuals in cohorts 7 and 8 who had both baselineand follow-up surveys. In these cohorts, SF-36 was used atbaseline and the VR-12 at follow-up. The mean expectedSF-36 follow-up score for each scale within each cluster forcohorts 7–8 are those that were calculated based on cohorts1–6 follow-up SF-36 scores.From the above analyses, we have 100 clusters ofrespondents to the follow-up surveys in cohorts 7 and 8in which we have an expected score for each SF-36 scale.We also know the observed VR-12 items responses to thefollow-up survey in cohorts 7–8 for each individual withineach cluster. The overall strategy was to rescore the responsechoices for each VR-12 item such that for each of the 100clusters, the VR-12 item score across respondents withina given cluster best matches the expected correspondingSF-36 scale score.In order to find the best match between VR-12 items andSF-36 scales, we again sought to minimize the cluster sizeweighted mean square difference between the item and scale,as described in Task 1. To accomplish this, we again used13
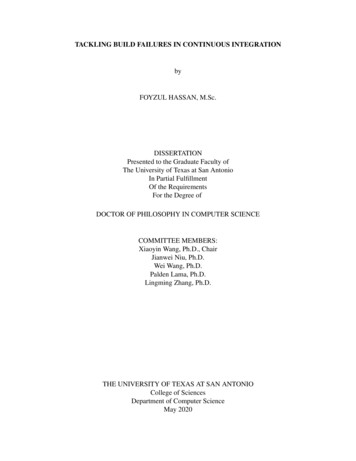
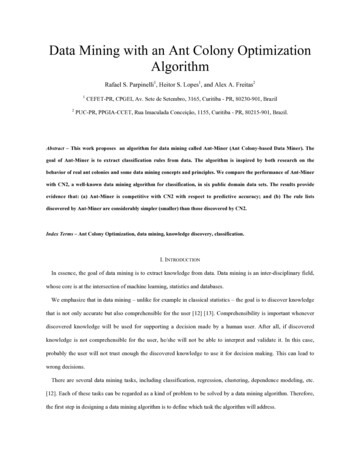
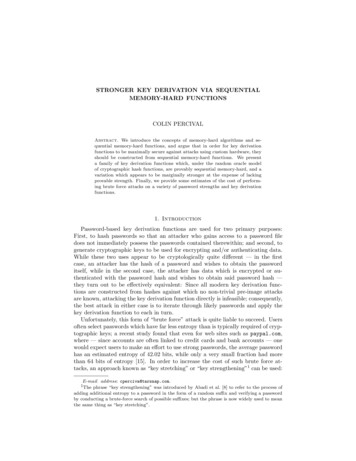
2200the previously described non-linear least squares routine“nl” in Stata.Evaluation of the new scoring algorithmOur methodology was based on three kinds of calibrations/predictions or “steps.” Step 1 was part of Task 1, and steps2 and 3 are part of Task 2.Step 1: SF‑36 items were scored/weighted to match SF‑36scales. This matching was done cross‑sectionally usingcohort 1–8 baseline data and cohort 1–6 follow‑up dataTo evaluate this calculation, we compared the extensibilityobtained using the equal interval method of scoring withthat obtained after rescoring the SF-36 items to minimizeextensibility across clusters.Step 2: using CART, baseline SF‑36, age, and genderin cohorts 1–6 was used to predict follow‑up SF‑36 scalescores. The prediction algorithms were then appliedto develop predicted follow‑up SF‑36 scale scores in cohort7–8We evaluated the accuracy of our algorithm in predictingfollow-up scales scores in a different set of cohorts fromwhich the algorithm was developed. In our main analyses,we used data from cohorts 1–6 to predict follow-up scores incohorts 7–8. To validate this methodology, we used a similarapproach in which baseline and follow-up data in cohorts1–3 were used to predict follow-up scale scores for cohorts4–6. Specifically, CART analyses in cohorts 1–3 were usedto model follow-up scale scores based on baseline SF-36scores, age, and gender, from which 100 clusters were created. The same cluster specifications from cohorts 1–3 werethen applied to the baseline SF-36 data from cohorts 4–6 inorder to create predicted SF-36 follow-up scale scores forcohorts 4–6 for each cluster and each scale. Since the actualSF-36 follow-up scale scores for cohorts 4–6 are known,they can be compared to predicted scores.Step 3: follow‑up VR‑12 items are scored/weightedto match the predicted follow‑up SF‑36 scale scores (fromstep #2) in cohort 7–8We examined how the new scoring algorithm compared tothe “simple” scoring method in matching VR-12 items tothe corresponding SF-36 scales using extensibility as thecriterion validity. Most of the items in the VR-12 are derivedfrom the SF-36 and some could be described as VR-12items. In scoring SF-36 scales in the simple manner, onlythose cases in which there were responses to all items withina scale were used. Four of the VR-12 scales comprise single13Quality of Life Research (2018) 27:2195–2206items, and we also matched the 2-item VR-12 scales to thoseof the SF-36 by averaging the two items comprising thosescales. Since the rescoring algorithm might be applied todata subsets quite different from the complete dataset forMHOS respondents, we used a new set of clusters to displaycomparisons between simply scaled and rescaled items, andwe did not weigh the extensibility calculation by cluster size.We also evaluated Step 3 to assess whether the extensibility results obtained are sensitive to the sample used toobtain predicted follow-up scores for cohorts 7 and 8 andthe sample to which the rescoring algorithm is applied. Forthis analysis, we divided the sample comprising cohorts1–8 into two parts, a larger part consisting of two-thirdsof the data (“estimation sample”), and a smaller part withthe remaining one-third (“test sample”). Using the methodsdescribed in Steps 2 and 3 (Task 2) of our main analyses, butapplied to only the estimation sample, clusters were createdin cohorts 1–6 and predicted follow-up SF-36 scales scoreswere calculated for cohorts 7–8 based on follow-up resultsin cohorts 1–6. In the estimation sample, VR-12 items forfollow-up cohorts 7–8 were rescored to best match the predicted SF-36 scale scores. In the test sample, the same methodology was used to create new clusters and new predictedSF-36 scale scores for cohorts 7–8. We then assessed howwell the VR-12 rescoring algorithm developed in the estimation sample worked in the test sample in matching theVR-12 item scores to the expected SF-36 scales scores. Inparticular, we examined the correspondence of extensibility between estimation and test samples with regard to thematching of VR-12 items to SF-36 scales.ResultsProfile of the MHOS cohortsTable 2 is the profile of the analytic sample used in theanalyses. There were 570,459 individuals in the SF-36 era(cohorts 1–6), 119,543 individuals in the transition era(cohorts 7–8), and 452,155 individuals in the VR-12 era(cohorts 9–12).Rescoring of SF‑36 items and extensibilityof rescored SF‑36 embedded itemsTable 3 gives the SF-36 item scorings for the questionsrelated to “moderate activities” and “climbing several flightsof stairs” in the PF scale based on our analytic sample ofelderly MHOS, English-language, mailed self-report surveyswith all 10 PF items answered using: (1) the simple proratedscale values (0, 50, and 100), and (2) the cluster scoringmethod. In addition, Table A-1 of Supplemental Material 1contains a table of the rescored items of the SF-36 that are
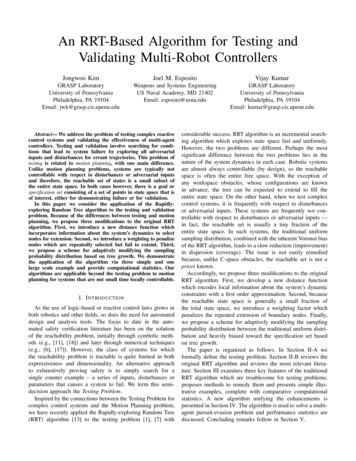
Quality of Life Research (2018) 27:2195–22062201Table 2 Descriptive profile ofMedicare Health OutcomesSurvey (MHOS) cohortsMHOS cohortsSample therPCS scoresMCS scoresSF-36 era (SF-36 at baseline and at follow-up)Transition era (SF-36 at baseline and VR-12 at follow-up)VR-12 era (VR-12 atbaseline and at followup)1–6570,45974.3 6.07–8119,54375.4 6.19–12452,15575.4 6.341.7%40.3%41.0%91.5%5.2%0.9%2.4%41.2 11.752.9 9.790.4%6.2%1.2%2.2%40.5 11.852.9 9.788.7%7.2%1.5%2.6%40.8 11.753.2 10.0All included subjects were aged 65 and older at time of survey, English-speaking, self-administered survey,and completed the survey by mailPCS physical component summary, MCS mental component summaryTable 3 Score equivalents of “moderate activity” and “climbing several flights of stairs” items (from the SF-36) for two scoring methodsMethodYes, limited a lotModerate activity (PF2)1. Simple scoring0.002. Cluster5.91Climbing several flights of stairs (PF4)1. Simple scoring0.002. Cluster11.26Yes, limited No, nota littlelimited atall50.0051.74100.0095.7350.0072.75100.0095.81PF2 physical functioning item #2, PF4 physical functioning item #4substituted for its full-scale counterpart if scored in the mostextensible manner, using the cluster method.Rescoring the VR‑12 items and extensibilityof the rescored VR‑12 itemsTable 4 contains unweighted extensibility of both rescoredand simply scored VR-12 items and scales based on 100clusters of roughly equal sample sizes. (A brief item description associated with each item abbreviation is contained inTable A-2 of Supplemental Material 1 along with rescoreditem responses for each of the 12 items.) For example, therescored VR-12 PF2 item (Moderate Activity) is slightlydifferent from the SF-36 PF scale such that the extensibilityor the root-mean-square difference is 2.1 points. For comparison, Table 4 also includes the unweighted extensibilitycalculated with the simple scoring of the VR-12, excludingthe “role” items and scales. In all cases where comparisonsare meaningful, the extensibility of the rescored items andTable 4 Extensibilitya (unweighted) of VR-12 items and scalesItem or scalePF2PF4
12 Item Health Survey (VR-12) [4] at follow-up; and for cohorts 9 until the present (baseline survey 2006-present), the VR-12 was used at both baseline and follow-up [5 ]. CMS currently uses the MHOS to assess differences in patient-reported outcomes among MAOs, and such differences com-prise one component of the Medicare Star Rating system [6 ].