Transcription
Date: July 4, 2022BSE LimitedFloor 25, P J Towers,Dalal Street,Mumbai – 400 001IndiaNational Stock Exchange of India LimitedExchange Plaza, C-1, Block G,Bandra Kurla Complex,Bandra (E), Mumbai – 400 051IndiaScrip Code: 543529Symbol: DELHIVERYSub:Presentation on participation in Investor Web Conference on July 5, 2022Dear Sir/ Madam,Pursuant to the Regulation 30 of the Securities and Exchange Board of India (Listing Obligationsand Disclosure Requirements) Regulations, 2015, we hereby inform you that Mr. Sandeep KumarBarasia, Executive Director and Chief Business Officer of the Company will participate as a speakerin an investor web conference i.e. India E-commerce logistics- Opportunity and Outlook hosted byHSBC Global Research on July 5, 2022.We hereby attach a copy of the presentation proposed to be made in the above conference.The above disclosure is also being uploaded on website of the Company at www.delhivery.comYou are requested to take the above on records.Thanking you,Yours faithfully,For Delhivery LimitedSUNILKUMARBANSALDigitally signed by SUNIL KUMAR BANSALDN: c IN, postalCode 122018, st HARYANA,street SECOND FLOOR SW50 STARWOOD MALIBUTOWN NEAR GOOD EARTH CITY, l GURGAON,o Personal,serialNumber 31a0521af9ff23,pseudonym ccbd134ac06c4013933d971b0aca038b,2.5.4.20 78d0595b120acb,email SUNILBANSAL3@REDIFFMAIL.COM, cn SUNILKUMAR BANSALDate: 2022.07.04 18:15:11 05'30'Sunil Kumar BansalCompany Secretary & Compliance OfficerMembership No: F4810Place: GurugramEncl: As above
Investor Presentation – July ‘22
Safe harbour and disclaimerThis Presentation is prepared by Delhivery Limited (“Company”) and is for information purposes only without regards to specific objectives, financial situations or needs of any particular person and nothing in it shall beconstrued as an invitation, offer, solicitation, recommendation or advertisement in respect of the purchase or sale of any securities of the Company or any affiliates in any jurisdiction or as an inducement to enter intoinvestment activity and no part of it shall form the basis of or be relied upon in connection with any contract or commitment or investment decision whatsoever. This Presentation does not take into account, nor does itprovide any tax, legal or investment advice or opinion regarding the specific investment objectives or financial situation of any person. This Presentation and its contents are confidential and proprietary to the Companyand/or its affiliates and no part of it or its subject matter be used, reproduced, copied, distributed, shared, or disseminated, directly or indirectly, to any other person or published in whole or in part for any purpose, in anymanner whatsoever.Certain statements in this communication may be ‘forward looking statements’ within the meaning of applicable laws and regulations. These forward-looking statements involve a number of risks, uncertainties and otherfactors that could cause actual results to differ materially from those suggested by the forward-looking statements. Important developments that could affect the Company’s operations include changes in the industrystructure, significant changes in political and economic environment in India and overseas, tax laws, labour laws, import duties, litigation and labour relations etc.Investment in equity and equity related securities involve a degree of risk and investors should not invest any funds in this Company without necessary diligence and relying on their own examination of Delhivery Limitedalong with the equity investment risk which doesn't guarantee capital protection.2
We aim to build theOperating System forcommerce in India3
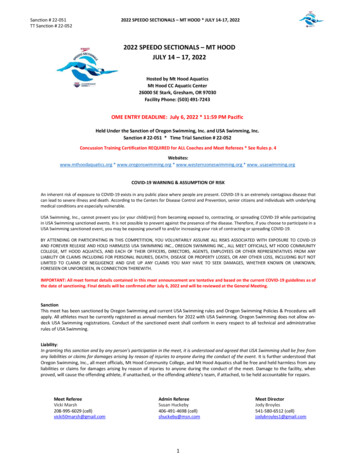
India’s logistics market is large and highlyfragmentedDirect LogisticsSpend / GDP (1) (%)Share of Top 10Organized Players(2) (%)Per Capita DirectLogistics Spend( )8% 1.5%1501,4707% 15%4,4601,47010% 7-10%1,050Direct Logistics Spend (1)( Bn)200Source: RedSeer report1. As of CY2020 for China and US and as of FY2022 for India2. Share of top 10 organised players is based on domestic road transportation, warehousing and supply chain revenues only4
Massive TAMExpressParcel (1)PartTruckloadFreight (1)TruckloadFreight (1)Supply ChainServices (1)Cross-BorderAir (1) 10-12 Bn 26 Bn 163 Bn 109 Bn 8 BnTotal TAM(1): 316-318 BnSource: RedSeer report51. CY2026E TAM figures approximated to the nearest Bn value
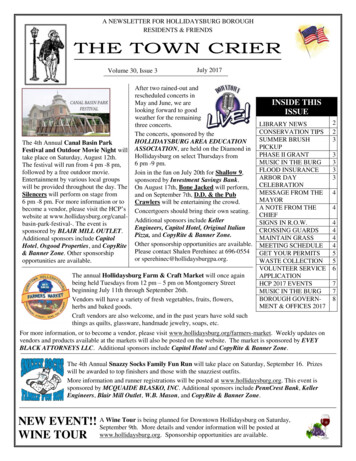
Our evolution Launched Supply ChainServices division Launched TruckloadServices division Acquired Aramex Indiaassets, global partnership Setup Seattle center forplatform development Introduced time-definedsurface delivery network fore-Commerce Launched WMSand warehousingfor e-Commerce CommencedExpress parcelservices focusedon e-Commerce Automated shipmentsortation at major gatewayswith addition of 13 sorters Launched Addfix andNetPlan, begunoperationalizing meshnetwork designLaunchedConstellation &Cosmos partnerprograms Launched DelhiveryDirect and Franchise Acquisition ofPrimaseller Introduced Volvotractor-trailer fleetLaunched megatrucking terminals inGGN, BWD, BLR(1)Acquisition ofRoadPiperLaunched CrossBorder services940 Acquisition of Spoton and TransitionRobotics Strategic alliance with FedEx Investment in Falcon Autotech 1 Bn express parcels delivered Achieved adjusted EBITDA profitabilityand positive adjusted cash PAT Introduced full/semi-automation atmega-facilities in GGN, BWD, BLR Launch of platform services in SL474361 Launched PTLservices 215Listing on NSE andBSE13302FY12FY13First GenerationMVP8FY14972964FY15FY16Second GenerationScaleNote: Graph represents revenues in Mn. For FY22, proforma revenues considered(1) Gurugram, Bhiwandi, BengaluruFY17FY18Third GenerationIntegrationFY19FY20FY21FY22FY23Fourth GenerationPlatform6
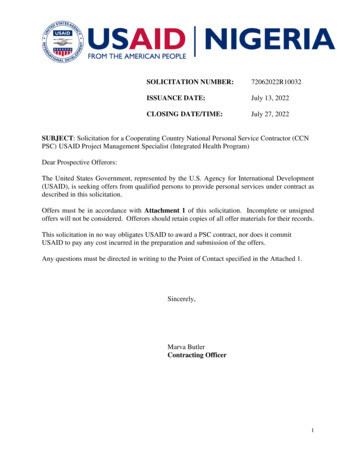
India’s largest integrated logistics platform(1) 940 Mn63.6%1.0%FY22 Proforma revenue(2)FY19 – 22 Revenue CAGR(3)FY22 Proforma adjusted EBITDA margin(2)1.4 Bn/24-25%58.6%2 Mn TonsExpress orders shipped sinceRevenue from customersPTL freight handled(6)inception/e-Commerce market share(4)using two or more services(5))80 18.15 Mn18,074Technology applications(7)Sq. Ft. logistics infrastructure(7)Pin-codes covered(7)FX: USD/INR 77(1)(2)(3)(4)(5)As per RedSeer report basis FY21 revenue(6)Proforma FY22 figures include Delhivery and Spoton performance for the twelve months ended March 31, 2022(7)For the period from FY19 to FY22; For FY22, Proforma revenue consideredExpress parcel services market share by e-Commerce volumes (including captive players) for the three months ended December 31, 2021, as per theRedSeer ReportFor FY22For FY19, FY20, FY21 and FY22; Spoton included from August 24, 2021 onwardsAs of March 31, 20227
Delhivery: Investment case1 200Bn addressable market - large and highly fragmented2Largest integrated logistics platform with a full range of supply chain services3Industry leading revenue growth and scale4Operating leverage driving adjusted EBITDA profitability5Unified network infrastructure, inter-operable across business lines and services6Asset-light business model with pan-India coverage7Proprietary technology and vast data intelligence and engineering capabilities8Proven track record of complementary acquisitions9High-quality, experienced management team and board8
Revenue is diversifying rapidlyCAGR (FY19-22)940Revenue(1)( Mn)Cross-border 3FY14FY15FY16FY17FY18Express Parcel(1) FY22 figures are on proforma basis(2) Not oss BorderFY20FY21FY22Others9
Consistent volume growthExpress Parcel shipments(In Millions)582Annual170 028240Q1FY20Q2Q3Q4Q1Q2FY21Q3Q4FY22PTL Freight tonnage(1)(In ‘000 FY17FY18FY19(1) FY22 figures are on proforma Q2Q3FY19FY207756Q4Q18594Q2Q3FY21Q4Q1Q2FY2210
Breakeven achieved at Adjusted EBITDA levelFY19FY20FY21FY22(1)Revenue215361474940Yield per express parcel ( )1.21.11.10.9Fuel price per litre(2) ( .9%)1.0% MnService EBITDA refers tocash EBITDA generated byall the services afteraccounting for direct variableand fixed costs ofoperations, excludingcorporate overheadsService EBITDAService EBITDA marginCorporate overheadsCorp. overheads (% of revenue)Tech expensesAdjusted EBITDAAdjusted EBITDA margin(1) FY22 figures are on proforma basis, FY19, FY20 and FY21 are on reported basis(2) As at the end of the fiscal year in New Delhi (Source: cludes Spotoncorporate overheads11
Breakeven achieved at Adjusted EBITDA levelAdjusted EBITDA(1)( 0%)(3.8%)(6.9%)(9.1%)(11.3%)Q4 FY21Q1 FY22Q2 FY22Quarterly(1) FY22 figures are on proforma basisRefer to the Adjusted EBITDA bridge in the annexuresQ3 FY22Q4 FY22FY19FY20FY21FY22Yearly12
Adjusted Cash PAT is positiveAdjusted cash PAT(1)( 7%)(1.8%)(1.9%)(2.1%)FY20FY21(9.2%)Q4 FY21Q1 FY22Q2 FY22Quarterly(1) FY22 figures are on proforma basisNote: Not adjusted for any non-cash deferred taxesRefer to the Adjusted cash PAT bridge in the annexuresQ3 FY22Q4 FY22FY19FY22Yearly13
Investing in capacity and capability buildingCovid impactedperiodyearUse of funds - mixUse of funds – value(1)(%)( 0%18%21%FY12-FY14FY15-FY17Operating Cash BurnFY18-FY20Capex3%FY21Working CapitalTotal cash used during the period ( Mn)(1) Until FY2220%19%FY22Inorganic GrowthCash Burn in Apr& May ‘20 duringCovid lockdownCash profit generated ploughedback into the business14
FY23 Growth initiatives1Integration of DLV and SO networks, realize network synergies, launch economy PTL service2Up to 4 Mn sqft infra expansion, fleet expansion by 150 TTs, 35% expansion of ASCs3Introduction of new automation - AGVs/AMRs, ASRS systems, system-directed MM operations4Expand usage of EVs in FM/LM operations; piloting LNG & EVs in MM operations5Aggressively grow cross-border express product (DLV FedEx)6Accelerating SCS business growth with focus on key industrial verticals7Launch of Delhivery D2C Academy with key ecosystem partners8Launch Unified Client Portal, merchant panel for SMB customers to access all products9Launch Delhivery Direct (C2C) mobile app, Orion (truckload price discovery and booking)10Launch of PaaS for global 3P developers along with SaaS offering in select international markets15
Delhivery: Outperforming on business growthFY15-22 CAGR (%)70%50%30%India nominal GDP growth: 9.5%(1)10%0-10%(1)(2)(3)2505007501,000FY22 Revenue ( Mn)India GDP data source: FY15-FY21 from RBI Time-Series Publication, FY22 estimate from NSO MOSPI Second Advance EstimateEach bubble indicates a logistics player listed in IndiaData for other entities from their public filings. Size of the bubble corresponds to Cash & Cash equivalents as on March 31, 2022 adjusted for any material fund-raising thereafter16
Delhivery is at the cross-section of severalgrowth drivers(1)INFRASTRUCTURELarge real estate footprint LeveragingIndia’s regulatory reforms &infra-development General capitalformationTECHNOLOGY & DATA SCIENCEData science, ML & AI Proprietarytech platform Cutting edgeengineering & automation Newage technologies – vision ML,drones, roboticsDIGITAL CONSUMPTIONeCommerce D2C/D2R Omnichannel Digital commerceOFFLINE COMMERCEOffline consumption Industrialactivity Cross-border trade171. As per RedSeer report
Appendix18
Delhivery: Team and DirectorsSahil BaruaManaging DirectorCEOSandeep BarasiaExecutive DirectorCBOKapil BharatiExecutive DirectorCTOAmit AgarwalCFOAjith PaiCOOAbhik MitraCCOPooja GuptaCPOSuraj SaharanHead, New VenturesDeepak KapoorChairmanKalpana MorpariaIndependent DirectorRomesh SobtiIndependent DirectorDon ColleranInvestor DirectorSaugata GuptaIndependent DirectorMunish VermaInvestor DirectorSrivatsan RajanIndependent DirectorSuvir SujanInvestor Director19
Industry outlookMarket conditions are challengingImproving regulatory environmentLarge opportunities remain intact Geopolitical conditions continue tocause significant disruption Infrastructure status for logistics,continued improvement of road, air andrail infrastructure e-Commerce market growth willcontinue; individual players likely tosee volatility in demand and risingcustomer acquisition costsContinued increase in online purchasefrequency, rising e-Commercepenetration in Tier 3/4 cities, newcategory development Tailwinds from Govt reforms - Make inIndia, Gati Shakti, PLI schemes M&A driven consolidation acrosslogistics industryRapid adoption of digitization (GST,EWB, e-POD, e-Invoicing) Continued shift towards organisedplayers and consolidation of LSPs bylarge enterprises Leading enterprises continue to shift to3PL/end-to-end supply chain visibilityand solutions Development of new automationsystems driving operating leverage andservice enhancements Input cost inflation continues to affectconsumer sentiment; unlikely to havelarge impact on non-discretionarylogistics spends, however Wage inflation and talent shortage toincrease in medium term Climate change continues to causesignificant disruption to operations New axle load norms enabling higherGWV and loading capacity of trucksONDC, new data privacy law likely toincrease merchant demand for directlogistics services20
Pan-India network coverage2,023 Surface connections connecting 8,659 OD pairs daily274 Air connections daily21Note: Maps for representation purpose only. Coloured portion of the maps represent Delhivery’s pin-code reach
Key operating metricsAs of end ofFY19FY20FY21FY22(1)Pin-code reach(2)13,48515,87516,67718,074Countries served424242220 No. of active customers(3)4,8677,95716,74123,613Infrastructure (in million sq. ft.)5.969.8512.2318.15Gateways738388123Automated sort centers17211921Processing 3,63930,63433,24260,3734308401,1891,224Partner agents(5)5,1919,78219,84434,360Fleet size – daily average3,1163,6945,0959,120Revenue/person ( )(6)9,09111,81814,28615,584Revenue/sq.ft. ( , Transportation)(7)56635766Revenue/sq.ft. ( , Warehousing)(8)NM5.14.56.4Express delivery centersFreight service centersTeam size(4)Partner centers (constellation/BAs)(1) Figures and calculations for FY22 on proforma basis(2) Out of 19,300 Pin-codes as per India Post(3) Active Customers for a quarter are those customers on whom an invoice was raised at least once during such quarter. Active Customers for a period are calculated as the average number of Active Customers for each of thequarters in the period(4) Includes permanent employees and contractual workers (excluding partner agents, daily wage manpower and security guards) as of the last day of the relevant period(5) Count of last mile delivery partner agents in the last month of the relevant period(6) Derived by dividing revenue from operations by total team size as described in note (4)(7) Derived by dividing Express Parcel PTL freight revenue by total logistics area excluding warehousing area(8) Derived by dividing revenue from warehousing segment of Supply Chain Services by weighted average warehousing area for the year22
Operating leverage improving consistently MnFreight, Handling and Servicing Cost(1,2)% of Revenue from Customers(1)Line haul expenses% of revenueContractual manpower expenses% of revenueVehicle rental expenses% of revenueRent% of revenueSecurity expenses% of revenuePower, fuel & water charges% of revenuePacking material% of revenueStores and spares% of revenueLost shipment expense (net)% of revenue(1) On reported basis(2) Breakup as per notes to 3%0.4%0.4%0.4%131590.5%1.3%0.5%1.0%1.0%23
Working capital position improving YoYNet Working ivable daysFY21FY22Payable daysNet Working Capital Days (Receivable Days – Payable Days)Receivable days (Trade receivable Unbilled receivables) * 365 / Revenue from operation 4Q annualized24
Strong liquidity positionDebt to Equity MnFY19FY20Term loan8222630Working capital )4404123687740.03x0.08x0.10x0.06xDebt (excludes CCPS) (A)Cash and cash equivalents1 (B)Net debt (A-B)Networth (C)Debt/Equity (A/C)(1) Includes cash and other bank balances, investments, margin money deposits and deposits with original maturity for 12 monthsFY21FY2225
Adjusted EBITDA bridgeAdjusted EBITDA(1) MnQ4FY21Q3FY22Q4FY22FY21FY22Total revenue130259269474940Less: Total expenses1492802935471,105Add: Finance cost on borrowings11137Lease Adjustments due to AS 11611166Add: Depreciation on right of use asset68825Remarks32Leased properties accounted as Right of Use (ROU)assets under Ind AS 116. Rent paid on such leasedproperties recognised in the P&L partly as depreciationon the ROU asset232910Rent obligation on leased properties accounted asLease liabilities under Ind AS 116. Rent paid on suchleased properties recognised in the P&L partly asinterest on such lease liabilitiesLess: Actual lease rent paid(7)(10)(10)(28)(37)Actual cash rent paid on leased properties recognisedunder Ind AS 116Add: Non-cash recurring costs1128323199Depreciation & amortization716202158Depreciation on tangible and intangible assetsESOP expense41212942Accounting expenses towards ESOPs already grantedAdd: Non-cash discontinued cost100139Non-cash expense due to fair value adjustment ofCCPSAdd: One-time discontinued cost000023One-time discontinued expense on account of certainemployee payments(5)1011(33)9Add: Interest on lease liabilitiesAdjusted EBITDA(1) FY22 figures are on proforma basis26
Adjusted Cash PAT bridgeAdjusted Cash PAT(1) MnProfit after taxLease adjustments due to AS 116Add: Depreciation on right of use 0)1116668825Remarks32Leased properties accounted as Right of Use (ROU)assets under Ind AS 116. Rent paid on such leasedproperties recognised in the P&L partly as depreciationon the ROU asset232910Rent obligation on leased properties accounted asLease liabilities under Ind AS 116. Rent paid on suchleased properties recognised in the P&L partly asinterest on such lease liabilities(7)(10)(10)(28)(37)Actual cash rent paid on leased properties recognisedunder Ind AS 116Add: Share of loss of associates0.00.00.40.00.4Non-cash share of loss after tax of associate companyAdd: Non-cash recurring costs1128323199Depreciation & amortization716202158Depreciation on tangible and intangible assetsESOP expense41212942Accounting expenses towards ESOPs already grantedAdd: Non-cash discontinued cost100139Non-cash expense due to fair value adjustment ofCCPSAdd: One-time discontinued costs &exceptional items000523One-time discontinued expense on account of certainemployee payments & exceptional item(2)1318(11)27Add: Interest on lease liabilitiesLess: Actual lease rent paidAdjusted cash PATNote: Not adjusted for any non-cash deferred taxes(1) FY22 figures are on proforma basis27
Wide ownership across organizationESOPs1StageESOPs granted, of whichVestedUnvestedESOPs ungranted, of whichTotal% shareholding on fully diluted erformance-based ESOPs217,100,000Time-based ESOPs326,747,397Total (Granted Ungranted)479,352,9735.45%9.87%Number of Employees holding ESOPs1 (vested unvested) : 1,418(1)(2)(3)(4)As of 14th May 2022To be unlocked in three equal tranches upon achieving share prices of 10, 130 and 156; and vest equally over 2 years thereafterVesting period of 4 years with schedule of 10%-30%-30%-30%Out of the total ESOP pool of 79.4Mn, 46.5Mn options have time-based vesting and 32.9Mn options have performance-based vesting28
Projected ESOP costsEstimated P&L charge (non-cash) for ESOPs alreadygranted1 MnDistribution of P&L charge over vesting period forfuture ESOP ) Related to costs attributable to ESOPs already granted; in event of forfeiture of ESOPs upon resignation/ termination of employee prior to completion of vesting, costs will bereversed. This does not include the costs of performance-based ESOPs of ESOP IV already granted(2) Cost of an ESOP Fair market value at time of grant minus exercise price ( 0.01), to be recognized in P&L over the vesting period as per the schedule in the table29
Quarterly & full year financial performanceProforma P&L MnQ3 FY22Q4 FY22Q-o-QGrowth %FY21FY22Y-o-YGrowth %2592694%57894063%Other income37129%2520(19%)Total 1238%1212(3%)1142286%00-023-21220%5610281%Fair value loss on financial liabilities--0%139-Finance costs43(16%)16174%242919%739024%Total expenses2802935%6761,10564%Share of loss of associates (net)0.00.4NA0.00.4NAProfit / (Loss) before exceptional items and tax(18)(17)NA(73)(145)NAProfit / (Loss) after Tax(16)(16)NA(77)(140)NA10119%(29)9NA3.7%3.9%20 bps(5.1%)1.0%606 bpsIncomeRevenue from customersExpenseTotal freight, handling and servicing costEmployee benefit expenseEmployee benefit expense excl. share based payments &one time expensesEmployee benefit expense: share based paymentsEmployee benefit expense: one time expensesOther operating expenseDepreciation and amortization expenseAdj. EBITDAAdj. EBITDA marginsLink to Reported P&L30
Quarterly & full year financial performanceReported P&L MnQ4 FY21Q3 FY22Q4 FY22Q-o-QGrowth %Y-o-YGrowth %FY21FY22Y-o-YGrowth %1302592694%107%47489489%Other income437129%90%2520(19%)Total 79%18303210%75%7010753%Employee benefit expense: share based payments41212(3%)207%940327%Employee benefit expense: one time expenses000--023-1221220%85%4899106%Fair value loss on financial liabilities1--0%0%139-Finance costs343(16%)(6%)121312%13242919%122%467972%Total expenses1492802935%96%5471,04791%Share of loss of associates (net)0.00.00.4NANA0.00.4NAProfit / (Loss) before exceptional items and tax(15)(18)(17)NANA(49)(134)NAProfit / (Loss) after 9%20 bps793 bps0.7%762 bpsIncomeRevenue from customersExpenseTotal freight, handling and servicing costEmployee benefit expenseEmployee benefit expense excl. share basedpayments & one time expensesOther operating expenseDepreciation and amortization expenseAdj. EBITDAAdj. EBITDA margins(4.0%)3.7%(6.9%)Link to Proforma P&L31
Balance sheet Mn MnEquity and LiabilitiesTotal equityMar 2021Mar 2022368774Non – current liabilitiesAssetsMar 2021Mar 2022Non – current cash de receivables77129Unbilled receivables48883337575971,072Non – current assetsBorrowings1715Property, plant and equipment (Incl CWIP)Lease liabilities8574Goodwill and other intangible assets(2)Provisions35Deferred tax liabilities (net)-8Right of use assetsInvestments in subsidiaries/associates(3)Non - current tax assetsCurrent liabilitiesOther non - current assetsBorrowings2231Lease liabilities212323Trade payables57108Other current liabilities2231Total liabilities229298Total equity and liabilities5971,072ProvisionsCurrent assetsCash & cash equivalents(4)InventoriesOther current assetsTotal assets(1) Includes non-current investments, non – current margin money deposits and non – current deposits with original maturity of 12 months(2) Including intangible assets under development(3) Includes investment in Falcon Autotech(4) Includes cash and other bank balances, current investments, current margin money deposits and current deposits with original maturity of 12 months32
Cash flow summary MnFY21FY22835(5)(64)3(29)(2)(2)Net cash from / (used in) operating activities1(31)Net cash from / (used in) investing activities44(357)77(50)Net cash from / (used in) capex and M&A(33)(307)Net cash from / (used in) financing activities(19)377Net change in cash26(11)Opening cash balance at the being of the year1036Closing cash balance at the end of the year (A)3625Cash equivalents at the end of the year(2) (B)224301Cash & cash equivalents at the end of the year (A B)260326Operating profit/ (loss) before working capital changesChanges in net assets(1)Cash generated from / (used in) operationsDirect taxes paid (net of refund)Net cash from / (used in) investing into treasury instruments(1) Change in inventory, receivables, other financial assets, loans, other assets, payables, other liabilities(2) Includes investments, margin money deposits and deposits with original maturity for 12 months33
Investing in capacity and capability buildingCapex Spends( Mn)Capex as % of TotalRevenues from Operations9.0%16.8%7.2%7.5%61Spill over of 13 Mn ofcapex into FY221.6%Covid 1.9%1.2%1.2%0.2%1.3%(1) As % of reported revenues for lesOthersTotal34
Proprietary technology atingSystemOperational InFleetfacility andManagementField AppsSystemOrder StateMachineParticipantsIntegratorQuality &TrackingClient ogyPartnerControl Tower Billing, Audit,ManagementP&L TrackingGeo on Infrastructure LocationManagementManagement Isolation and& emMonitoringDataIntelligenceLeversNotificationsApp and APIManagementEcosystem of 80 businessapplications that can be bundledinto solutionsAllows tenants to set businessspecific rules, policies andstructures (customize platformfor their operations)Core primitives provide reusable,business-agnostic tools andservices, define standardframeworks & governancemodels35
Data intelligence capabilitiesVehicle Trace DataOver 250 Mn GPS trace points daily across 80 Kunique devices(1,2)Location StackAddress standardization(6), geocoding, geofencing,locality polygons/ hierarchy, PoIs, travel / servicetimes, property typeLocation & Product DataAddress, product and customer data captured for60 Mn shipments delivered monthly(1,3)Pickup Points280 K monthly active pickup points includingclient warehouses and marketplace locations(1,3)Network Design & Optimization(7)Optimal facility location, capacity planning, networkconnections, dynamic dispatch and route creationFleet Data200 K monthly trips across 17 K trucks(1,3)Transaction Data1.8 Bn monthly shipment lifecycle eventscaptured(1,3)Customer Data150 Mn unique customers in the last year(1,4)Vision Data50 K cameras across facilities(1,5)Operator DataBIG DATASTACKIntelligenceETA, expected loads, Customer Fraud/ RTOprediction, Product dimension prediction, VehicleUtilization, PoD validation, service risk and anomalydetectionAnalyticsProductivity/ utilization, pricing/compensation, performance, demand forecastingActivity data from 45 K active operators in thenetwork monthly(1,3)(1)(2)(3)(4)(5)(6)(7)All figures excluding SpotonDaily average for March 2022For March 2022For April 2021 to March 2022As of March 2022Awarded US Patent for proprietary Addfix technology; 2 patents pending for unique address identification2 patents pending for intelligent system direction in the network36
EnvironmentESG initiatives GovernanceSocial 1.5MW of Solar power plants already installed at our Gurgaon and Kolkata mega gatewaysActive pilots on 2 & 3-wheeler EVs across first mile, last mile and carting and CNG in mid mile. Engaged withvarious OEMs to explore EV and LNG vehicle options for carting and line haul movementsIncreased utilization of Bharat VI compliant larger format 46’ trucks that are 14-25% more efficient than typical 32’& 24’ trucks that are prevalent in the industryImplemented E-PODs with select PTL clients Number of women off-roll employees grew 4x during FY22 to 1,887 as of March 31, 2022Delhivery Academy engaged in providing training & development to ensure upskilling from grass root tosupervisory levels. Special programme for driver safety to minimise on road accidentsVoluntarily engaged in community service*– o Distributed 794 tons of oxygen concentrators and other relief material during Q1FY22 (COVID second wave)o Contributions towards ‘Olympic Gold Quest’, a program oriented towards Indian athletes aspiring for the Olympicso Logistics partner of Goonj, an NGO focused on humanitarian aid and community development effortsSupported 80 team members with 0.24 Mn in FY22 through the Employee Welfare Fund Independent Board with all the requisite committees strongly committed towards highest degree of governance and disclosuresoo5 of 11 Board Members are Independent Directors; plan to appoint at least one more woman director by end of FY238 of 11 Board members are non-executive*Delhivery yet to qualify for mandatory CSR spend thresholds37
Definitions and abbreviationsAGVAMRASCBACCPSCross BorderD2CGSTE2EE-PODEVEWBFMCDLNGLSPNGONSE and BSEOD pairsOEMONDCPaaSPLIProforma financialsPTL FreightRedSeer reportSAASSCSSEASpotonTLWMSAutomated guided vehicleAutonomous mobile robotAutomated sort capacityBusiness associateCompulsorily convertible preference sharesCross border express parcel and freight service by the CompanyDirect to consumerGoods and service taxEnd to
Date: July 4, 2022 BSE Limited Floor 25, P J Towers, Dalal Street, Mumbai - 400 001 India Scrip Code: 543529 National Stock Exchange of India Limited Exchange Plaza, C-1, Block G,