Transcription
Sustainability Profilefor the Weddin CatchmentiCAM client report no. 2003 TARGET 4iCAM client report prepared for theTARGET project—a pilot project underthe New South Wales Salinity ManagementStrategyDecember 2002The Australian National UniversityIntegrated Catchment Assessment and Management (iCAM) Centre
Funding: The TARGET project is funded as part of the National HeritageTrust Murray-Darling 2001 program with joint funding from theCommonwealth and the State Salinity Strategy in New South Wales.Disclaimer: To the extent covered by law, iCAM (including its employeesand consultants) excludes all liability to any persons for any consequences,including but not limited to losses, damages, costs, expenses and any othercompensation, arising directly or indirectly from using this publication (inpart or in whole) and any information or material contained in it. Thefinancial calculations presented in this report are for general illustrativepurposes only and any person should consult with an appropriateprofessional adviser familiar with their particular situation before makingany decision based on material contained in this report.Watson, W., Evans, R. and Powell, J. 2002, Sustainability Profile for theWeddin Catchment, Integrated Catchment Assessment and Management(iCAM) Centre report prepared for the TARGET project, Australian NationalUniversity, Canberra.
ACKNOWLEDGMENTSWe thank all those who helped us in this project by supplying information andcommenting on drafts. In particular, we thank the producers of the Weddincatchment for their friendliness and hospitality, and for their willing participationand frank advice.We especially thank Dominic Nowlan and Craig Day of the Grenfell Department ofLand and Water Conservation office, who provided us with air photos showingrespondents’ properties, topographic maps showing the locations of homesteads,spatial data sets, introductions to producers, the survey schedule, and convenedgroup meetings.Sustainability profile: Mid Talbragar catchmentiii
CONTENTSEXECUTIVE SUMMARY. V1. INTRODUCTION .11.1 Project objective. 11.2 Location of properties . 22. DEVELOPMENT OF SUSTAINABILITY PROFILES.32.1 Procedure. 43. PRODUCER SURVEY RESULTS FOR WEDDIN.63.1 Recorded biophysical and socioeconomic data. 63.2 Attitudes to biophysical, production and social issues. 114. WEDDIN SUSTAINABILITY PROFILE .174.1 Water resources. 174.2 Land resources . 194.3 Vegetation resources . 214.4 Social situation . 224.5 Farm business economics. 245. IMPLICATIONS FOR ICM IN WEDDIN.255.1 Biophysical sustainability . 255.2 Social and economic sustainability . 265.3 Other issues . 276. CONCLUSIONS .28REFERENCES .30APPENDIX .31A. Geology and flow systems of the Weddin . 31B. Explanation of sustainability profiles. 34C. Property survey results tables. 36Sustainability profile: Mid Talbragar catchmentiv
Executive summaryThe Integrated Catchment Assessment and Management (iCAM) Centre from theAustralian National University carried out Sustainability Profile surveys in theWeddin catchment during August 2001. The Sustainability Profiles study was part ofthe TARGET project funded under the NSW State Salinity Strategy and NaturalHeritage Trust Murray Darling 2001 program.The objective of the iCAM study was to provide an improved understanding of thelikely long-term biophysical and socio-economic sustainability of the Weddincatchment, and an appreciation of the social and economic impediments to uptake avariety of land management options.Sustainability Profiles are a means of assessing the general health of a farmingsystem. The method is based on an analysis of the stocks and changes in a farm’swater, land, and vegetation resources, its social situation, and its business economics.In combination, these elements represent a “quintuple bottom line.”There were a number of key biophysical and socioeconomic findings from thesurveys: Salinity was seen as no problem or non existent by half of the respondents; Weeds was rated as at least a moderate problem by all of the respondents; After weeds, the next most important problems were soil acidity and foxes; Almost all of the respondents who had implemented some of the TARGEToptions over the last five years had done so for reasons other than salinity; Around half of the respondents were not intending to implement any of theTARGET options over the next five years; and, More than half of respondents recorded a farm cash income in 1999-2000below the estimated sustainability threshold of 50,000, with about one quarterof respondents recording a negative cash income.By synthesising the survey results with information from the Department of Landand Water Conservation, the iCAM group found that:Sustainability profile: Mid Talbragar catchmentv
The likely sustainability of the water resources in the three catchments studiedis unknown, mainly due to the lack of trend data for groundwater, streamflow,and in-stream salinity; The likely sustainability of the land resources appears assured, providingproducers continue with conservation farming and improved grazing systemsthat are improving soil cover, structure, fertility and Ph; The long term sustainability of the vegetation resources, particularly the woodyvegetation that is so important to conservation of biodiversity, is at risk; The high productivity and profitability of the land is likely to impede uptake ofthe TARGET options as most alternative enterprises and TARGETmanagement options involve a loss of profitability; Less than one third of the respondents are considered socially unsustainable;and, About half of the respondents are considered economically unsustainable, astheir farm cash surpluses in 1999-2000 were low to negative, despitehistorically low interest rates, favourable commodity prices (especially forlivestock), and a run of reasonably good seasons.The findings of the socio-economic work within the Sustainability Profiles projecthave major implications for uptake of the land management options offered, as theoptions generally require producers to take on more complexity and risk, not less. Inmany cases, producers’ management skills, decision-making capacity and familysituations (especially where producers and their spouses are working several jobs andraising children) are already stretched. These social factors alone are likely to impedeuptake of the land management options, even if producers were economicallysustainable.The iCAM group made the following conclusions: Salinity is not seen as a problem in the three sub-catchments surveyed; Few producers are in a position to adopt the TARGET options at the scaleenvisaged by the Department of Land and Water Conservation; The extent of the salinity hazard is uncertain; andSustainability profile: Mid Talbragar catchmentvi
Vegetation and biodiversity decline could be the most significant biophysicalthreat to agricultural sustainability in the Weddin region; and The broad range of comments collected as part of the profiles project, indicatesthat there are a significant number of financial and non-financial impedimentsto the land management options trialled in the first year of the TARGETproject. The TARGET project has been an evolutionary process and feedbackon the results from this project were used to revise the approach used in thesecond year. However, there are a range of impediments which remain andunless addressed, these issues will constrain natural resources andenvironmental management strategies. It is recommended that the keygovernment agencies responsible for the management of issues associated withthe broad range of comments are identified and processes implemented todevelop management actions to overcome these impediments.Sustainability profile: Mid Talbragar catchmentvii
11. IntroductionThe recent Murray Darling Basin Salinity Audit and the NSW SalinityManagement Strategy highlight the problem that the Central West Region ofNSW (catchments of the Macquarie, Lachlan & Castlereagh Rivers) faces nowand in the future with salinity. For example, it is predicted that salt concentrationin the Lachlan River at Forbes will be above the desirable limit for humanconsumption by 2050, and the average salt load of the Lachlan at Forbes in 2050will exceed 300,000 tonnes per year.The Tools to Achieve Landscape Redesign Giving Environmental /EconomicTargets Project (TARGET) is a cornerstone project of the NSW SalinityManagement Strategy. The TARGET project will facilitate large-scale land usechange in catchment areas that have been identified as being major contributorsto Basin wide salinity. These areas are the Lachlan and Macquarie catchments,and in particular, the Warrangong, Mid-Talbragar, Weddin and Little River subcatchments.The broad objectives of the TARGET project are to demonstrate the effectivenessof recommended salinity land management options and to identify theimpediments to producer participation in these programs. In addition, it isdesigned to ensure a more targeted distribution of incentive funding tolandholders in the four focus catchments and to achieve improved uptake ofrecommended land management options. These options include farm forestry,saline agro-forestry, perennial pastures, native pastures, saline pastures,conservation cropping, intercropping, and vegetation establishment and retentionfor remnant and riparian areas.A Project Board comprising representatives from DLWC (which chairs theBoard), the Lachlan and Central West Catchment Management Boards (CMB),and relevant Landcare Steering Committees manages the TARGET Project.TARGET implementation is expected to play a major role in assisting LandcareSteering Committee plans and CMB regional plans to achieve their salinityrelated objectives.1.1 Project objectiveThe aim of this component of the project is to develop sustainability profiles, aspart of the TARGET project, for individual farmers who participate in thesurveys and for the Weddin social catchment. In particular, it is designed toidentify impediments to producers participating in the strategic management ofnatural resource and environmental issues.Sustainability profile: Weddin catchment1
1.2 Location of propertiesThe Weddin Catchment component of the TARGET project encompasses an areacomprised of three surface water catchments – the Warraderry, Ooma andTyagong Creeks. The three catchments are contiguous, centred on Grenfell, buteach drains to a different portion of the Lachlan River Catchment.Warraderry Creek CatchmentThe Warraderry Creek catchment lies to the immediate north of Grenfell and risesin the hill country of the Warrumba Range to the east and the Warraderry Rangeto the west. The catchment is composed of the Warraderry and Native DogCreeks, which are the upper arms of the Goonigal Creek, which joins the LachlanRiver downstream of Goologong, about 5 kilometres downstream of the Nanamigauging station.Ooma Creek CatchmentThe Ooma Creek catchment lies to the west and north west of Grenfell, rising inthe Weddin Mountains and flowing northward onto the Lachlan Floodplain,where it joins the Lachlan River between Forbes and the Jemalong Weir. Itadjoins the Warraderry Creek catchment in its upper parts, being flanked by theWarraderry Range. For the purposes of the TARGET study, the catchment isrestricted to that part above the Thurungle Bridge where the Creek crosses theForbes/Grenfell Road. This is effectively the boundary where the Creek joins thebroader Lachlan Floodplain.Tyagong Creek CatchmentThe Tyagong Creek Catchment rises in the hills immediately to the east ofGrenfell across to Bumbaldry, and is an upper tributary of the Burrangong Creekand eventually the Bland Creek that discharges to the Lake Cowal wetlandsystem on the edge of the Lachlan Floodplain south east of Condobolin.A detailed description of the geology and groundwater flow systems in theWeddin catchment is provided at Appendix A.Sustainability profile: Weddin catchment2
22. Development of sustainability profilesA significant part of this study is aimed at assessing the medium and long-termsustainability of farming in the Weddin catchment and the nature of anyimpediments to the adoption of catchment management strategies or toparticipation in them.Sustainability is defined for the purposes of the Sustainability Profiles project asbeing:“The ability to indefinitely provide the land managers and the broadercatchment community with the lifestyle they aspire to while maintainingor enhancing the natural resource and environmental base”Sustainability is inherently a medium to long term concept concerning the wholefarm system. Consequently, the fine detail necessary, for example, of a currentyear financial assessment for farm management or taxation, is not required inassessment of sustainability profiles.Traditionally, the viability of farming systems has been based only on a financialassessment. However there has been significant change in farming systems overthe past few decades, especially in farm size, impact of a range of drivers on farmvalues, access to off-farm income and impact of a wide range of forms ofenvironmental degradation.Consequently, the concept of Sustainability Profiles has been developed as thebasis of assessing the general the “health” of a farming system, based on anassessment of the stocks and related flows of the following five key sub-systems(a “quintuple” bottom line): Water and climateLand, Soil and nutrientsVegetation, biota and genetic resourcesSocialFarm businessIndividual farm assessments of these sub-systems are aggregated to produce a‘Producer profile’.This approach provides the basis for an integrated, multi-disciplinary analysis ofsustainability. Each sub-system can be thought of as a stock, which is built up orrun down by farm management decisions associated with enterprise production.Farmers can make specific decisions to increase or decrease stocks in one of theabove five components. Farm viability is reliant on the maintenance of all stocksSustainability profile: Weddin catchment3
above key thresholds. In the short run, there may be enough of all of theseresources but if the stocks of any or all of the above stocks are run down, then inthe long run the farm will not be sustainable. Nor will a farm prosper, in themedium or long run, if there are problems in the quality of the water, the soil, thevegetation, the social or the farm business sub-systems.Assessment based on an integrated approach to all the farm sub-systems at thesame time, is particularly important as it enables the identification of key linkagesbetween the five components of the farm system. For example, land degradationimpacts are intimately linked to farm financial performance and alternatively thepressure of a poor financial performance frequently results in pressure on thenatural resource and environmental base.Because of the TARGET project’s emphasis on salinity management, theassessments of the biophysical criteria give specific attention to salinity processesand impacts both on-farm and off-farm.A more detailed explanation of the Sustainability profiles concept appears atAppendix B.2.1 ProcedureThis procedure was initially trialled in the Oolong catchment of NSW and hasalso benefited from its application in the Weddin catchment as part of theTARGET project. The assessment and development of sustainability profiles forthe Weddin catchment included the following key stages: Meeting with cooperating producers of the Weddin catchment and theCatchment Coordinator as a group to discuss the approach in detail; Development of a survey schedule to collect the information during farmvisits; Development of a data analysis system; Arrangement for suitable available data, maps and a background brief forthe Weddin catchment from DLWC and the Weddin Landcare Group; Assessment of the biophysical nature of the Catchment, including a crudeestimation of the catchment salt and water balance; Distribution of copies of the survey schedule to participating producerswith instructions which requested completion as far as possible before thefarm visits; Individual meetings with participating producers to:Obtain producer permission to include individual propertyinformation in a group report.Conduct a farm tour to identify the key components of the individualfarm system.Sustainability profile: Weddin catchment4
Complete the survey schedule including a discussion of agronomic,socio-economic and natural resource issues; the potential for newenterprises or new farm structures and the nature of impediments.Copies of the Draft Individual Farm Reports distributed to producers forvalidation;Presentation of details from the Draft Group Report made to participatingproducers; and,Incorporation of comments from participating producers and key membersof the TARGET project for finalisation of Individual Farm and theCatchment Group Report.Sustainability profile: Weddin catchment5
33. Producer survey results for WeddinThis section summarises the results of the property survey questionnaires thatwere completed as part of the 23 property visits. The complete tables of resultsare presented in Appendix C. Most financial and production data relate to the1999-2000 year.3.1 Recorded biophysical and socioeconomic dataLand useProperties surveyed in the Weddin catchment ranged from around 400 to over2,000 hectares in size with an average for the group of around 940 hectares. Themajority of properties (56 percent) were between 500 and 1,000 hectares in size.Thirteen percent of properties were between 250 and 500 hectares with a similarpercentage greater than 1,500 hectares. A further 17 percent of properties werebetween 1,000 and 1,500 hectares in area. The proportion of property area leasedwas mostly small.Property size distributionPercentage of properties (%)60.050.040.030.020.010.00.0less than 250250 to 500500 to 1,0001,000 to 1,500greater than 1,500Property size (ha)On average, around 50 percent of total property area was devoted to pasture. Themajority of properties (52 percent) had between 40 and 60 percent of theirproperty devoted to pasture. A further 35 percent of properties had between 20and 40 percent of their property under pasture. Thirteen percent of properties hada pasture proportion in excess of 60 percent. The dominant pasture type wasimproved perennial pasture, making up 57 percent of total pasture area.Sustainability profile: Weddin catchment6
The area devoted to farm forestry, revegetated land and remnant vegetation wasrelatively small (average of 8 percent of total property area or 79 hectares). Thelargest area of trees on any one property was 27 percent of total property area andthe smallest area was less than one percent. Farm forestry comprised the lowestproportion of total tree area at three percent. Remnant vegetation comprised thelargest proportion with 87 percent and revegetated area at 10 percent.All 23 properties in the catchment undertook some form of livestock productionand all properties undertook grain cropping. The two main crops were wheat andcanola. Twenty-two properties grew wheat during 1999-2000 and 21 propertiesgrew canola. The next most grown crops were triticale (12 properties), lupins (10properties), oats (6 properties) and barley (2 properties). Sixteen propertiesproduced hay or silage during the year although none grew a fodder crop.In terms of area grown, wheat was the dominant crop for the Weddin group withan average area grown of 184 hectares. Around 17 percent of properties grew lessthan 100 hectares of wheat, almost 40 percent of properties grew between 100and 200 hectares and the remaining 43 percent of properties grew between 200and 400 hectares of wheat. The average yield for wheat was 4.4 tonnes perhectare.With respect to crop production methods, around 35 percent of respondents usedminimum tillage and crop rotations. Fifteen percent of respondents used zerotillage and five percent used conventional tillage. Full details of land use surveyresponses can be found in tables 1, 3 and 11 in Appendix C.Livestock productionSheep, and to a lesser extent cattle, were the dominant livestock activities for theWeddin group. Just over 50 percent of the group ran both sheep and cattle whileabout 40 percent had sheep only. The most common grazing system used forsheep and cattle was rotational grazing.With respect to stocking rates, the average number of dry sheep equivalents(DSEs) carried was 11.9 per pasture hectare with a range from around 4 to 24DSEs. The majority of properties running sheep and/or cattle had stocking ratesin excess of 9 DSEs per hectare.On average just under 1,300 ewes were run with a group maximum of around4,000 ewes. The average lambing percentage was 87 percent. Average wool cutwas about 5.2 kilograms per animal shorn. The average sale price per sheep was 28. The average sale price for cattle sold was 497. The average calvingpercentage was 82 percent and the maximum number of breeders run was justunder 300 head. Refer to table 3 in Appendix C for further details on livestockproduction.Sustainability profile: Weddin catchment7
Average stocking rate70.0Percentage of properties (%)60.050.040.030.020.010.00.0less than 55 to 77 to 9greater than 9DSEs per hectareFertiliser usageAlmost all respondents topdressed their pastures, however, the frequency withwhich this was done varied considerably. The most common frequency was every1–2 years. Around 55 percent of respondents who topdressed pastures used thisapplication interval. The remaining 45 percent who topdressed pastures usedapplication frequencies of either every 3–5 years, during pasture establishment orhad no fixed pattern. Just over 20 percent of the group topdressed pastures withlime.All respondents applied fertilizer to wheat on a regular basis and 21 respondentsapplied fertilizer regularly to canola. Canola was the crop that most respondents(19 properties) applied lime to on a regular basis.The most common basis for making both fertilizer and lime application decisionswere soil tests and agronomist’s advice.With respect to general soil pH levels, most respondents rated their pH range asbeing between 4.6 and 5.5. Over 80 percent of respondents indicated this was therange for their crop paddocks and 70 percent believed it was the range for theirpasture paddocks.Full details of fertiliser use survey responses can be found in tables 7, 8, 9 and 10in Appendix C.Sustainability profile: Weddin catchment8
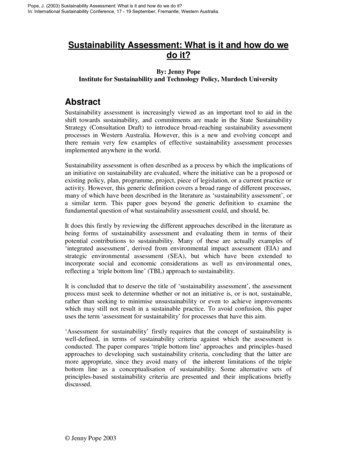
Water resourcesDams were the most common source of on-property water (21 properties). Onaverage, the estimated maximum quantity of water stored in property dams was31 megalitres. The average number of dams per property was 16 (up to amaximum of 39). Bores and creeks were the next most common sources of onproperty water (13 properties respectively). Refer to table 4 in Appendix C forfurther details on water resources.Labour useOwner-operators provided the majority of labour use on properties (average 27months per property). An average of five months came from casual labour whilepermanent labour (average of one month) was not widely used. Off-propertylabour comprised 16 percent of total labour (both on-property and off-property).Refer to table 2 in Appendix C for further details on labour use.Financial performanceIn 1999-2000, the Weddin properties generated a total of over 6.6 million ingross cash receipts from primary production activities. The average gross cashreceipt per property was just over 302,000.Total cash costs averaged about 219,000 per property, and on average,properties in the Weddin survey had a property cash income of around 83,000.There was, however, significant variation around this average. About 14 percentof respondents recorded a negative property cash income while 18 percent ofrespondents recorded a figure of between zero and 25,000. Fourteen percent ofrespondents had a property cash income of between 25,000 and 50,000. Thelargest percentage of respondents (54 percent) had a property cash income inexcess of 50,000.After accounting for trading stock changes and depreciation, the average propertybusiness profit for the group fell to about 57,000. Again there was considerablevariation around this average with 23 percent of the group recording a negativebusiness profit, 36 percent having a business profit of between zero and 50,000and 41 percent of the group having a business profit of greater than 50,000.The highest contributor to total cash receipts was grain sales (47 percent).Livestock sales contributed 21 percent and wool sales 16 percent. Off-propertyincome was not a significant contributor at 12 percent of total cash receipts.Sustainability profile: Weddin catchment9
Property cash income distributionPercentage of properties (%)60.050.040.030.020.010.00.0negative0 to 25,00025,000 to 50,000greater than 50,000Cash income ( )On average, surveyed properties had total business assets valued in excess of 1.8million and an average debt of about 245,000.Average business equity for the group was 86 percent. This relatively highaverage was reflected in the distribution of business equity with 41 percent of thegroup having an equity ratio of between 90 and 100 percent and 27 percent ofrespondents having equity of between 80 and 90 percent. Thirty-two percent ofrespondents had a business equity of less than 80 percent.Of respondent’s total equity, an average of 88 percent was based on primaryproduction equity (e.g. land, machinery) while 12 percent was based on nonprimary production equity (e.g. town property, shares).Refer to table 5 in Appendix C for further details on financial performance.Social profileIn the Weddin catchment there is a relatively broad distribution of age groupswith a large group of dependent children (41 percent of males and 36 percent offemales). Twenty-one percent of males and 24 percent of females were 56 yearsand over. Twenty-nine percent of males and 30 percent of females were between26 and 45 years of age.In general, it is a very experienced farming group with 71 percent of males and41 percent of females having more than 21 years of farming experience. Only 7percent of males had less than 10 years experience however there was a largegroup of females (41 percent) with less experience.Sustainability profile: Weddin catchment10
Fifty-four percent of male respondents had post secondary school qualifications(26 percent tertiary and 28 percent trade/vocational). For female respondents, thecorresponding figure was 70 percent (46 percent tertiary and 24 percenttrade/vocational).Refer to table 6 in Appendix C for further details on social profiles.3.2 Attitudes to biophysical, production and social issuesRespondents were asked a number of attitudinal and intentions type questionsrelating to land condition, salinity/high watertable trends and damage, past andintended implementation of salinity mitigation measures, property future andthreats, condition of capital equipment, current and prospective enterprises andlocal services.Land conditionThe land condition problem of most overall concern to the group was weeds. Allrespondents rated weeds as at least a moderate problem and 57 percent ofrespondents rated it as at least a serious problem.The next two most important problems to the group were acidity and foxes.Acidity was nominated as at least a slight problem by 96 percent of respondentsand as at least a moderate problem by 83 percent of the group. Foxes were atleast a slight problem for 87 percent of respondents and a moderate problem for52 percent of respondents.Salinity/high watertables, along with rabbits, woody weeds, sodicity andscalds/bare earth were considered to be of less concern to the group. At least 50percent of respondents rated these problems as no problem/non-existent).Across all possible problems the most common rating was no problem/nonexistent (38 percent of total ratings). A slight rating was the next most common at27 percent of total ratings. A moderate rating accounted for 21 percent of allratings while a serious and don’t know rating accounted for just 13 and on
gauging station. Ooma Creek Catchment The Ooma Creek catchment lies to the west and north west of Grenfell, rising in the Weddin Mountains and flowing northward onto the Lachlan Floodplain, where it joins the Lachlan River between Forbes and the Jemalong Weir. It adjoins the Warraderry Creek catchment in its upper parts, being flanked by the