Transcription
CORPOR ATE PRESENTATION Q2 2021SEPTEMBER 2021
SAFE HARBORSTATEMENTThis presentation has been prepared by GCC, S.A.B. de C.V. (togetherwith its subsidiaries, “GCC”). Nothing in this presentation is intended tobe taken by any person as investment advice, a recommendation to buy,hold or sell any security, or an offer to sell or a solicitation of offers topurchase any security.Information related with the market and the competitive position ofGCC was obtained from public sources that GCC believes to be reliable;however, GCC does not make any representation as to its accuracy,validity, timeliness or completeness. GCC is not responsible for errorsand/or omissions with respect to the information contained herein. Due torounding, numbers presented throughout this presentation may not addup precisely to the totals provided and percentages may not preciselyreflect the absolute figures.Forward Looking StatementsThis presentation includes forward looking statements or information.These forward-looking statements may relate to GCC’s financial condition,results of operations, plans, objectives, future performance and business.All statements that are not clearly historical in nature are forwardlooking, and the words “anticipate,” “believe,” “expect,” “estimate,”“intend,” “project” and similar expressions are generally intended toidentify forward-looking statements. The information in this presentation,including but not limited to forward-looking statements, applies only as ofthe date of this presentation. GCC expressly disclaims any obligation orundertaking to update or revise the information, including any financialdata and forward-looking statements, as well as those related to theimpact of COVID-19 on our business, supliers, consumers, customers andemployees; disruptions or inefficiencies in the supply chain, including anyimpact of COVID-19.Any projections have been prepared based on GCC’s views as of the dateof this presentation and include estimates and assumptions about futureevents which may prove to be incorrect or may change over time. Theprojections have been prepared for illustrative purposes only, and do notconstitute a forecast. While the projections are based on assumptions thatGCC believes are reasonable, they are subject to uncertainties, changesin economic, operational, political, legal or public health crises includingCOVID-19, and other circumstances and other risks, including, but not limitedto, broad trends in business and finance, legislation affecting our securities,exchange rates, interest rates, inflation, foreign trade restrictions, and marketconditions, which may cause the actual financial and other results to bematerially different from the results expressed or implied by such projections.EBITDAWe define EBITDA as consolidated net income after adding back orsubtracting, as the case may be: (1) depreciation and amortization; (2) netfinancing expense; (3) other non-operating expenses; (4) taxes; and (5)share of earnings in associates. In managing our business, we rely onEBITDA as a means of assessing our operating performance. We believethat EBITDA enhances the understanding of our financial performanceand our ability to satisfy principal and interest obligations with respectto our indebtedness as well as to fund capital expenditures and workingcapital requirements. We also believe EBITDA is a useful basis ofcomparing our results with those of other companies because it presentsresults of operations on a basis unaffected by capital structure and taxes.EBITDA, however, is not a measure of financial performance under IFRS orU.S. GAAP and should not be considered as an alternative to net income as ameasure of operating performance or to cash flows from operating activitiesas a measure of liquidity. Our calculation of EBITDA may not be comparableto other companies’ calculation of similarly titled measures.Currency translations / physical volumesAll monetary amounts in this presentation are expressed in U.S. Dollars( or US ). Currency translations from pesos into U.S. dollars use theaverage monthly exchange rates published by Banco de México.These translations do not purport to reflect the actual exchange rates atwhich cross-currency transactions occurred or could have occurred.The average exchange rates (Pesos per U.S. dollar) used for recentperiods are:Q2-21- 20.0416Q2-20 - 20.1843H1-21- 23.3510H1-20 - 21.6324Physical volumes are stated in metric tons (mt), millions of metric tons(mmt), cubic meters (m3), or millions of cubic meters (mm3).2
REFLECTION OF THE STRATEGY EXECUTION SINCE 2016Deleveraging as soon as possibleONE OF THESTRONGESTPLAYERS INTHE INDUSTRYMaintaining a healthy cash balanceRefinancing bank debt and notes, extending maturities andreducing the average cost of debtSwapping non-integrated ready-mix assets for Montanacement plant without increasing debtSuccesfully completing Rapid City cement plant expansionMaintaining strict M&A criteria with a focus on value for purchase,at a cost within strict pre-determined parameters3
PEOPLE AND BUSINESS CONTINUITYDeveloped specific health and safety protocols for each of GCC’s operationsACTION PLANEnacted “work from home” protocols for the majority of employeesTO MITIGATEEstablished skeleton crews wherever possibleCOVID-19 IMPACTEnsured that every employee receives their full salary and benefitsContinuously monitoring and assessing market demand, economic fundamentals and government regulationsEstablished contingency plans to ensure a safe operation and uninterrupted supply to customers,supported by GCC’s robust manufacturing and distribution networkWorking closely with cement and concrete associations in both Mexico and the U.S.4
Cost and expense reductions throughout the organizationVariable costs and distribution efficienciesCASH, LIQUIDITYAND BALANCESHEETAchieved US 24 million in savings during 2020e.g. hiring freeze, not filling vacant positions and limiting external service providersDeferred all non-essential projectsCash and equivalents totaled US 593 million in Q2-21Net debt/EBITDA decreased to 0.06x as of June 2021No significant debt maturities in 20212024 US 260 million bond callable in June 2021Strong balance sheet, result of the strategy of maintaining an efficient andprudent capital structure5
INVESTMENTHIGHLIGHTSTICKER: BMV: GCC1Leading position in attractive U.S. regional markets and in Chihuahua, Mexico2Mexico operations also provide a strong base, and add operational flexibilitywith export capacity3Vertically integrated, with state of the art production facilities and logistics4Increased free float and liquidity5Healthy balance sheet and strong free cash flow drive value creation6
MORE THAN FIVE YE ARSOF O PER ATIONALAND F INANCIAL T R ANSFORMATIONAS OFDECEMBER2020 VS 2014Disciplined expansionCustomer focusOperational excellenceCementEBITDAEBITDANet Debt/CapacityGrowthMarginEBITDA 100% 1,250bp 1.4mmt 33%Prudent balance sheetmanagementIncreased shareholdervalueFree FloatShare Price(07/30/21)2.28x25%0.24x48% 325%7
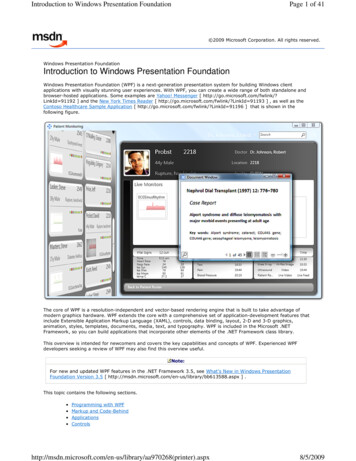
5.8 MMT1 cement production capacity3.5 MMT in U.S. 2.3 MMT in MexicoGCC AT A G L ANCE:A UNIQUE MARKETPRESENCE#1 or #2 share in core marketsLandlocked states, insulated from seaborneCEMENT AND READY-MIX CONCRETE OPERATIONSACROSS THE “CENTER CUT“ OF NORTH AMERICAcompetition8 cement plants, 23 terminals, 2 distribution centersand 94 ready-mix plantsALBERTA80 years of operation – 26 in the U.S.Listed on Mexican Stock Exchange: GCC*MTNDMNIncluded in: S&P/BMV IPCMSCI IndexesFTSE IndexesFTSE BIVAIDWYWISDIANEUTCOKSOKNMW. TXKEY RESULTSLTM Q2 2021CHIH.US 979 million sales 72% U.S. / 28% MexicoUS 328 million EBITDA 74% U.S. / 26% Mexico33.5% EBITDA marginNet leverage of 0.06x81MMT million metric tons
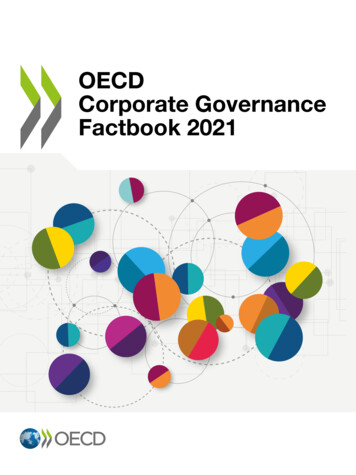
ALBERTAREGIONAL LEADER IN U.S. MID-CONTINENT MARKETS#1WELL-POSITIONED TO CAPTURE U.S. GROWTH AND CONSTRUCTION INDUSTRY RECOVERY#3MTND#1ID#2MNWISDWYLeadership position in 16 contiguous statesCO, MN, MT, ND, NM, SD and W.TX are our core markets, with 85% of U.S. salesIANE#2UTNo other producer competes with GCC across all our marketsCOKS#1TNMOKDiversified regional economies with low unemployment, offering clearupside to U.S. construction recoveryW TXPricing upswing since 2013#1E TXLimited prospects for greenfield capacity expansionWell-protected from seaborne importsLarger salesSamalayuca and Juarez plants inChihuahua can supplement theU.S. market with 0.5-0.7 mmtMid salesLower salesCoal mineCement plantConcreteCement terminals#Rapid City, SD plant expansion ( 0.4 MMT) increased U.S. cement capacityto 3.5 MMT per year (finished 4Q18)Trident, MT cement plant acquisition (June 2018)Market positionin each state9
GCC U.S. CEMENT SALESGCC U.S. CONCRETE SALES(’000 MT)3yr CAGR 1.0%MARKETS WITHDEMONSTRATED(’000 M3 / YEAR)3yr 1809279189019392017201820192020860VOLUME ANDPRICE RECOVERY2017201820202019LTM Q2-21GCC U.S. CEMENT PRICESLTM Q2-21GCC U.S. CONCRETE PRICES3yr CAGR 3.3%(CHANGE, YEAR-OVER-YEAR)3yr CAGR 6.3%(CHANGE, 3-20 Q2-2110
WHERE GCC FACES FRAGMENTED COMPETITIONAND HAS A DIVERSIFIED BUSINESS MIXGCC MARKET POSITION AND COMPETITORS IN CORE MARKETSCOLORADON. MEXICON. DAKOTAS. DAKOTAW. TEXASWYOMINGMONTANA#2#1#3#1#1#2#1GCC market position—GCC cement plant in stateCompetitor in-state plant** Aprox. 12 mmt of capacityin East and Central Texas———BZU*EXPCRHEXPLHNHEI, LHNCRHLHN, CRH**——U.S. 2020 SALES MIXCementand mortar69%—LHN, CXOther principal competitorsU.S. 2020 PRODUCTION VOLUME BY CEMENT TYPEReady-mixconcrete20%Oil-well cement9%U.S. 2020 SECTORS1Government49%Residential25%6% of GCC’stotal volumeOther11%Gray cement,specialty andmasonry91%Oil Rig/Well9%1* Refers to West Texas onlySales by segment, weighted GCC sales by state. PCA Winter forecast 2019Commercial17%11
AND A CLEAR NEED FOR INCREASED INFRASTRUCTURE SPENDINGDEFICIENT ROADS 1CEMENT FUNDAMENTALS 2LANE MILES RATED ‘POOR’AS A SHARE OF TOTAL LANE MILESBASED ON PCA SECTOR AILKSAZOKNMTXAbove AverageAverage ConcentrationAverageLowest ConcentrationBelow AverageSource: PCA Market Intelligence, Regional Analysis (July 2020)WVVAKYNCTNARLANJDEMDSCMSALGAFLHighest ConcentrationSource: PCA United States’ Cement AMARICTNYIANEMTORMNIDNVWANH*Res: Mortgage Delinquency and Unemployment Rates, Home PricesNon Res: Manufacturing, Office, Retail and Hospitality (Jobs Recovered)Public: Fiscal Health, Transportation Capital Expenditures, Employment, Long-Term Public Debt12
FORECAST CEMENT CONSUMPTIONIN ALL GCC U.S. MARKETS (MMT) 14yr CAGR 3%LEADING TO APOSITIVE OUTLOOK,IN INFRASTRUCTURESPENDING43.132.2DRIVEN BY ANEXPECTED INCREASEHIGHWAY BUDGET AUTHORIZATIONSINCLUDED IN THE FAST ACT ( BB) 28.52.0%3.0%1.5%1.2%2019201820202021EFORECAST TOTAL U.S. CEMENTCONSUMPTION (MMT)³99.84yr CAGR 2.5%106.4104.8101.720152022E2016201720182019U.S CEMENT DEMAND WILL OUTPACE SUPPLY BY 2023,IMPORTS WILL BE A CRITICAL SOURCE OF 019Total E2023E 2024EU.S Annual Cement Consumption (mmt) % as previous yearAnnual Cement Capacity (mmt)Sources: U.S. DOT Federal Highway Administration, PCA, and DBA 2Fixing America’s Surface Transportation Act, signed into law 2015 1PCA Summer 2021 Forecast AnalysisPCA Summer 2021 Forecast313
PORTLAND CEMENT ASSOCIATION (PCA) SUMMER 2020FORECAST AND MAIN CONSUMERSWITH A SOLIDOUTLOOK IN .7%--201720181- Residential202020192- Government2021E201820171- Government3- CommercialTotal Consumption (000MT) % vs previous year2- Residential3- CommercialSOUTH DAKOTA80070070060020.1%24.1%5005002021E % Oil Rig/Well Cement vs previous yearNEW %0.0%200200-4.0%0.9%100100--201720181- Government20192- Residential20202021E3- Agricultural201720181- Government20192- Residential20202021E3- Agricultural14Source: PCA Summer 2021 Forecast Analysis; oil well cement variations updated in January 2021* Oil-well cement variations include West South Central
WHILE IN A FAVORABLE PHASE OF THE U.S. CEMENT CYCLEU.S. CEMENT PRODUCTION AND CONSUMPTION140120ConsumptionActual 2003-2020Estimated 11201320152017201920212023Source: USGS, PCA2020 U.S. apparent consumption is still 20% below 2005 peak (26 MMT)Import share is about 13% of consumption, compared to 23% share in 200615
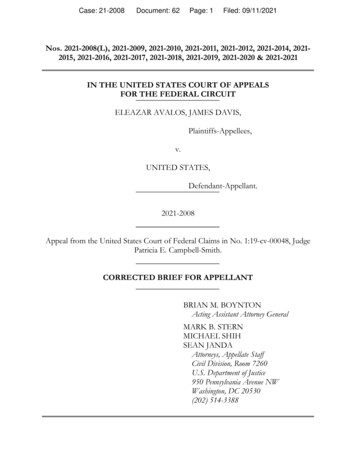
GCC IS THE LEADING PRODUCER IN THE STATE OF CHIHUAHUA,WITH SIGNIFICANT EXPORT CAPACITYExportsto U.S.GCC is sole producer of cement and the leading producerof ready-mix concrete in Chihuahua.JuarezSamalayucaClose economic ties between Chihuahua and the U.S.ChihuahuaCyclical recovery benefitForeign direct investment targetCuauhtemocCement plantOcampoOther operations Concrete plants Distribution centers Aggregates Concrete block Asphalt plant Pre-cast plantDemand growth driven by private sectorParralFlexibility to supply Texas and New Mexico demand fromSamalayuca and Juarez plants2020 SALES MIXEXPORT SHARE OF MEXICO’S VOLUME SALESCEMENT PRICING TRENDS(% CHANGE 8%61%58%Bagged33%Concrete 4.7%Cement M Q2-2120162017201820192020H1-2116¹ Price changes in local currency
FUELVERTICALLYINTEGRATEDOPERATIONSGCC IS PRESENT AT ALLSTAGES OF THE CEMENT ANDREADY-MIX SUPPLY CHAINCoal mine in Colorado provides a significant source of fuelfor GCC cement plants, lowering costs and reducing pricevolatilityRAW MATERIALSGCC owns most of the limestone quarries needed to supplycement, ready-mix and aggregates operations over thelong-termCEMENT8 plants in the U.S. and Mexico, close to raw materials sourcesREADY MIX94 plants. GCC cement plants supply almost a 100% of thecement used in our ready-mix operationsCEMENT TERMINALS23 cement terminals, 2 distribution centers, and transferstations from Chihuahua to the U.S. –Canadian borderTRANSPORTMore than 2,350 leased railcars and 700 mixer and haultrucks to transport cement, concrete and aggregates17
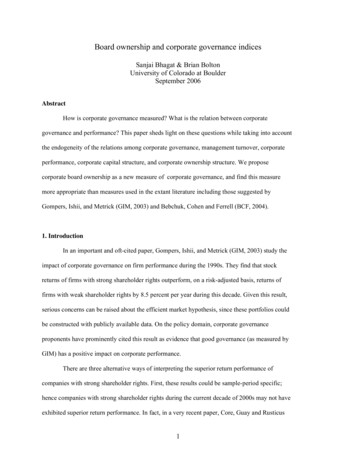
Pueblo, COWITH STATEOF THE ARTPRODUCTIONFACILITIES1.1 MMT2008 startupChihuahua, Chih.Rapid City, SD1.1 MMT1941 startup2009 modernized1.1 MMT2018 expansion5.8 MMTUnited States3.5 MMTTijeras, NM0.4 MMT2015 modernizedCement production capacity1.1 MMTAvailable clinkercapacitySamalayuca, Chih.1.0 MMT1995 startup2002 modernizedMexico2.3 MMT(June 2021)Odessa, TXJuarez, Chih.0.5 MMTOil well cement2016 acquired0.1 MMTSpeciality cements1972 startup2000 modernizedTrident, MT0.3 MMT2018 acquired18
OPERATING AT NEAR-OPTIMALCAPACITY UTILIZATION LEVELS95%97%96%90%87%82%85%80%78%76%U.S. industryestimated average86%86%79%78%72%66%65%56%53%20192020Mx AvgChihuahuaSamalayucaMEXICOJuarezTijerasRapid CityPuebloOdessaTridentUS AvgUNITED STATES191Expansion shutdown
ROBUST LOGISTICS PLATFORM STRETCHESFROM NORTHERN MEXICO TO THE U.S.BORDER WITH CANADALINKED BYSOPHISTICATEDDISTRIBUTIONNETWORK tional flexibilityCost efficiencyFaster delivery timeIDNDMTMNAdvanced logisticsReduced supply disruption riskHard to replicateWISDIDWYNEBrand loyalty and client trustWIIAUTRedundancyCOKSOKW TXNME TX23 cement terminals, 2 distributioncenters, and transfer stationsCHIHUAHUA 2,350 leased rail carsCement terminal94 ready-mix plants, 700 mixerand haul trucksCement plantsIllustrates sale of cement fromorigin state to destination state20
OPTIMIZING OPERATIONS FOR VALUE GENERATION12.4% ROIC10.5%9.6%9.1%8.9%9.0%Value generated9.0%8.8%9.2%8.4%8.1%7.5% WACC7.0%5.8%201420152016201720182019Any projections have been prepared based on GCC’s views as of the date of this presentation and include estimates and assumptions about future events which may prove to be incorrect or may change over timeROIC NOPAT / Avg. Invested CapitalWACC [Cost of Equity x (Market Value of the Company’s Equity Total Market Value of the Company)] [Cost of Debt x (Market Value of the Company’s Debt Total Market Value of the Company)]202021
GCC GENERATES A HIGHER ROIC THAN MOST OF ITS U.S. PEERS.14.5% EXP12.4% GCC10.5%9.6%9.6% VMC9.0%9.5% MLM8.1%7.0%20156.2% SUM20162017201820192020E22Source: Company and J.P. Morgan estimates
. AS WELL AS ITS LATAM PEERS2212.4% GCC10.5%9.0%9.6%11.6% CX8.1%7.0%-520154.8%CEMARGOS3.9% CLH2.6% ELEMENT2016201720182019202023Source: Company and Morgan Stanley estimates
RECENTDEVELOPMENTSENHANCEGCC’S VALUEPROPOSITIONCement CapacityGrowingEBITDAGrowingDebt FallingandRefinancingIncreased freefloat andliquidity 514k mt 63%0.06x48%Odessa in 2016acquisitionEBITDA growthsince 2016Net leverageof total shareson BMV 440k mt32.9%BBB- 23%Investment gradeFitch ratingFree Float 315k mtBBB-S&P/BMV IPCTrident in 2018acquisitionS&P ratingIndex inclusion 18 mmFTSERapid City in 2018expansion2020 marginAnnual interestsavingsIndex inclusionMSCIIndex inclusionFTSE BIVAIndex inclusion24
REDUCTION OF ANNUAL INTEREST EXPENSES BY US 18MFitch and S&P upgraded GCC’s rating to investment grade (Q1-21)MATURITY PROFILE(US million)Bond interest coupon decreased to 5.250% from 8.125% (June 2017)BOND ANDBANK DEBTREFINANCINGSTRENGHTENFINANCIALPOSITIONCallable June 2021260Bank debt refinancing yields an estimated US 10 million inannualized interest expense savings (June ableDATE02/21202120222023202403/21DEBT COMPOSITION (JUNE 2021, US MILLION)DEBT RATIOS(June 30, 2021)SECURITIES DEBTBANK DEBTNotes due 2024 2602018 Refinancing 352Net Debt / EBITDA0.06xEBITDA / Net InterestExpenseINTEREST RATES5.25%17.9xLIBOR 1.75% (variable)Blended: 3.33%25Debt amounts based on loan contract amounts. IFRS balance sheet values slightly lower
DEBT AND CAPITAL EFFICIENCY INDICATORSSTEADILY IMPROVINGEBITDA MARGINEBITDA MARGINROICROIC(NOPAT / Avg. Invested Capital) (NOPAT / Avg. Invested 018**2016 20202017*2019Debt / EBITDA) RATIONET (NetLEVERAGENET LEVERAGE .55x2016 2020201720195850201820192020(Based on sales)1.11x5858555047 4646470.24x201820192020 2013201420152013201620142017Year-end days in WC* Proforma after asset swap**Explained partially by Rapid City plant’s expansion shutdown2015201859551.55x2016 2020201720192014201776760.24x20142014(Based on sales) CAPITALWORKING CAPITALWORKING(Net Debt / EBITDA)1.11x20132020 20133.45x3.45x3.1%3.1%17.3%17.3%5.8% 15.6 ppt 5.8% 15.6 ppt9.6%201520182016 202020172019201820192020Year-end days in WC26
STRENGTHENED MARGINS AND LOWERINDEBTEDNESS THAN MOST OF OUR PEERS2021 estimated Net Debt/EBITDA multiples*5.1xUS Average1.3xLatAm gos2021 estimated EBITDA margins*US Average 29.9%LatAm Average Cemex18.7%Elementia27Source: J.P. Morgan (January 2021) and Morgan Stanley (May 2021) estimates
CAPITAL MARKETS TRANSACTIONS INCREASED SHARE FLOATAND LIQUIDITY; VALUATION REMAINS ATTRACTIVETRANSACTIONS BENEFIT PUBLICMARKET SHAREHOLDERS2021 ESTIMATED EV/EBITDA MULTIPLES1Transparent control group shareholdingsFloat increased to 48% of shares15.9xIncreased liquidityUS Average 12.7x14.7x11.4x9.2xSHARES STILL TRADE BELOW PEER GROUPMULTIPLESLatAm Peers 7.6x11.1x8.5x7.6x7.7x7.3x6.9xEven after 137% price increase since 2017GCCTrading at a 33% discount to weighted iaLatAm40% discount to U.S. averageNo discount compared to LatAm average1Source: J.P. Morgan (January 2021) and Morgan Stanley (May 2021) estimates2Weighted peers implies: 74% US peers 26% LatAm peers28
LIQUIDITY HAS INCREASED SIGNIFICANTLY AS A RESULT OF CORPORATE DEVELOPMENTSAND STOCK MARKET POSITIONINGAVERAGE DAILY TRADING VOLUME, SHARES1“Re-IPO,” February 2017485,000MSCI Index inclusion, June 2018IPC Index inclusion, September 2018LIQUIDITYENHANCINGEVENTS276,000FTSE Index inclusion, March k of AmericaBanorteCredit SuisseData Based AnalysisGBMInvexItaúJP MorganMorgan StanleyNau SecuritiesSantanderScotiabankUBSVe por MásAverageRatingBuyNeutralBuyOutperformNot AuthorizedOutperformMarket rformBuyBuyAverage before"re-IPO”Post "re-IPO"Post indexesinclusionJan 2016 – Feb 2017Feb 2017 – Jun 2018Jun 2018 – Jul 2021FTSEIndexesFTSE BIVAMSCIS&P/BMV IPCBuy1 Source: BMV; GCC calculations1 Averages exclude trading volumes at time of re-IPO and partial early termination of equity forward29
GCC JOINED THE GLOBAL CEMENT AND CONCRETEASSOCIATION IN 2018MAIN GOALS REDUCE NET CO2EMISSIONS BY 9%2030REDUCE NET CO2EMISSIONS BY 22%2050COLLECTIVE AMBITIONFOR CARBON NEUTRALCONCRETEHOW?Sustainable Development Performance Targets2020SUSTAINABLEDEVELOPMENT GOALSClimate & EnergyEnergy efficiencyCircular EconomyHealth & SafetyEnvironment & NatureAlternative fuelsBlended cementsNew carbon capturetechnologySocial ResponsibilityConcreteCO2 emissions reductions are comparedto our 2005 baseline for 2020 target andto our 2018 baseline for 2030 targetTriple Bottom Line - Growth & ProfitabilityStrategy & Execution30
SUPPORTED BY SUSTAINABILITY INITIATIVES RESULTING INDIRECT ECONOMIC AND ENVIRONMENTAL BENEFITSALTERNATIVE FUELS (AF) USAGE ANDCO2 EMISSIONS REDUCTION1AF USAGE BY 0.9%9.1%9.1%11.5%Samalayuca2017% AF/thermal energy2018201921%18% 16%11% 11%Chihuahua2018201638%Juarez2019Pueblo20202020AF PROVIDE SIGNIFICANT COST ADVANTAGESCO2 emissions reductionALTERNATIVE FUELS USAGE (MT)In 2020, AF provided 11.5% of total thermal energy and reducedCO2 emissions by 10%In 2018, GCC saved more than US 4 million using AFOn average, AF costs are 50% lower than coal costs81k65k78k78k50kIn 2019, GCC received permit to co-process AF at Rapid CityIn 2018, GCC expanded the Pueblo plant s AF capabilityIn 2017, GCC secured a flexible fuel-permit for Odessa2015120162005 is the baseline year for CO2 emissions reduction201720182019Tijeras fuel permit is in the final stages31
GCC joined the Science Based Targets initiative to reduce CO2 emissionsThree long-term agreements were signed with renewable energy suppliers covering approximately20%, 100% and 50% of the electricity consumed at Mexico’s operations, Odessa plant and Rapid Cityplant, respectivelyLATEST ESGACHIEVEMENTSGCC joined GCCA’s research network, InnovandiUse of biomass fuel at the Juarez plant reduced CO2 emissions by 38%Rapid City has permanently shut down two wet kilnsTwo U.S. cement plants earned EPA Energy Star certificationPueblo plant earned the Energy Star certification for second year in a rowRapid City plant earned the Energy Star certificationPueblo Plant won the PCA’s Chairman’s Safety Performance AwardPCA recognized Odessa plant for outstanding environmental effortsZero fatalities11% reduction in lost time incident frequency and 31% reduction in severity rate (2020)GCC Foundation focuses on sustainable living projects throughout ChihuahuaMexico Great Place to Work ranking increased to 14th from 30thU.S. Division was certified as a Great Place to Work 16th consecutive year awarded Mexican Center for Philanthropy32
EXPERIENCED MANAGEMENT TEAM, WITH SOUNDCORPORATE GOVERNANCE49.1%50.9%ENRIQUE ESCALANTE, CEOGCC since 1999; 21 years in the industryFree floatCAMCEMLUIS CARLOS ARIAS, CFO100%GCC since 1996; 25 years in the industryChihuahuaInvestors60% CEMEX40%RON HENLEY, U.S. DIVISION PRESIDENTGCC since 2012; 35 years in the industryBOARD OFDIRECTORSProprietary, Chihuahua investors6Proprietary, Cemex 4Independent 4MARCOS RAMÍREZ, MEXICO DIVISION PRESIDENTGCC since 1990; 30 years in the industryGCC’s senior management team averages 28 years cement industry experienceNote that GCC currently has an ownership threshold of 3% or more of GCC’s totaloutstanding shares; a position greater than 3% requires prior autorization by GCC’s BoardAll 3 committee members are independentAUDIT ANDCORPORATEPRACTICESCOMMITTEEAssists the Board in carrying out its oversight duties andconducting corporate practices in accordance with theMexican Securities Market LawMonitors compliance with internal policies and applicablelaws and regulations regarding related party transactionsand significant transactions33
COMPENSATION PLANGOAL: CLOSELY ALIGN PAY WITH PERFORMANCE AND VALUE CREATIONOVER THE SHORT AND LONG-TERMFIXED PAYVARIABLE PAYBASE SALARYANNUAL INCENTIVESmallest component of target TDCBased on EBITDA:CEO: 31%Budgeted growthKey executives: 40% - 62%EBITDA marginTOTAL DIRECTCOMPENSATION(TDC)Pays out between 0% and 205% of targetCEO: 33%Key executives: 18% - 28%LONG-TERM INCENTIVELargest component of target TDCRestricted stockBased on ROIC5 year vesting period69% PERFORMANCE BASEDCEO: 36%Key executives: 15% - 34%34
WITH A DISCIPLINED APPROACH TO ACQUISITIONAND GROWTH INVESTMENTSFRAMEWORKSTRATEGIC PRIORIZATION AND EVALUATION OF ALTERNATIVESSeek outIncrease market share1Increase presence in existing marketsVertical integrationValue-added productsEfficient investment strategy2Increase productivityCement opportunitiesExpand and scale capacityin a disciplined mannerOdessaCaseby caseAggregatesopportunities withvertical integrationRapidCityTridentTXAggr.Improve distribution network utilization34Enter new marketsValue accretive M&AContinue successful U.S. expansionDistractsfrom coreFocus on synergistic contiguous marketsAnalyze opportunities that generateshareholder valueTX/NMR.M.Ready-mixopportunities withvertical integrationStandalone aggregatesand ready-mixOK/ARR.M.soldApply successful experience in integratingacquisitions to add synergiesAttractiveness-(ROI, size, affordability) 35
REINFORCING A POSITIVE 2021 OUTLOOKCONSOLIDATEDUNITED STATESVolumesEBITDA growthCement4% - 6%Concrete(15%) - (20%)FCF Conversion RateTotal CAPEXPricesCement6% - 7%Concrete4% - 5% 60%US 75 millionMaintenanceUS 65 million2020 carry-overUS 10 millionNet Debt / EBITDA, year-endMEXICO8% - 13%NegativeVolumesCement4% - 6%Concrete10% - 15%PricesCementConcrete2% - 3%36
Enrique Escalante, GCC’s Chief Executive Officer, commented: “GCC is off to an excellent first half ofthe year, we are very pleased with the results delivered - increasing top and bottom-line growth andENRIQUEESCALANTECEO Q2 2021 QUOTEEBITDA margin.”“We are revising upwards our full-year guidance, based on the strong first half performance. It reflectsthat positive momentum persists in our industry. Cement demand is stronger than pre-pandemic levels,and construction activity is expected to remain robust throughout the year. Every kiln at GCC is up andrunning.”Mr. Escalante continued, “Our balance sheet is strong and ready for growth. We will allocate moreresources to our core business – cement – and our distribution network to maintain our competitiveadvantage while we focus on our sustainability strategy and CO2 reduction targets.”37
05APPENDIX
Q2 2021 RESULTSFREE CASH FLOW (US MILLION)1EBITDA & EBITDA MARGIN (US MILLION)SALES (US MILLION)46533.7%33.8%30.0%31.5%42456147127287243 9.7%359782 18.1%Q2-20 27.8% 15.3% 18.0% OtherAggregates 2% 6%U.S.73%H1-20H1-21NET INCOME (US MILLION)SALES MIXNET SALES BY COUNTRYMexico27%444163Coal 3%48Ready-mixconcrete19%5033Cementand mortar70% 27.0% 43.8%Q2-20Q2-21H1-20H1-2139
Q2 2021 RESULTS HIGHLIGHTSMillions of dollarsQ2-21Q2-20VarH1-21H1-20VarNet sales286.7242.818.1%465.5424.29.7%Operating Income before other 49.6EBITDA MarginConsolidated Net IncomeMexico cement and ready-mix volumes increased 17.1% and 41.4%, respectively43.8%27.0%Free cash flow increased 18% to US 41.4 million with a 42.7% conversionrate from EBITDATotal U.S. cement volumes grew 10.6% and rose 4% excluding oil well cementNet leverage (net debt/EBITDA) ratio dropped to 0.06x as of June 2021U.S. cement and ready-mix prices increased 8.3% and 6%Consolidated net sales increased 18.1%, to US 286.7 millionEarnings per share increased 43.7% year on year, to US 0.1439 Mexicocement and ready-mix volumes increased 6% and 8%, respectivelyEBITDA increased 18.6% to US 97 million, with a 33.8% EBITDA margin40
SALES VOLUMES AND PRICESQ2-21 vs Q2-20H1-21 vs H1-20The U.S. market remains very strong, with a solid demand from El Paso, Texas, all the wayto the Canadian borderU.S.10.6%3.2%Mexico17.1%11.5%The most dynamic U.S. market segments during the quarter were housing, infrastructureand industrial warehouse constructionCement salesThe state of Chihuahua continues a V-shaped recoveryConcrete salesU.S.-17.0%-21.1%Mexico41.4%22.8%Mexico sales during the quarter were primarily driven by demand related to industrialmaquiladora plants, warehouse construction, mining projects and middle-income housingGCC AVERAGE SELLING PRICES, % CHANGEMEXICO (PESOS)UNITED STATES (U.S. DOLLARS)8.3%7.2%6.0%6.3%Cement (per mton)6.2%5.0%Concrete (per m3)0.2%-0.2%Q2-21 vs Q2-20H1-21 vs H1-20Q2-21 vs Q2-20H1-21 vs H1-2041Percentage changes are based on actual results, before rounding
SALESMillion 5.5424.29.7%U.
CORPORATE PRESENTATION Q2 2021. This presentation has been prepared by GCC, S.A.B. de C.V. (together with its subsidiaries, "GCC"). Nothing in this presentation is intended to be taken by any person as investment advice, a recommendation to buy,