Transcription
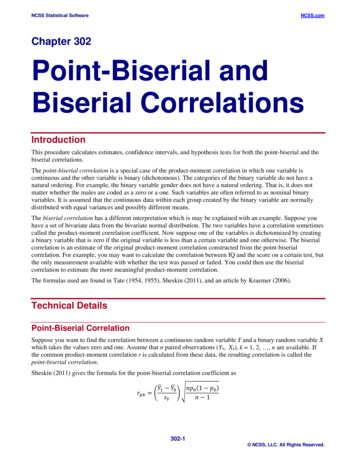
NCSS Statistical SoftwareNCSS.comChapter 302Point-Biserial andBiserial CorrelationsIntroductionThis procedure calculates estimates, confidence intervals, and hypothesis tests for both the point-biserial and thebiserial correlations.The point-biserial correlation is a special case of the product-moment correlation in which one variable iscontinuous and the other variable is binary (dichotomous). The categories of the binary variable do not have anatural ordering. For example, the binary variable gender does not have a natural ordering. That is, it does notmatter whether the males are coded as a zero or a one. Such variables are often referred to as nominal binaryvariables. It is assumed that the continuous data within each group created by the binary variable are normallydistributed with equal variances and possibly different means.The biserial correlation has a different interpretation which is may be explained with an example. Suppose youhave a set of bivariate data from the bivariate normal distribution. The two variables have a correlation sometimescalled the product-moment correlation coefficient. Now suppose one of the variables is dichotomized by creatinga binary variable that is zero if the original variable is less than a certain variable and one otherwise. The biserialcorrelation is an estimate of the original product-moment correlation constructed from the point-biserialcorrelation. For example, you may want to calculate the correlation between IQ and the score on a certain test, butthe only measurement available with whether the test was passed or failed. You could then use the biserialcorrelation to estimate the more meaningful product-moment correlation.The formulas used are found in Tate (1954, 1955), Sheskin (2011), and an article by Kraemer (2006).Technical DetailsPoint-Biserial CorrelationSuppose you want to find the correlation between a continuous random variable Y and a binary random variable Xwhich takes the values zero and one. Assume that n paired observations (Yk, Xk), k 1, 2, , n are available. Ifthe common product-moment correlation r is calculated from these data, the resulting correlation is called thepoint-biserial correlation.Sheskin (2011) gives the formula for the point-biserial correlation coefficient as𝑟𝑟𝑝𝑝𝑝𝑝 𝑛𝑛𝑝𝑝0 (1 𝑝𝑝0 )𝑌𝑌 1 𝑌𝑌 0 𝑛𝑛 1𝑠𝑠𝑌𝑌302-1 NCSS, LLC. All Rights Reserved.
NCSS Statistical SoftwareNCSS.comPoint-Biserial and Biserial Correlationswhere𝑠𝑠𝑌𝑌 𝑌𝑌 𝑛𝑛 𝑘𝑘 1(𝑌𝑌𝑘𝑘 𝑌𝑌 )2 𝑛𝑛𝑘𝑘 1 𝑌𝑌𝑘𝑘𝑝𝑝1 𝑛𝑛𝑛𝑛 1 𝑛𝑛𝑘𝑘 1 𝑋𝑋𝑘𝑘𝑛𝑛𝑝𝑝0 1 𝑝𝑝1Tate (1954) shows that, for large samples, the distribution of rpb is normal with mean ρ and variance𝜎𝜎𝑟𝑟2 (1 𝜌𝜌2 )21 6𝑝𝑝0 (1 𝑝𝑝0 ) 1 𝜌𝜌2 4𝑝𝑝0 (1 𝑝𝑝0 )𝑛𝑛This population variance can be estimated by substituting the sample value rpb for ρ. An approximate confidenceinterval based on the normal distribution can be calculated from these quantities using22 1 𝑟𝑟𝑝𝑝𝑝𝑝 1 6𝑝𝑝0 (1 𝑝𝑝0 )2 1 𝑟𝑟𝑝𝑝𝑝𝑝𝑟𝑟𝑝𝑝𝑝𝑝 𝑧𝑧𝛼𝛼/2 4𝑝𝑝0 (1 𝑝𝑝0 )𝑛𝑛The hypothesis that ρ 0 can be tested using the following test which is equivalent to the two-sample t-test.𝑟𝑟𝑝𝑝𝑝𝑝 𝑛𝑛 2𝑡𝑡𝑝𝑝𝑝𝑝 2 1 𝑟𝑟𝑝𝑝𝑝𝑝This test statistic follows Student’s t distribution with n – 2 degrees of freedom.Biserial CorrelationSuppose you want to find the correlation between a pair of bivariate normal random variables when one has beendichotomized. Sheskin (2011) states that the biserial correlation can be calculated from the point-biserialcorrelation rpb using the formula𝑟𝑟𝑝𝑝𝑝𝑝𝑟𝑟𝑏𝑏 𝑝𝑝0 (1 𝑝𝑝0 )ℎwhereℎ 𝑒𝑒 𝑢𝑢2 /2 2𝜋𝜋𝑃𝑃𝑃𝑃[𝑍𝑍 𝑢𝑢 𝑍𝑍 𝑁𝑁(0,1)] 𝑝𝑝1Kraemer (2006) gives a method for constructing a large sample confidence interval for ρb which is described asfollows. Let g(x) be Fisher’s z-transformationthen11 𝑥𝑥𝑔𝑔(𝑥𝑥) ln 21 𝑥𝑥𝑔𝑔 2𝑟𝑟𝑏𝑏 5 𝑁𝑁 𝑔𝑔 2𝜌𝜌𝑏𝑏 5 ,5 4𝑛𝑛302-2 NCSS, LLC. All Rights Reserved.
NCSS Statistical SoftwareNCSS.comPoint-Biserial and Biserial CorrelationsIt follows that a (1-α)% confidence interval for g, denote G1 and G2, can be calculated usingand𝐺𝐺1 𝑔𝑔 2𝑟𝑟𝑏𝑏𝐺𝐺2 𝑔𝑔 5 𝑧𝑧𝛼𝛼/2 4𝑛𝑛 52𝑟𝑟𝑏𝑏5 𝑧𝑧𝛼𝛼/2 4𝑛𝑛 5These limits can then be inverted to obtain corresponding confidence limits for ρb. The result is 5 e2𝐺𝐺1 1𝐶𝐶𝐿𝐿1 2 e2𝐺𝐺1 1𝐶𝐶𝐶𝐶2 5 e2𝐺𝐺2 1 2 e2𝐺𝐺2 1A large sample z-test of ρb 0 based on g(x) can be constructed as follows2𝑟𝑟𝑏𝑏 5𝑧𝑧 54𝑛𝑛𝑔𝑔 302-3 NCSS, LLC. All Rights Reserved.
NCSS Statistical SoftwareNCSS.comPoint-Biserial and Biserial CorrelationsExample 1 – Correlating Test Result with IQThis example correlates the IQ scores of 100 subjects with their result on a pass-fail test. The researcher willquantify the correlation using the point-biserial correlation coefficient. These data are contained on the IQ Testdataset.SetupTo run this example, complete the following steps:1Open the IQTest example dataset From the File menu of the NCSS Data window, select Open Example Data. 2Select IQTest and click OK.Specify the Point-Biserial and Biserial Correlations procedure options Find and open the Point-Biserial and Biserial Correlations procedure using the menus or the ProcedureNavigator. The settings for this example are listed below and are stored in the Example 1 settings template. To loadthis template, click Open Example Template in the Help Center or File menu.OptionValueVariables TabInput Type . One or More Continuous Variables and a Binary VariableContinuous Variable(s) . IQBinary Variable . Test3Run the procedure Click the Run button to perform the calculations and generate the output.Point-Biserial and Biserial CorrelationsPoint-Biserial and Biserial Correlations Continuous Variable IQ, Binary Variable 9Lower95.0%C.L.of ρ0.66900.8421Upper95.0%C.L.of ρ0.81810.9943StdDevof 00Testforρ 011.00810.729ProbLevel0.00000.0000This report shows the point-biserial correlation and associated confidence interval and hypothesis test on the firstrow. It shows the biserial correlation and associated confidence interval and hypothesis test on the second row.TypeThe type of correlation coefficient shown on this row. Note that, although the names point-biserial and biserialsound similar, these are two different correlations that come from different models.CorrelationThe computed values of the point-biserial correlation and biserial correlation. Note that since the assignment ofthe zero and one to the two binary variable categories is arbitrary, the sign of the point-biserial correlation can beignored. This is not true of the biserial correlation.302-4 NCSS, LLC. All Rights Reserved.
NCSS Statistical SoftwareNCSS.comPoint-Biserial and Biserial CorrelationsLower and Upper 95% C.L. of ρThese are the lower and upper limits of a two-sided, 95% confidence interval for the corresponding correlation.Std Dev of ρThis is the standard deviation of the estimate of the point-biserial correlation. This value is not available for thebiserial correlation.r2This is the r-squared value for the correlation presented on this row. R-squared is a measure of the strength of therelationship.Count NThis is the total sample size.N0/N PThis is the proportion of the sample that is in the group defined by the binary variable being 0. It is the value of p0in the formulas presented earlier in the chapter.Test for ρ 0This is value of the test statistic used to test the hypothesis that the correlation is zero. For the point-biserialcorrelation, this is the value of the t-test with N – 2 degrees of freedom. It is identical to the two-sample t-test fortesting whether the means are different.For the biserial correlation, this is the value of the z-test which is based on the standard normal distribution.Prob LevelThis is the p-value of the hypothesis test mentioned above. If it is less than 0.05 (or whatever value you choose),then the test is ‘significant’ and the null hypothesis that the correlation is zero is rejected.Means, Standard Deviations, and Confidence Intervals of MeansMeans, Standard Deviations, and Confidence Intervals of Means Continuous Variable IQ, Binary Variable TestNameTest 0Test 674.987433Lower95.0% C.L.98.7543109.8743104.25769.000521Upper95.0% C.L.101.7257112.5657107.202412.95948This report shows the descriptive statistics of the two individual groups, the combination of both groups, and thedifference between the two groups.302-5 NCSS, LLC. All Rights Reserved.
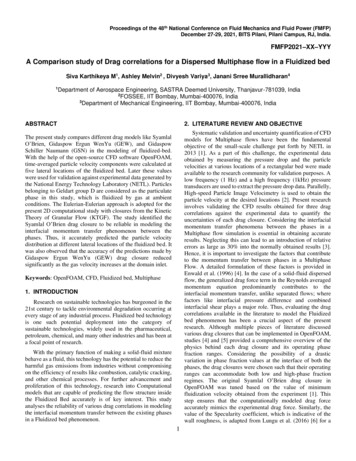
NCSS Statistical SoftwareNCSS.comPoint-Biserial and Biserial CorrelationsTests of Normality and Equal VarianceTests of the Normality and Equal Variance Assumptions Continuous Variable IQ, Binary Variable TestAssumptionNormality of Test 0Normality of Test 1Equal 0.6710Conclusion(α 0.050)Cannot reject normalityCannot reject normalityCannot reject equal variancesThis report presents the results of the Shapiro-Wilk normality test of each group as well as the Brown-ForsytheEqual Variance test (sometimes called the Modified-Levene test).Note that the point-biserial correlation demands that the variances are equal but is robust to mild non-normality.On the other hand, the biserial correlation is robust to unequal variances, but demands that the data are normal.This report presents the usual descriptive statistics.This report displays a brief summary of a linear regression of Y on X.Plots to Evaluate CorrelationPlots to Evaluate Correlation These plots let you investigate the relationship between the two variables more closely. The box plot is especiallyuseful for comparing the variances of the two groups.302-6 NCSS, LLC. All Rights Reserved.
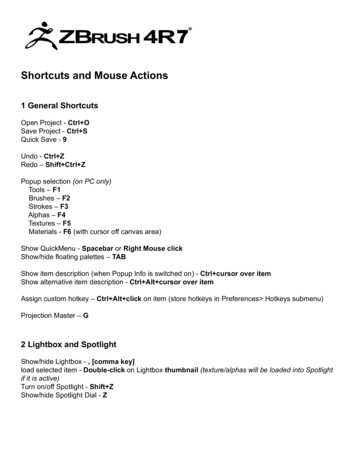
NCSS Statistical SoftwareNCSS.comPoint-Biserial and Biserial CorrelationsPlots to Evaluate NormalityPlots to Evaluate NormalityThe histograms and normal probability plots help you assess the viability of the assumption of normality withineach group.302-7 NCSS, LLC. All Rights Reserved.
The point-biserial correlation is a special case of the product -moment correlation in which one variable is continuous and the other variable is binary (dichotomous). The categories of the binary variable do not have a natural ordering. For example, the binary variable gender does not have a natural ordering.