Transcription
The Mobile InternetPhenomena ReportMay 2021 ENTER
The Mobile InternetWelcomePhenomena ReportMay 2021About SandvineSandvine’s market leading Service Innovation and Intelligence portfolio helps customers deliverexceptional digital experiences and grow revenues. Our ability to classify over 95% of network trafficacross mobile and fixed networks by user, application, device, location, and other parameters createsuniquely rich, real-time network and service data. We then apply machine learning-based contextualinsights to improve performance and enhance digital services.Our real-time data and extensive global deployments with over 160 global service providers covering 2.5billion users have made us a global authority on evolving internet phenomena.We are committed to delivering the preeminent view of global trends and distilled insights into the internetapplication ecosystem. As our global reach continues to expand across fixed, mobile, cable, satellite, andWiFi networks, we will bring you viewpoints on these trends and special topics through our report series.Our goal with this report is to inform our customers and the global community on the mobile ‘internetphenomena’ we live through every day, and to expose both challenges and opportunities to build a morecollaborative ecosystem, providing a robust connected experience for users.The internet and keyapplications keepeveryone connected inchallenging timesData LexiconThe COVID-19 pandemic is continuingto accelerate mobile traffic growth andprofoundly change how we engage,communicate, interact, and transact in ourdaily lives.% Downstream: Percent of application traffictaken from all downstream traffic on the datasample.% Upstream: Percent of application traffictaken from all upstream traffic on the datasample.Sandvine is privileged to work with networkoperators to help deliver a better experienceand ultimately connectivity to many internetusers.About The Mobile Internet Phenomena DataNever before have consumers, enterprisesand network operators given network qualityas much attention as they are now.This edition is solely focused on mobile data in orderto provide a targeted model that mobile operatorscan draw from to begin their planning process.The Mobile Internet Phenomena Report ranksapplications based on their “traffic share.” Thefascinating data that fuels the report illustrates thedisconnect between “market share” for companiesdefined by subscriber counts and how oftensubscribers use a service.Upstream: Traffic volume uploaded to theinternet. Examples would be requests forcontent, interactive messaging sessions, orstreams of a gaming session from a console.New 5G and cloud technologies will bepivotal for mobile operators to capturethe opportunities presented by thesetransformative changes.We hope you enjoy the report. If you have feedback or suggestions on how we can make this report better,contact us at phenomena@sandvine.com. If you’re an OTT content provider and have an application youwant covered in the phenomena report, click here.The data in this edition of The Mobile InternetPhenomena Report is drawn from Sandvine’sinstalled base of mobile operators worldwide.The report does not include significant data fromeither China or India, but the data represents aportion of Sandvine’s installed base, a statisticallysignificant segment of the internet population.Downstream: Traffic volume downloadedfrom the internet. Examples would be a videostream, a file download, or an app downloadfrom iTunes.It is now clear that network users are able todo more than ever while on the move. Thisedition of the report covers global views ofthe composition of traffic on the internet.Connections: Represents the number of“conversations” occurring for an application.Some applications use a single connectionfor all traffic, others use many connections totransfer data or video to the end user.Download previous InternetPhenomena ReportsSee what trends and data shaped global and mobileinternet usage in the recent past. Click here to visitSandvine’s Internet Phenomena Report library anddownload previous Internet Phenomena Reports.Traffic share is defined as the percentage of networkresources used by a specific application relative toother applications. PREVIOUSSTARTNEXT Copyright 2021 Sandvine. All rights reserved. All other trademarks are property of their respective owners.2
The Mobile InternetSection OverviewSection 1: Global News4EXECUTIVE OVERVIEWA brief overview of the key findings in this issue of The MobileInternet Phenomena Report.5MOBILE APPLICATION CATEGORY TRAFFIC SHAREWhat application categories are the leading consumers ofinternet bandwidth? The real question is, how much traffic on theinternet is video?6MOBILE TRENDS: GLOBAL TOP MOVERSWho are the biggest movers beyond the top 10? With visibilityto over 5000 applications, we take a look at how the new normal onthe network is shaking up which application usage.Phenomena ReportMay 2021Section 2: Phenomena Spotlights7VIDEO-FIRST ECONOMYWhat is a video-first economy? Take a deeper dive into what services have changed in the past year andhow to engineer the network of the future. With the transition to work-from-home, how have mobile networksbeen affected?812DAY IN THE LIFE OF A MOBILE NETWORKMobile operators are focused on providing differentiatedexperiences. How do operators ensure quality of experience (QoE) intoday’s changing applications landscape?VIDEO SPOTLIGHTAs short-form video takes over, video quality and constant connectivity are key. Video is now over 48%of all traffic happening on a network, so understanding hourly trends matters to ensure network subscribershave a great experience. Take a deep dive and understand how YouTube, on a regular day, compares to overallvideo trends on a mobile network.9Section 3: Looking Forward175G INNOVATEThe era of 5G and the Internet of Things (IoT) is upon us.The time to act is now to ensure that service innovation andintelligence at the core of 5G business decisions.SOCIAL SPOTLIGHTSocial usage overall has grown in 2021 and has become more critical, with people looking to stayconnected together more than ever during the stay-at-home orders. Take a look at the top five ‘social’ servicesand how social is being experienced on a mobile network.10TIKTOK VS SNAPCHATWith TikTok becoming a behemoth in the social sharing and entertainment category, how do TikTok andSnachap stack up?11MESSAGING SPOTLIGHTTake a look at the top five messaging services and the transformations within messaging with a spotlighton Zoom. PREVIOUSSTARTNEXT Copyright 2021 Sandvine. All rights reserved. All other trademarks are property of their respective owners.3
The Mobile InternetExecutive Global OverviewVideo Streaming, Social Networkingand Web Browsing continue to bethe categories driving growthThe interactive network is driven by applicationsthat help keep us, our businesses, and our familiesconnected. Video Streaming, Web, and Social arethe three top categories. These categories includethe most ‘QoE-sensitive’ applications with whichconsumers often have poor experiences – whetherit is a web page not loading or a video stalling.GLOBAL APPLICATION CATEGORY TRAFFIC SHARERank ChangeCategoryDownstreamUpstream1-Video Streaming48.9%19.4%2-Social %20.4%5-Gaming4.3%1.9%6-2Marketplace4.1%1.2%72File Sharing1.3%6.6%8-1Cloud1.1%6.7%9-3VPN and Security0.9%3.9%10-Audio0.2%0.2%Phenomena ReportMay 2021Category highlightsVideo Streaming:Consumer mobile networks have become morecritical to our personal and professional relationships.Relationships are now being built and nurturedonline, predominately through video. It is thereforeno surprise that Video Streaming continues to takethe top traffic spot. YouTube and TikTok reign thiscategory with tremendous growth in the past year.Their easy to watch, ever-changing new contentcontinue to capture the imagination.What is surprising is the shift in the ranking ofapplications within this category. Read more in thevideo spotlight.Social Sharing:Social Sharing has been slowly evolving from a staticto a dynamic medium. Now more than ever, dynamiccontent such as reels, video snaps, and stories arehelping people feel connected when being togetherjust isn’t possible. The increased reliance on socialsharing to build and maintain connections has madea high quality of experience critical in this category.5G ExperienceExpectationsMessaging:Out with the old, in with the new. Gone are the daysof SMS texting as messaging applications and videobased messaging become prevalent. Especially onthe upstream, we are seeing messaging applicationsbecome a critical part of the mobile experience.Memes, voice messages, and reactions are enrichingthe content we share via messaging. Learn more inthe messaging spotlight.The improved performance of 4G and the comingpromise of 5G will continue to drive consumers toadopt new technology to have the best experience.Unlike best-effort 4G networks, 5G allows serviceproviders to design network slices aroundapplications to deliver a unique enterprise andconsumer experience.Video chattingis now done onthe moveThis introduces new challenges for networksworldwide. TikTok, Zoom, Skype, Snapchat,FaceTime, and even Facebook Live were all in thetop 50 upstream applications as part of the newvideo-first economy. The use of social applicationson mobile networks is matching typical work andschool hours again as stay-at-home orders are lifted.Learn more in the social spotlight. PREVIOUSSTARTNEXT Copyright 2021 Sandvine. All rights reserved. All other trademarks are property of their respective owners.4
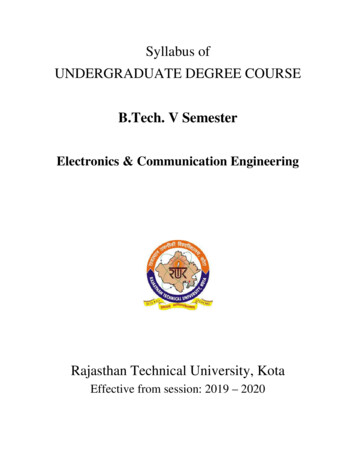
The Mobile InternetGlobal Mobile Application Traffic SharePhenomena ReportMay 2021What are the top 10 applications onmobile networks?It is no surprise that YouTube remains on the throne with its short-form videos dominating mobilenetworks. YouTube, Facebook Video, and TikTok lead the way, driven by consumers who are lesslikely to purchase a cable subscription or pay for over-the-top services.Fresh and new content, from current events and new recipes to fitness programs, are valued at a premium.YouTube remains the clear leader in this category.Rank 2-Facebook ing downYouTube: YouTube maintains the number oneposition on mobile networks despite the continuedrise of WiFi usage and alternative social networkvideo sources.Instagram: Instagram continues to grow inimportance in the social landscape, with videobeing a central part of the value offering for users,influencers, and advertisers. However, while its totalusage has increased, Instagram’s overall traffic sharehas fallen as WhatsApp and TikTok take over.Facebook Video: Facebook Video meets theconsumer demand for short-form video as well asserving as a way to keep us connected.GLOBAL APPLICATION TRAFFIC SHARE5Holding le Play1.6%0.4%Facebook: Facebook continues to be the ‘go-to’daily social network for billions of people. It hasbecome a powerful targeted advertising machineand marketplace.Netflix: Netflix is decreasing in popularity onmobile networks. Users have increasingly movedto fixed networks to stream their favorite shows asthey spend more time in their homes working andlearning remotely.Moving upWhatsApp: WhatsApp continues to be the leadingmobile messaging platform worldwide. The fourthFacebook property in the top 10, it has replacedtext messaging for over 1.5B users a month and isstrong in every region of the world.TikTok: TikTok shows the largest rank change amongthe top 10, moving up the charts and continuingstrong growth and engagement during 2020. TikTokbeat records for app downloads. In the first quarterof 2020, the platform generated the most downloadsfor any app ever with more than 315 million installsglobally across iTunes and Google Play. PREVIOUSSTARTNEXT Copyright 2021 Sandvine. All rights reserved. All other trademarks are property of their respective owners.5
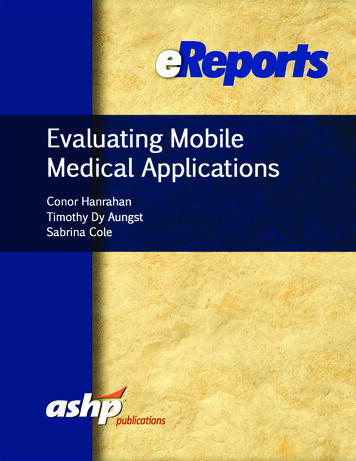
The Mobile InternetGlobal Top MoversZoomGlobal Ranking 41( 10)Phenomena ReportMay 2021Microsoft TeamsGlobal Ranking 49( 20)Enterprises are relying heavily on applications that connect theirworkforces. Business-grade QoE is now critical to keep workersconnected and able to conduct business on the go. The surgein taking meetings while walking is driving a rise in the use ofbusiness communication applications on mobile networks.BoxGlobal Ranking 328 ( 82)DiscordGlobal Ranking 19 ( 42)Box, a content management andfile sharing service for large enterprisebusinesses, has shown notablegrowth over the last year. Asbusinesses move to the cloud,this is an application to watch.Discord has been growing explosivelywith over 14 million active daily users.By partnering with Fortnite and Twitch,Discord is shaping up to be a placewhere hanging out is easy and fun.TikTok Global Ranking 3 ( 7)Snapchat Global Ranking 36 ( 5)TikTok is now a giant compared to Snapchat. PREVIOUSSTARTNEXT Copyright 2021 Sandvine. All rights reserved. All other trademarks are property of their respective owners.6
The Mobile InternetGlobal Video-First Economy in 2021What is a videofirst economy?Network operators need to understand thevideo-first economy to meet the needs ofconsumer and enterprises networks.As enterprises go digital, they are increasinglydelivering services over video rather than in-person.Remote workers are also using video as theirprimary way of communicating with customers,partners, and peers. Large companies such asMicrosoft are making work-from-home permanent.This will have a lasting effect on internet traffic.Phenomena ReportMay 2021Looking forward – what does thismean for the mobile network?WhatsApp Global Ranking 8Line Global Ranking 28Zoom Global Ranking 41MS Teams Global Ranking 49Skype Global Ranking 54Looking back at 2020 fixed networksThe Mobile Internet Phenomena COVID-19 Spotlight Report issued in May 2020 highlighted the videofirst economy phenomena. Upstream video traffic surged 135% while downstream traffic grew 68%.Overall Work-From-HomeApplication Traffic GrowthDownstream GrowthUpstream GrowthVirtual SchoolingGoogle Classroom Downstream Traffic204% growthGoogle Classroom Upstream Traffic161% growth68%135%Video Conferencingand TelemedicineOnline GamingTwitch Downstream Traffic178% growthTwitch Upstream Traffic238% growthVideo StreamingOverall Downstream Traffic 66% growthOverall Upstream Traffic 67% growthOverall Downstream Traffic 390% growthOverall Upstream Traffic 233% growthZoom Downstream Traffic 1940% growthZoom Upstream Traffic 1700% growthConnected video is keeping schools, healthcare,and businesses functioning by providing criticallinks among teachers, students, patients, andemployees alike.What applications define a video-first economy? Video conferencing Online learning, with connected video Remote work productivity tools, with enriched communicationRemote medical consultationsHow have mobile networks been affected bythe transition to work-from-home? Businessvideo conferencing, on-line learning, and remoteproductivity tools are becoming more prevalenton mobile networks. These applications requirea consistent upstream and downstream networkconnection.As these video-first economy applications becomemore popular on mobile networks, mobile operatorsneed to understand not just what applications aredominating, but also the experience consumershave with them. They also need to look to 5G FixedWireless Access as a significant opportunity to meethome network demands.As regions re-open their economies, some morningand evening commuting will resume as consumersreturning to their typical lifestyles. At the same time,several consumers will continue working and learningremotely on a more permanent basis. For this reason,business and learning applications will continue tograb a larger share of traffic on mobile networksthroughout the day. PREVIOUSSTARTNEXT Fixed network growth has beendominated by a video-first economywith massive growth over the firstpart of 2020. This represents asignificant opportunity for future 5Gfixed wireless acess networks.Copyright 2021 Sandvine. All rights reserved. All other trademarks are property of their respective owners.7
The Mobile InternetGlobal Video SpotlightPhenomena ReportMay 2021Short-form video content at yourfingertips is dominating the internetVideo is now 48% of all traffic on mobilenetworks as short-form video grows inpopularity.The top three has a newcomer now that TikTokhas climbed the charts and joined YouTube andFacebook. TikTok has grown dramatically during2020, as people unleashed their creativity in theapplication. Many videos went viral, making headlinesworldwide. Now that video is almost 50% of all traffic,network operators need to keep a close eye on thelatest trends. As live sports and new entertainmentcontent make a come back, video QoE is top of mind,especially during evening peak hours.Hourly video trendson mobile networksVideo streaming has multiple peaks throughout theday, with the highest peak between 5-6pm.0YouTube trendson mobile networksYouTube follows a similar trend as video streamingoverall, with some key differences. Since itencompasses short-form and long-form content,peaks form at the start of the day and when the workand learning day is finished.GLOBAL VIDEO TRAFFIC %TikTok16.1%7.8%3Facebook %12Mobile12345678910 11 12 13 14 15 16 17 18 19 20 21 22 23345678910 11 12 13 14 15 16 17 18 19 20 21 22 23YouTube012Mobile VideoVideo streaming aligns with the natural movementsof consumers throughout the day with peaksbefore work, mid-day, and especially during thelate afternoon commute. Mobile operators need tounderstand how these peaks are affecting video PREVIOUSSTARTNEXT performance to best optimize their networks forvideo content during peak usage. Without videostreaming optimization, users will experience lagsor buffer stalls.Optimizing applications in a mobile network iscritical, since every network is unique and thetrends vary by location.Copyright 2021 Sandvine. All rights reserved. All other trademarks are property of their respective owners.8
The Mobile InternetGlobal Social SpotlightPhenomena ReportMay 2021Social applications are keeping usconnected more than ever beforeSocial usage overall has grown in 2021 andbecome more critical – with people looking tostay on-line more than ever during the stay-athome orders.Facebook continues to be the main way the worldkeeps connected. Social networks have fallen intoa demographic cycle where Facebook is catering toa more mature audience, Instagram appeals to themillennials, and Twitter is all the rage for Gen Z.Instagram, Facebook’s sibling, is #2 worldwide and isbecoming the marketing channel of choice for brandsgoing after younger audiences, who only want to seerelevant ads.Hourly socialtrends on mobileInternational social networks such as Odnoklassnikiand QQ, also dominate mobile networks and are inthe top five by traffic volume. This is a reminder thatlocal social networks have gained in popularity.Social usage peaks after 3pm – 5pm on a mobilenetwork as consumers switch to off mode and catchup with friends and family.012345678910 11 12 13 14 15 16 17 18 19 20 21 22 23Mobile socialGLOBAL SOCIAL TRAFFIC klassniki1.9%0.4%5QQ0.7%0.3%Social application usage on a mobile network peaksfrom 3pm – 6pm as consumers move from a typicalwork or school day to catching up or chatting withfriends and family. Interestingly, in comparisonto fixed networks where consumers often leaveapplications running in the background, users willHourly socialtrends on fixedSTARTUnderstanding these trends is key to providinga high quality of experience to consumers. Withenriched video options, memes, and the ability tosend video, these applications require operatorsto be very aware of the services customers areinterested in using and design the network to meetthese needs.FixedIn a typical fixed network, social usage is fairlyconsistent throughout the day as people are workingfrom home, while keeping several of their socialapplications going in the background. PREVIOUSclose and only intermittently interact with their socialapplications which causes dynamic usage.NEXT 012345678910 11 12 13 14 15 16 17 18 19 20 21 22 23Copyright 2021 Sandvine. All rights reserved. All other trademarks are property of their respective owners.9
The Mobile InternetTikTok and SnapchatTikTok isn’t just another fleeting trend – it’s hereto stay. For those unfamiliar with the platform,TikTok is often referred to as “snapchat reboot.”The two platforms share similar features.However, TikTok’s offering centers on videosharing of short clips set to music, whileSnapchat is a photo and video messagingapplication where users can post ‘stories.’Celebrities have been using TikTok creatively as ameans to keep in touch with their fans and this hascaused a massive surge in users and applicationusage. TikTok beat records for app downloads, somuch so that in the first quarter of 2020 the platformgenerated the most downloads for any app ever ina quarter with more than 315 million installs globallyacross the App Store and Google Play.Phenomena ReportMay 2021Snapchat punches above its weight with “only” 348M monthly users. However, those that do use itare rabid consumers and creators of content, with theapp being used frequently for text, voice, and videomessages both to individuals as well as groups.TikTok12345678910 11 12 13 14 15 16 17 18 19 20 21 22 23TikTok has peaks on usage at 1pm, 5pm, and at 7pm – as people consume short-form video.Snapchat012345678910 11 12 13 14 15 16 17 18 19 20 21 22 23Global Application Traffic Share Rank0135101520253035364045AugSeptOctSnapchat has peaks at 5pm, aligning to the younger demographic pattern that uses its services.NovDecTikTok PREVIOUSSTARTNEXT JanSnapchatCopyright 2021 Sandvine. All rights reserved. All other trademarks are property of their respective owners.10
The Mobile InternetGlobal Messaging SpotlightPhenomena ReportMay 2021Hourly messagingtrends on mobileMessaging applications peak at 5pm on a mobilenetwork as consumers switch to “off” mode and startcatching up with friends and family. This is similar tosocial applications.Keeping us connected with enrichedcontent – memes, voice, and reactions.WhatsApp continues to be the leading mobilemessaging platform worldwide. It has replacedtext messaging for over 1.5B users a month andis strong in every region of the world. Snapchat,Facebook, Line, and Skype come next in popularityas consumers switch between messaging platformsto stay connected with the world.Messaging applications are a critical part of themobile experience. Memes, voice messages, andreactions are continuing to enrich messaging content.GLOBAL MESSAGING TRAFFIC 0%2Snapchat16.5%2.7%3Facebook 12345678910 11 12 13 14 15 16 17 18 19 20 21 22 23Mobile messagingMessaging application usage peaks at 5pm asconsumers shift from a typical work or school dayto catching up and chatting with friends or family.These applications require constant connectivityZoom trendson mobilePeaks in Zoom on mobile networks also aligns withthe peak hours for meetings. These peaks in mobilenetworks could also be a result of a poor QoE onSTARTThe availability of video messaging and otherenriched options is driving consumers to use themobile network like never before.ZoomOn a typical mobile network, Zoom usage peaksmid-day as people take calls or join Zoom meetingswhile grabbing lunch or taking their daily walks. Theusage of zoom follows a typical workday with busyhour starting at 10am when the day gets underway,peaking at 3pm, and then again at 5pm as the workday ends. PREVIOUSand a high upstream quality of experience. In amobile network, as consumers move, hand-offsand congestion management are critical for thesetypes of sensitive applications.NEXT 012345678910 11 12 13 14 15 16 17 18 19 20 21 22 23fixed networks during peak times resulting in usersswitching to mobile networks to have a betterconnection. Another zoom peak occurs between7pm and 8pm in the evening where it is used forsocial and family events.Copyright 2021 Sandvine. All rights reserved. All other trademarks are property of their respective owners.11
The Mobile InternetA Day in the Life of a Mobile NetworkPhenomena ReportMay 2021Mobile network service intelligenceMobile networks that deliver a great experienceto their customers have the best customersatisfaction ratings, the least churn, and users areoften willing to pay a premium.How do mobile operators ensure a differentiated,high quality of experience in today’s ever changinglandscape of applications? Networks that deliver besteffort speeds and then advertise (without delivery) themaximum download speed is a scenario that is likelyto disappoint the user.Video: Video, especially short-form video likeYouTube, requires a good downstream throughputto generally deliver an acceptable experience. Keepthe buffers on the device full, and the user won’t seeany momentary network congestion or delay. Thisis particularly challenging to deal with during heavycongestion events. How can operators ensure that allsubscribers are happy with their video experience?Messaging: Messaging applications have createda rich user experience – with more VoIP, video, andchat possibilities than ever to keep in touch. Leadingthe consumer into the video-first economy, theseapplications are driving the upstream changes. Inparticular, these applications need connectivity andthroughput on the upstream to keep connected asevery packet delivered counts in making sure theconnection goes through.Sandvine Active Network Intelligence PortalMobile operators that understand services and howthey change over time will be able to deliver the bestservices to their customers. This understandingallows operators to: Know which applications matter to theirsubscribers and at what time of day Assure subscriber quality of experience Create and evolve innovative services that delighttheir subscribersSocial Sharing: Isn’t this just social networking?Actually no, because the big picture of socialnetworking includes much more than just Facebookand Instagram traffic now. All of those pictures andvideos are uploaded directly into a cloud (iCloud,Google Photo, Samsung Cloud, etc.), uploaded toone or many social networks, and then discussed(or shared again) over messaging networks. Theecosystem is no longer just browsing Facebook feedsand posting texts. It has become a rich upstreamtraffic mix that users are monetizing. As a result, usershave become more sensitive to bad QoE and they willchurn if their expectations are not met. PREVIOUSSTARTNEXT Copyright 2021 Sandvine. All rights reserved. All other trademarks are property of their respective owners.12
The Mobile InternetA Day in the Life of a Mobile NetworkPhenomena ReportMay 2021Applications are the heart of the mobile networkThe best way to truly understand applicationquality of experience is to take a deep dive into anaverage day in a mobile network and understandthe evolution of services throughout the day.Mobile Network Data SampleThe data presented is a summary analysis of multipleNorth American mobile networks analyzed over themonth of January 2021 at hourly intervals.A day in the life ofyour networkMobile network of todayBy looking at an average day in a mobilenetwork, we are going to sample differenttime periods to understand how applicationsand services change throughout the day. Weare mapping three distinct time periods –the morning when the traffic picks up, theafternoon with a peak at around 5pm, and theevening when there is a change in applicationusage.Peak TimesUnderstanding peak times is vital to delivering agreat application quality of experience. It comesas little surprise that mobile network traffic peaksbetween 3pm and 6pm when work and schoolare finishing up. However, different services peakduring different times of the day and it is vital fornetwork operators to understand what matters tosubscribers and when.Sandvine’s panel of network expertsare ready to help you understand theapplications that are driving a day inthe life of your network.Click here to learn more and speak withour experts.Click here0123NIGHT45678910 11 12 13 14 15 16 17 18 19 20 21 22 23MORNINGAFTERNOON PREVIOUSEVENINGSTARTNEXT Copyright 2021 Sandvine. All rights reserved. All other trademarks are property of their respective owners.13
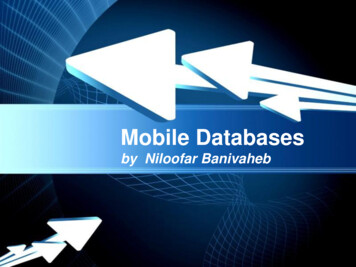
The Mobile InternetA Day in the Life of a Mobile NetworkPhenomena ReportMay 2021Morning has brokenFacebook, Facebook Video, and Instagramusage peaks in the morning as users start theircommutes to work and school and catch up onchanges in their social networks.Service Breakdown in the MorningWhat services do consumers use most as they starttheir day?Skype makes it to the highest rank in the top 10, aspeople make calls and message colleagues as theday begins.Marketplace 2.5%File Sharing 0.2%Gaming 0.5%23NIGHT456789MORNING10 11 12 13 14 15 16 17 18 19 20 21 22 23AFTERNOONVideoStreamingFacebookInstagramTikTok iCloud Instagram4.1% 3.2% Video 2%SocialNetworking6.3%1Click hereTop 10 ApplicationsMessaging0Speak with our experts to see a dayin the life of your network and how Sandvineenables operators to delight their customers.Social Networking comes in at number one with 29%of traffic, followed by Web browsing as consumerscatch up and start their day reading the latest news,trends and updates.Application Traffic CategoryCloudUnderstanding
Our ability to classify over 95% of network traffic across mobile and fixed networks by user, application, device, location, and other parameters creates . We are committed to delivering the preeminent view of global trends and distilled insights into the internet application ecosystem. As our global reach continues to expand across fixed .