Transcription
DATA ANALYSIS, INTERPRETATIONAND PRESENTATION
OVERVIEW Qualitative and quantitative Simple quantitative analysis Simple qualitative analysis Tools to support data analysis Theoretical frameworks: grounded theory,distributed cognition, activity theory Presenting the findings: rigorous notations,stories, summaries
WHY DO WE ANALYZE DATAThe purpose of analysing data is to obtain usable and usefulinformation. The analysis, irrespective of whether the data isqualitative or quantitative, may: describe and summarise the data identify relationships between variables compare variables identify the difference between variables forecast outcomes
SCALES OF MEASUREMENTMany people are confused about what type ofanalysis to use on a set of data and therelevant forms of pictorial presentation ordata display. The decision is based on thescale of measurement of the data. Thesescales are nominal, ordinal and numerical.Nominal scaleA nominal scale is where:the data can be classified into a nonnumerical or named categories, andthe order in which these categories can bewritten or asked is arbitrary.Ordinal scaleAn ordinal scale is where:the data can be classified into non-numerical or namedcategoriesan inherent order exists among the response categories.Ordinal scales are seen in questions that call forratings of quality (for example, very good, good, fair,poor, very poor) and agreement (for example, stronglyagree, agree, disagree, strongly disagree).Numerical scaleA numerical scale is:where numbers represent the possible responsecategoriesthere is a natural ranking of the categorieszero on the scale has meaningthere is a quantifiable difference within categories andbetween consecutive categories.
When using a quantitative methodology, you are normally testing theory through the testingof a hypothesis.In qualitative research, you are either exploring the application of a theory or model in a differentcontext or are hoping for a theory or a model to emerge from the data. In other words,although you may have some ideas about your topic, you are also looking for ideas,concepts and attitudes often from experts or practitioners in the field.
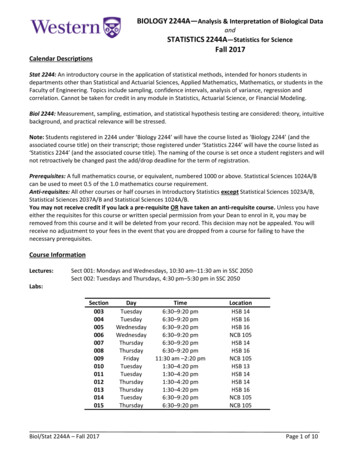
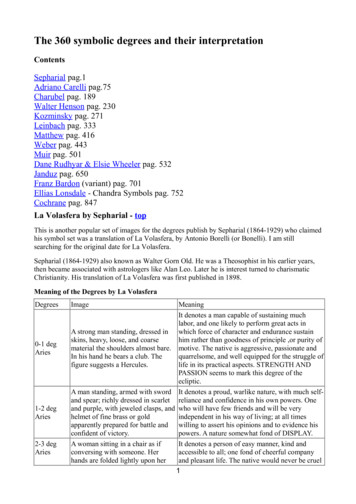
GRAPHICAL REPRESENTATIONSgive overview of data10864Internet use2005101520 once a dayUseronce a dayonce a weekNumber of errors made2 or 3 times a weekonce a monthNumber of errors madeNumber of errors madeNumber of errors made4.543.532.521.510.5013579User11131517
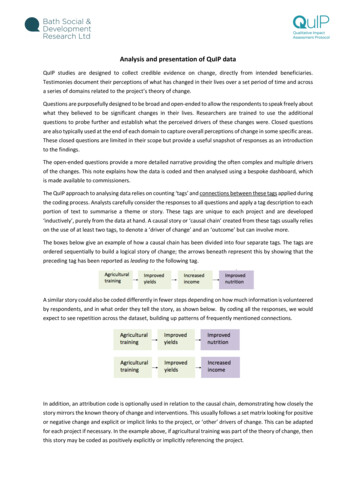
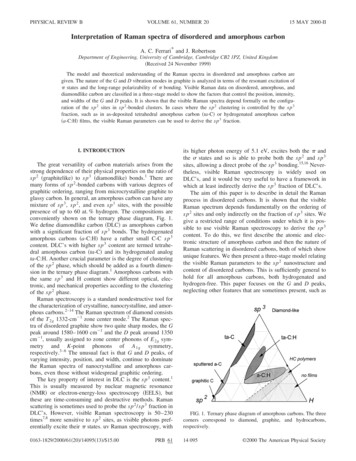
Visualizing log dataInteractionprofiles of playersin online gameLog of web pageactivity
QUALITATIVE ANALYSIS"Data analysis is the processof bringing order, structureand meaning to the mass ofcollected data. It is amessy, ambiguous, timeconsuming, creative, andfascinating process. It doesnot proceed in a linearfashion; it is not neat.Qualitative data analysis isa search for generalstatements aboutrelationships amongcategories of data."Marshall and Rossman, 1990:111Hitchcock and Hughes takethis one step further:" the ways in which theresearcher moves from adescription of what is thecase to an explanation ofwhy what is the case is thecase."Hitchcock and Hughes 1995:295
Simple qualitative analysis Unstructured - are not directed by a script. Rich but notreplicable. Structured - are tightly scripted, often like a questionnaire.Replicable but may lack richness. Semi-structured - guided by a script but interesting issues canbe explored in more depth. Can provide a good balancebetween richness and replicability.
Simple qualitative analysis Recurring patterns or themes– Emergent from data, dependent on observationframework if used Categorizing data– Categorization scheme may be emergent or pre-specified Looking for critical incidents– Helps to focus in on key events
TOOLS TO SUPPORT DATAANALYSIS Spreadsheet – simple to use, basic graphs Statistical packages, e.g. SPSS Qualitative data analysis tools– Categorization and theme-based analysis, e.g. N6– Quantitative analysis of text-based data CAQDAS Networking Project, based at the University of Surrey(http://caqdas.soc.surrey.ac.uk/)
Theoretical frameworks forqualitative analysis Basing data analysis around theoretical frameworks providesfurther insight Three such frameworks are:– Grounded Theory– Distributed Cognition– Activity Theory
Grounded Theory Aims to derive theory from systematic analysis of data Based on categorization approach (called here ‘coding’) Three levels of ‘coding’– Open: identify categories– Axial: flesh out and link to subcategories– Selective: form theoretical scheme Researchers are encouraged to draw on own theoreticalbackgrounds to inform analysis
Distributed Cognition The people, environment & artefacts are regarded as onecognitive system Used for analyzing collaborative work Focuses on information propagation & transformation
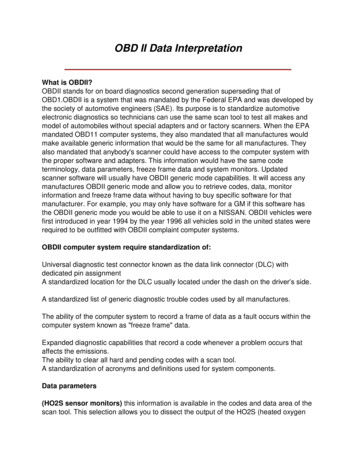
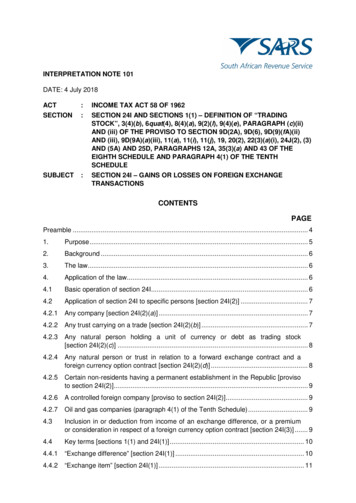
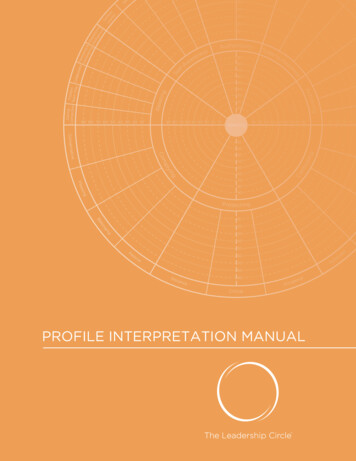
Activity Theory Explains human behavior in terms of our practical activity withthe world Provides a framework that focuses analysis around the concept ofan ‘activity’ and helps to identify tensions between the differentelements of the system Two key models: one outlines what constitutes an ‘activity’; onemodels the mediating role of artifacts
Individual model
Engeström’s (1999) activitysystem model
Presenting the findings Only make claims that your data can support The best way to present your findings depends on the audience,the purpose, and the data gathering and analysis undertaken Graphical representations (as discussed above) may beappropriate for presentation Other techniques are:– Rigorous notations, e.g. UML– Using stories, e.g. to create scenarios– Summarizing the findings
SUMMARY The data analysis that can be done depends on thedata gathering that was done Qualitative and quantitative data may be gatheredfrom any of the three main data gathering approaches Percentages and averages are commonly used inInteraction Design Mean, median and mode are different kinds of‘average’ and can have very different answers for thesame set of data Grounded Theory, Distributed Cognition and ActivityTheory are theoretical frameworks to support dataanalysis Presentation of the findings should not overstate theevidence
Presenting the findings Only make claims that your data can support The best way to present your findings depends on the audience, the purpose, and the data gathering and analysis undertaken