Transcription
1) Overview2) Measurement and Scaling3) Primary Scales of Measurementi.Nominal Scaleii.Ordinal Scaleiii.Interval Scaleiv.Ratio Scale4) A Comparison of Scaling TechniquesComparative Scaling Techniquesi.Paired Comparisonii.Rank Order Scalingiii.Constant Sum Scalingiv.Q-Sort and Other Procedures6) Verbal Protocols
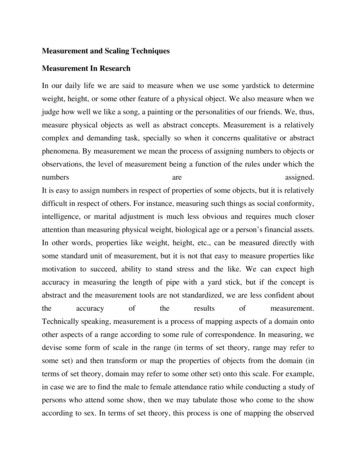
Measurement means assigning numbers or othersymbols to characteristics of objects according tocertain prespecified rules.– One-to-one correspondence between the numbersand the characteristics being measured.– The rules for assigning numbers should bestandardized and applied uniformly.– Rules must not change over objects or time.Scaling involves creating a continuum upon whichmeasured objects are located.Consider an attitude scale from 1 to 100. Eachrespondent is assigned a number from 1 to 100, with1 Extremely Unfavorable, and 100 ExtremelyFavorable. Measurement is the actual assignment ofa number from 1 to 100 to each respondent. Scalingis the process of placing the respondents on acontinuum with respect to their attitude towarddepartment stores.
Numbers are usually assigned for tworeasons:– First, numbers permit statistical analysis ofthe resulting data– Second, numbers facilitate thecommunication of measurement rules andresults Description Order Distance Origin
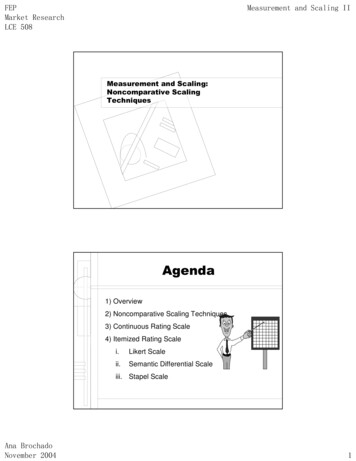
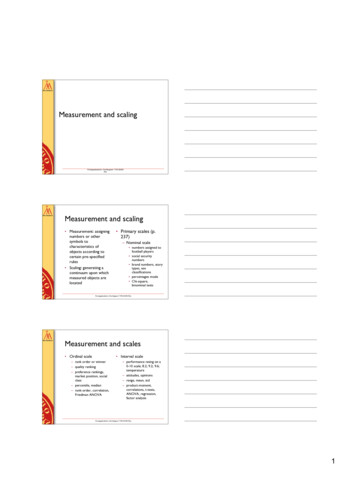
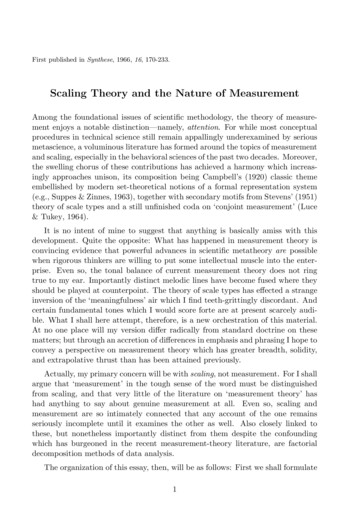
!Table 12.2 Illustration of primary scales of measurement
NominalScaleOrdinalScaleNo. SnackPreferenceRankings1. KitKat2. Crunch3. Lion4. Bounty5. Nesquik6. Galak7. Snikers8. Nuts9. Toffee Crisp10. 14151612RatioScale spent last3 months02000100250350100010
Gender– Male– Female Marital Status– Married– Single– Divorced With whom are you traveling on this flight?– No one– Spouse– Spouse and children- Children only- Business associates/ friends- An organized tour group The numbers serve only as labels or tags foridentifying and classifying objects. When used for identification, there is a strict one-toone correspondence between the numbers and theobjects. The numbers do not reflect the amount of thecharacteristic possessed by the objects. The only permissible operation on the numbers in anominal scale is counting. Only a limited number of statistics, all of which arebased on frequency counts, are permissible, e.g.,percentages, and mode.
Airline food service to me is––––– Extremely importantVery importantSomewhat importantNot very importantNor all importantHow often do you consumesoft drinks in a typical week?––––Less than once a week1 to 3 times per week4 to 6 times per week7 or more times per week What age group are you in?–––––18-2425-2930-3435-4445 and over
Please rank the following snacks in terms of yourpreference–––––BountyTofee CrispNutsLionCrunch A ranking scale in which numbers are assigned toobjects to indicate the relative extent to which theobjects possess some characteristic. Can determine whether an object has more or less ofa characteristic than some other object, but not howmuch more or less. Any series of numbers can be assigned thatpreserves the ordered relationships between theobjects. In addition to the counting operation allowable fornominal scale data, ordinal scales permit the use ofstatistics based on centiles, e.g., percentile, quartile,median.
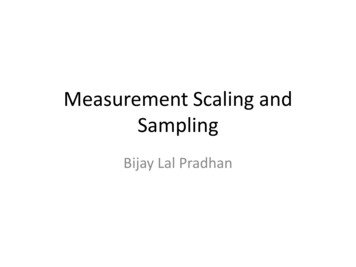
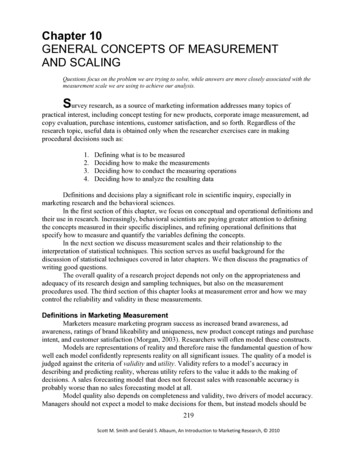
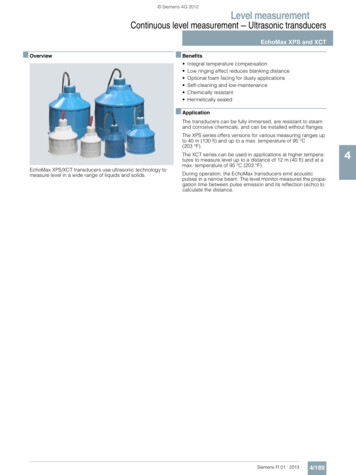
! ºCºF03210502068308640104 ( )
Numerically equal distances on the scale represent equalvalues in the characteristic being measured. It permits comparison of the differences between objects. The location of the zero point is not fixed. Both the zeropoint and the units of measurement are arbitrary. Any positive linear transformation of the form y a bxwill preserve the properties of the scale. It is meaningful to take ratios of scale values. Statistical techniques that may be used include all ofthose that can be applied to nominal and ordinal data, andin addition the arithmetic mean, standard deviation, andother statistics commonly used in marketing research."
Education (Nº of schooling years) Monthly net household income Age Nº of family members" Possesses all the properties of the nominal, ordinal,and interval scales. It has an absolute zero point. It is meaningful to compute ratios of scale values. Only proportionate transformations of the form y bx,where b is a positive constant, are allowed. All statistical techniques can be applied to ratio data.
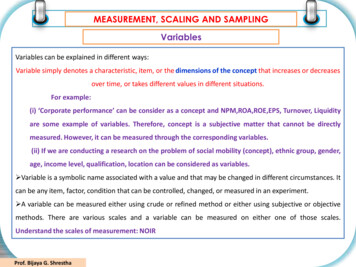
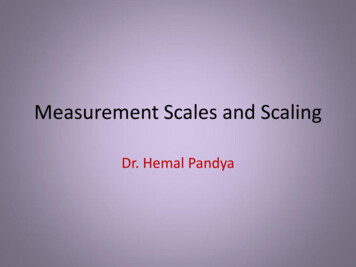
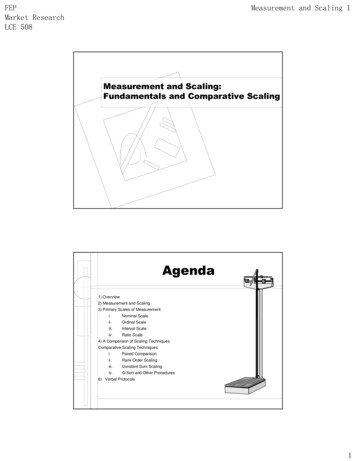
Sca leNomina lOrdina lInte rva lRa tioBasicCha racte risticsNumbers identify& classify objectsComm onEx a m ple sSocial Securitynos., numberingof football playersNos. indicate the Quality rankings,relative positions rankings of teamsof objects but not in a tournamentthe magnitude ofdifferencesbetween themDifferencesTemperaturebetween objects (Fahrenheit)Zero point is fixed, Length, weightratios of scalevalues can becomparedMa rke tingPe rmissible Sta tisticsEx a mple sDescriptiveInferentialBrand nos., store Percentages,Chi-square,typesmodebinomial testPreferencePercentile,rankings, market medianposition, tudes,opinions, indexAge, sales,income, costsProductmomentCoefficient ofvariationRange, mean,standardGeometricmean, harmonicmean# % & &&'()& "#
# Comparative scales involve the direct comparison ofstimulus objects. Comparative scale data must beinterpreted in relative terms and have only ordinal orrank order properties. In noncomparative scales, each object is scaledindependently of the others in the stimulus set. Theresulting data are generally assumed to be interval orratio scaled." Small differences between stimulus objects can bedetected. Same known reference points for all respondents. Easily understood and can be applied. Involve fewer theoretical assumptions. Tend to reduce halo or carryover effects from onejudgment to another.
"% Ordinal nature of the data Inability to generalize beyond the stimulus objectsscaled.
A respondent is presented with two objects andasked to select one according to some criterion. The data obtained are ordinal in nature. Paired comparison scaling is the most widely usedcomparative scaling technique. With n brands, [n(n - 1) /2] paired comparisons arerequired Under the assumption of transitivity, it is possible toconvert paired comparison data to a rank order. Paired comparison data can be analyzed inseveral ways– The researcher can calculate the percentage ofrespondents who prefer one stimulus to another– Under the assumption of transitivity, it is possibleto convert paired comparison data to range order– It's also possible to derive an interval scale frompaired comparison data using the Thurstone sprocedure
&' , ! * * !- ./ ,01./012 345 ,," *, ! ,& *!* ! * , * & , ! % ,( 6 & !, *, !7
.150.36D0.860.980.85-0.52E0.730.790.640.48-"( Respondents are presented with several objectssimultaneously and asked to order or rank themaccording to some criterion. It is possible that the respondent may dislike thebrand ranked 1 in an absolute sense. Furthermore, rank order scaling also results in ordinaldata. Only (n - 1) scaling decisions need be made in rankorder scaling.
'"#() ,8* *, 3,&* ,, , ,.* *Figure 12.4 Preference for car brands using rank order scaling* ,,
'"#()!# %&'''''''''&'''''''''(!)'''''''''!*''''''''' #& '''''''' Respondents allocate a constant sum of units, suchas 100 points to attributes of a product to reflect theirimportance. If an attribute is unimportant, the respondent assignsit zero points. If an attribute is twice as important as some otherattribute, it receives twice as many points. The sum of all the points is 100. Hence, the name ofthe scale.
)&'5 ,! * * ,!,) ! ,! * ,)&'! ,93,"2,4,:,;, ,9 ,&)! 32:2 :234 :2;4 3:
* Q-sort scaling was developed to discriminate arelatively large number of objects quickly A comparative scaling technique that uses rank orderprocedure to sort objects based on similarity withrespect to some criterion For example, respondents are given 100 attitudestatements on individual cards and asked to placethe, into 11 piles, ranging from most highly agreedwith’ to ‘least highly agreed with’
Scaling involves creating a continuum upon which measured objects are located. Consider an attitude scale from 1 to 100. Each respondent is assigned a number from 1 to 100, with 1 Extremely Unfavorable, and 100 Extremely Favorable. Measurement is the actual assignment of a number from 1 to 100 to each respondent. ScalingFile Size: 765KBPage Count: 21