Transcription
energiesArticleA Matrix FMEA Analysis of Variable Delivery Vane PumpsJoanna Fabis-Domagala 1 , Mariusz Domagala 1, *12* Citation: Fabis-Domagala, J.;and Hassan Momeni 2Institute of Applied Informatics, Cracow University of Technology, Al. Jana Pawla II 37,31-864 Cracow, Poland; joanna.fabis-domagala@pk.edu.plDepartment of Mechanical and Marine Engineering, Western Norway University of Applied Sciences,N5020 Bergen, Norway; Hassan.Momeni@hvl.noCorrespondence: domagala@mech.pk.edu.plAbstract: Hydraulic systems are widely used in the aeronautic, machinery, and energy industries.The functions that these systems perform require high reliability, which can be achieved by examiningthe causes of possible defects and failures and by taking appropriate preventative measures. One ofthe most popular methods used to achieve this goal is FMEA (Failure Modes and Effects Analysis),the foundations of which were developed and implemented in the early 1950s. It was systematized inthe following years and practically implemented. It has also been standardized and implemented asone of the methods of the International Organization for Standardization (ISO) 9000 series standardson quality assurance and management. Apart from wide application, FMEA has a number ofweaknesses, which undoubtedly include risk analysis based on the RPN (Risk Priority Number),which is evaluated as a product of severity, occurrence, and detection. In recent years, the riskanalysis has been very often replaced by fuzzy logic. This study proposes the use of matrix analysisand statistical methods for performing simplified RCA (Root Cause Analysis) and for classificationpotential failures for a variable delivery vane pump. The presented methodology is an extension ofmatrix FMEA and allows for prioritizing potential failures and their causes in relation to functionsperformed by pump components, the end effects, and the defined symptoms of failure of thevane pump.Domagala, M.; Momeni, H. A MatrixFMEA Analysis of Variable DeliveryKeywords: FMEA; failure analysis; matrix FMEA; vane pumpVane Pumps. Energies 2021, 14, 1741.https://doi.org/10.3390/en14061741Academic Editor: Ryszard DindorfReceived: 25 February 2021Accepted: 17 March 2021Published: 21 March 2021Publisher’s Note: MDPI stays neutralwith regard to jurisdictional claims inpublished maps and institutional affiliations.Copyright: 2021 by the authors.Licensee MDPI, Basel, Switzerland.This article is an open access articledistributed under the terms andconditions of the Creative CommonsAttribution (CC BY) license (https://creativecommons.org/licenses/by/4.0/).1. IntroductionDue to a high power transmission density, relatively simple movement transformation, and smooth control, hydraulic systems find wide industrial application. Suchsystems equipped with automation components enable high positioning accuracy andprogramming movement trajectory. Hydraulic drive systems use accumulated pressureenergy of working fluids generated in the hydraulic pump, which is transferred to thereceivers by rigid or flexible pipes. This feature creates flexibility, which is unreachablefor other systems, and almost unrestricted design capabilities. In addition, compared topurely mechanical systems, any dynamic load can be relatively simply dissipated. Theabovementioned advantages make hydraulic systems widely used in drive and controlsystems in the aeronautic (control systems in airplanes and helicopters), mining, energy(control systems), and automotive industries, which require high reliability and safety.In order to meet these requirements, knowledge about possible failures of such systemsas well as their causes is needed. This might be obtained using various methods andtools. Y. Lee et al. [1] carried out an analysis of failures of hydraulic systems used inwind turbines to control pitch blades. The failures of a hydraulic system in wind turbineswere also investigated by Y. Lee et al. [2] using Fault Tree Analysis (FTA) and fuzzylogic. Research on the influence of vibrations on hydraulic pipeline failures was conducted byP. Gao et al. [3], while G. Wang et al. [4] studied the influence of failures on shifting qualityand driving safety for a continuously variable transmission (CVT) tractor. Research wasEnergies 2021, 14, 1741. .com/journal/energies
Energies 2021, 14, 17412 of 14conducted not only for the entire system but also for individual components among whichpumps as an energy source are the most critical one. Z. Ma et al. [5] led research on hydraulicpump faults by using a model-based diagnosis system, while T. Li et al. [6] used multiscaleinformation for predicting the remaining useful time of a piston pump. D. Hast et al. [7]also worked on fault specification for the detection of a piston pump fault. C. Lu et al. [8]developed a fault diagnosis method for hydraulic pumps used in aeronautic application basedon the evidence theory. Relationships between failure modes and their causes and effects canbe developed on the basis of the history of failures and/or using methods of failure analysisamong which FMEA (Failure Modes and Effects Analysis) is one of the most successful.There are numerous variations of this method or methods such as fault tree analysis, eventtree analysis, or other quality improvement methods and tools [9] that might be used forthis purpose. The FMEA fundamental principles found many applications such as RCM(Reliability-Centered Maintenance), hazard analysis, concept FMEA, and FMEDA (FailureModes, Effects, and Diagnostic Analysis) [10]. RCM is an evolution of FMEA that is used forplanning preventive maintenance activity. Increasing demands triggered research on failurepredictions and estimation of useful life. It can lead to predicting maintenance plans and, inconsequences, achieves the required operation conditions. Fault prognosis methods are notformally classified yet. The work of [11] defined health monitoring systems in a hierarchicalstructure that uses expert knowledge, physical model, and data driven knowledge. Physicalmodel approaches require an analytical model of the system, while data-driven knowledgeapproaches define detection and diagnosis as a classification task. The most common toolused in data-driven approaches are neutral network, control charts, and principal componentanalysis [12]. Another method is presented in Reference [13], in which fault diagnosis andrelated fault prognosis allow us to estimate the remaining useful life for data available in anormal operation. Research on failures and its causes has been carried out for many years, hasfound practical application, and was firstly implemented by the US military in 1949: MIL-P1629 “Procedure for Performing a Failure Modes, Effects and Criticality Analysis” [14]. Thenext step in the practical implementation of FMEA was done by NASA during the Apollomission program to estimate the influence of a potential failure on mission success and crewsafety. In the next decade, the FMEA was adopted in the automotive industry by one of thelargest players: Ford Motor Company. The FMEA was fully formulated and standardizedin the 1980s and 1990s in the military standard MIL-STD 1629A, included in the International Organization for Standardization (ISO) 9000 series standards and implemented by SAEJ1739 [15]. FMEA supplemented with criticality analysis is known as FMECA (Failure ModesEffect and Criticality Analysis). The FMEDA, for which the foundations were defined inthe 1980s, also found practical application, initially in electrical and electronic systems[16]. It supplements the FMEA with two pieces of information: failure rates and the distribution of failure modes, and the ability of detection of failures via an online diagnosticsystem. It is used as a tool for supporting the IEC61508 standard [17]. The applicabilityof this method was later extended to electromechanical and mechanical systems [18].The classic FMEA method has many weaknesses, the most important of which is theuse of natural language [19] and erroneous risk estimation using the Risk Priority Number(RPN). Liu HC et al. in [20,21] analyzed the limitations in estimating the risk analysis withthe use of RPN. Currently, in the literature, various approaches are used in the evaluationof risk analysis. One of the alternatives is fuzzy logic, which was used by Liu HC et al. [22],S. Bahrebar et al. [23], S. Liu et al. [24], Y. Lv et al. [25], and G. Filo et al. [26]. Theweakness of the classical RPN model was also noticed by the industry and recently wasreplaced by action-priority [27]. In the case of a vane pump, an additional factor that makesevaluation of the probability of a failure detection relatively small is the diagnostic possibilities.During pump operation, they are limited to the measurement of several physical quantities,such as pressure, volumetric flow rate at the pump outlet, and the level of vibration andnoise [28]. Additionally, the same symptoms may indicate various types of failures [29].FMEA uses various tools, one of which is the matrix analysis, which was implemented byG. L. Barbour [30] and M. E. Stock et al. [31] and used in the developed function-failure design
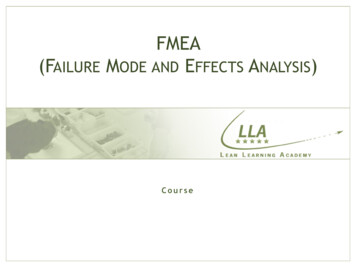
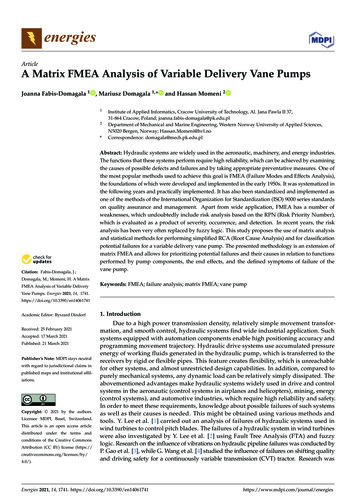
Energies 2021, 14, 17413 of 14method. S. G. Arunajadai et al. [32] used the matrix analysis and clustering analysis for failuremodes identification. This study proposes a method that is an extension of the method createdby G. L. Barbour [30] and combines the aspects of classical FMEA, risk analysis, and RCA [33]by utilization matrix analysis and statistical tools for the failure analysis of a hydraulic vanepump with variable delivery. The presented method can be used in the conceptual, design, orearly production stage or in case when expert knowledge base is not available or incomplete.The proposed approach eliminates some of the basic disadvantages of the traditional FMEAand takes into account the relationship between failures and their causes and end effects. Itclassifies the potential failures and their causes in relation to the importance of individualpump components. This is achieved by matrix transformations. It also allows for classifyingpotential failures that may occur during pump operation based on the symptoms of pumpmalfunction by using the Jaccard index [34]. In addition, a practical sheet was developed,which was used to define the necessary data for the analysis.2. Research MethodologyVane pumps are displacement-types pump in which the displacement chamber iscreated during shaft rotation between blades, stator, and the covers. An exemplary pumpis shown in Figure 1. It is a variable delivery pump by Ponar Wadowice, Poland.Figure 1. Vane pump: 1—shaft with rotor; 2—stator ring; 3—cover; 4—housing; 5—vanes; 6 and7—plain bearings; 8–11—port plates; 12—groove key; 13—pressure controller; 14 and 16—controlpistons; 15—adjustment screw; 17—plug; 18 and 19—bolts; 20 and 21—sealing rings; 22—pins;P—pressure port; S—supply port (at the bottom of housing).Two vanes are placed in a single rotor socket, which is made as one part with the shaft.Hydraulic oil is supplied to the displacement chambers through a suction channel in thehousing through the side covers. This pump is a double-vane design with relief channelsthat allow for balancing the pressure on both sides of the vanes and, in consequence, forreducing the frictional forces (vane/stator ring wear) and increasing the pump life time.Pump delivery is set by a regulator that sets the position of the stator via piston. The
Energies 2021, 14, 17414 of 14adjusting screw sets the maximal stator eccentricity, which defines the maximal pumpdelivery. The shaft is mounted on plain bearings in the cover and body, which are boltedtogether. The drive is transmitted through the key connection on the shaft. The proposedmethodology is similar to classic FMEA [35] and consists of the following stages:1.2.3.4.5.6.Main assumptions.Preparation stage.Specification of potential failure modes, and their causes and end effects for individualpump components.Creating sheet.Analysis.Prioritization of failures, and their causes and end effects.Assumptions.The main purpose of this study was a qualitative analysis of failure modes, failuresand their causes, prioritization of failures, and their causes and end effects. The analysiswas carried out only for mechanical systems of the vane pump and without a deliverycontrol system (valve). It was assumed that the analysis would use typical components thatoccur in vane pumps, not only those presented on Figure 1. In addition, it was assumedthat the knowledge base of failures occurring in this type of pump, which may lead topump malfunction or damage, and the probability of their occurrence is not available.Therefore, potential failures were not prioritized, but their occurrence was only indicatedby a binary number system. The same method was used for indicating the cause of failures,the importance of pump components, and end effects. The end effects deal with individualcomponents, not the pump as a whole system. It was assumed that the general form(primary form) of failure would be analyzed (each form of failure may have a variety ofdifferent mechanisms).Preparatory stage.In the preparatory stage, the pump was decomposed into individual components andtheir validity was determined based on the functional analysis of the pump. In contrast tothe works of [31,33], the functions of the components were determined depending on theirimpact on the main task of the pump: pumping hydraulic oil to receivers. The followingcomponents of vane pumps were used: housing (c1 ), cover (c2 ), shaft and rotor as one part(c3 ), stator (c4 ), vane (c5 ), port plate (c6 ), bearing (c7 ), piston (c8 ), sealing ring (c9 ), pin(c10 ), spring (c11 ), and fastener (c12 ). The abovementioned components were categorizedfor the following functions:1.2.3.Main function (components that perform the intended function: pumping fluid toreceivers) (u1 ). The following components were assigned to this function: housing,cover, shaft, stator, vane, and fastener.Auxiliary functions. Components performing these functions ensure proper operationof the pump. Their possible failures may cause the pump malfunction, but the maintask of the pump is still maintained (u2 ). These components are the port plate, bearing,piston, and sealing ring.Additional components. Their failure has little effect on the main task of the pump(u3 ). These elements are the sealing ring, pin, and spring.In the next step, potential failures that may occur for pump components were identified and classified. We assumed that the knowledge base about vane pump failures isnot available; therefore, we used the analogy of failures that occur in typical mechanicalsystems. It was assumed that the vane pump experiences failures typical of machineshafts, plane and ball bearings, screw connections, sealing components, springs, andpumps (in general). The individual failure might be the result of a chain of several appearing failures, and consequently, determining the cause of the failure is a difficult task. Thework of [36] shows examples of failures for which determining the root cause is not straightforward and requires detailed studies. Failure classification is a complex task, and variousclassification forms are used [37,38]. Donald J. Wulpi [39] defines the following primary
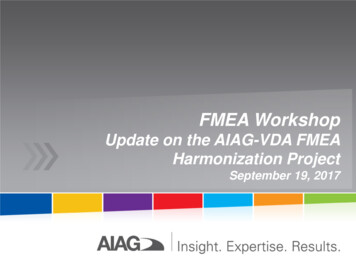
Energies 2021, 14, 17415 of 14failures: distortion or undesired deformation: fracture, corrosion, and wear. Wear mechanisms and modes were presented in [40] as mechanical, chemical, and thermal. Potentialfailures that can occur in vane pumps were classified according to the following mechanisms: fracture and separation, deformation, wear, erosion, corrosion, displacement, andmaterial properties. The following types of failures were selected on the basis of the literature analysis concerning the wear of typical machine shafts [35]: fatigue, corrosion (stresscorrosion cracking and corrosion fatigue), abrasive wear (erosion, polishing scratching, andgouging), adhesive wear (scoring, galling, seizing, scuffing, pitting, and fretting), corrosivewear, fretting corrosion, cavitation corrosion, and debris wear. The typical failures of screwconnections [36] are fracture (under static load), fatigue, loosening (due to vibration),and corrosion. The typical failures of seals [41] are pattern failure, extrusion, hardening,and damage during installation. The following failures were selected for bearings [36]:deformation (brinelling), fatigue, corrosion (stress corrosion cracking and corrosion fatigue), abrassive wear (erosion, polishing scratching, and gouging), adhesive wear (scoring,galling, seizing, scuffing, pitting, and fretting), corrosive wear, fretting corrosion, cavitationcorrosion, and debris wear.In this study, potential failures were classified based on the wear mechanism in thefollowing way:1.2.3.4.5.6.7.Fracture and separation: brittle fracture ( f 11 ), fatigue fracture ( f 12 ), pitting ( f 13 ).Deformation: yielding ( f 21 ), extrusion-shrinkage ( f 22 ).Wear: abrasive wear ( f 31 ), adhesive wear ( f 32 ).Erosion: particles erosion ( f 41 ), cavitation erosion ( f 42 ).Corrosion: general corrosion ( f 51 ), chemical attack ( f 52 ).Displacement: loosening ( f 61 ), seizing ( f 62 ).Material properties: aging ( f 71 ), hardening ( f 72 ).In the next step, the primary root causes of failures were defined. The availableliterature [40] defines the following root causes: physical, human, and latent. For the vanepump, the primary root causes were set as follows:1.2.3.4.5.Design/Specification (o1 ).Material/Manufacturing (o2 ).Assembly/Installation (o3 ).Maintenance/Fluid (o4 ).Operation: Overload (o5 ).At this stage, the end effects that can occur as a results of individual failure werealso identified:1.2.3.4.Catastrophic: major damages with component destruction (l1 ).Critical: component malfunction with severe damages (l2 ).Marginal: component malfunction with minor damages (l3 ).Minor: less than minor damages (l4 ).Creating sheet.To perform the analysis, the sheet presented in Figure 2 was created. It consists ofthe relationships between the components, failures, causes, and end effects. These relationare binary numbers, where (1) indicates that the relation is true and (0) indicates that itis false.
Energies 2021, 14, 17416 of 14Figure 2. Sheet, C—component, U—component function, O—primary root causes, L—end effect,FC—relation failure–component, UC—relation function–component, FO—relation failure–cause,FL—relation failure–end effect).Analysis.The data from Figure 2 (the sheet) can be presented as sets of components, failures,causes of failures, end effects, and functions of components. We can write these sets asfollows:Set of components C, wherec j C, j {1 . . . n}(1)f i F, i {1 . . . m}(2)Set of failures F, whereSet of causes of failures O, whereo j O, j {1 . . . k }(3)l j L, j {1 . . . s}(4)u j U, j {1 . . . p}(5)Set of end effects L, whereSet of end effects, U whereWe define the relationships between the listed sets. The relationship between the setsof failures F and components C can be defined as follows:(1, if failure occursRfc F C (6)0,no failure.The relationship between the sets of failures F and their causes O can be definedas follows:(1, if cause can make failureRfo F O (7)0,otherwiseThe relationship between the sets of failures F and end effects L can be definedas follows:
Energies 2021, 14, 17417 of 14(Rfl F L 1,0,if cause can make failureotherwise(8)The relationship between the sets of components C and their functions U can bedefined as follows:(1, if component perform functionRcu C U (9)0,otherwiseThe obtained matrices can be used to prioritize potential failures in the vane pump forthe functions performed by the elements by multiplying the matrix UC and the transposedmatrix FC T :UF UC · FC T(10)The relationship between the causes of potential failures for individual components isobtained by multiplying the transposed matrix FO T and the matrix FC:OC FO T · FC(11)The relationship between the end effects inducted by failures and pump componentsis obtained by multiplying the transposed matrix FL T and the matrix FC:LC FL T · FC(12)The relationship between the failure causes and the end effects is obtained by multiplying the transposed matrix FL T and the matrix FO:LO FL T · FO(13)The relationship between components function and the end effects inducted by failuresis obtained by multiplying the matrix FU and the matrix FL:UL FU · FL(14)The relationship between components function and the causes of failures is obtainedas follows:UO (UC · FC T ) · FL · ( FL T · FO)(15)The values of elements of the matrices OC, LC, UF, LO, UL, and UO can be written inthe following general form:ncij aim bmj(16)m 1where cij is the element of matrices OC, LC, UF, LO, UL, and UO, while aim and bmj areelements of the multiplied matrices FC, UC, FO, and FL.The created matrices can also be used to determine the impact of potential failureson the pump failure modes. For realization of this purpose, we can assume a kind of testvector that we can define as follows:T [ t1 , . . . , t n ](ti T 1,0,if failure occuresotherwise(17)(18)
Energies 2021, 14, 17418 of 14where t is the generalized failure for the i-th pump component, which belongs to set C.Next, the Jaccard similarity index [34] is used for evaluating the influence of potentialfailure on given failure modes by measuring the similarity of test vector T with a row ofmatrix FC:J ( T, Fi ) T Fi T Fi (19)where Fi is the i-th row of matrix FC.3. ResultsThe sets of components, potential failures, causes, and end effects are expressed in theform presented below.Set of components:C c1c2c3c4c5c6c7c8c9f 61c10c11c12 (20)Set of potential failures:F f 11f 12f 13f 21f 22f 31f 32f 41f 42f 51f 52O o1o2o3o4 u1u2u3f 62f 71f 72 (21)Set of failure causes:o5 (22)Set of components function:U (23)Set of end effects inducted by failures:L l1l2l3l4011001111010100000001100110100 (24)Equation (6) gives matrix FC: FC 00011100101000010000110000000110000110100000101000 Equation (7) gives matrix FO, while Equation (8) gives matrix FL:(25)
Energies 2021, 14, 17419 of 14 100110000001000001011111010111100100000000001 Equation (9) gives matrix UC: 1 1 1 UC 0 0 00 0 0100100010 FO 111110101111110111110100111111 FL 1111111001111111111111111 (26) 10 0(27)Equations (10)–(15) gives matrices OC, LC, UF, LO, UL, and UO, respectively.The matrix UF describes the relationships between failures and pump components: 6 6 3 6 0 5 5 5 5 1 5 1 2 0 0UF 0 2 1 0 1 4 3 2 2 1 3 0 3 1 1 (28)2 1 0 1 1 2 0 0 0 1 2 0 0 1 1The matrix OC describes the relationships between failure causes and pump components: OC 4411155302 (29)The matrix LC describes the relationships between pump components and end effects: 3 3LC 88 4 4LO 1212441212334433883310103 33 39 109 10 1 1 0 1 2 2 31 1 0 1 2 2 3 7 8 5 4 4 4 5 7 8 5 4 4 4 5(30)The matrices LO, UL, and UO describe the relationships between failure causes andend effects, component functions and end effects, and component functions and causes offailures, respectively. 1 219 19 58 581544 1544 578 1198 4241 2 UL 2 2 20 20 UO 496 496 172 404 128 (31)10 3 5 5 12 12328 328 126 250 9210 3To evaluate the influence of defined failures on failure modes and prioritize failure,we can classify failure modes in the following ways [42]:1.Critical, the pump does not realize the intended function (no flow on the pump outlet): Symptom: no shaft rotation T1 .Symptom: pump leakage T2 .
Energies 2021, 14, 174110 of 142.Major, pump malfunction:Symptom: noisy operation T3 .Symptom: flow below rated T4 .Symptom: pressure below rated T5 . 3.Minor:Symptom: unusual heat level T6 .Symptom: shaft leaks T7 . The tests vectors for the abovementioned symptoms are presented in (Table 1)Table 1. Test vector 10000001001001000000000000100000Discussion.The results presented in the above section allow for the classification of failures andtheir causes depending on the user’s needs. Let us assume that, as in a typical FMEA, weare interested in prioritizing failures. Using the matrix UF Equation (28), we can determinethe failures that occur most often for the functions performed by the pump components.Taking into account the end effects, we can classify the failures as follows:1.2.3.4.5.Brittle fracture ( f 11 ), fatigue fracture ( f 12 ), yielding ( f 21 ).Abrrasive wear ( f 31 ), adhesive wear ( f 32 ), particles erosion ( f 41 ), cavitaion erosion( f 42 ), chemical attack ( f 52 ).Pitting ( f 13 ).Seizing ( f 62 ).Aging ( f 71 ), hardening ( f 72 ).Analysis of the matrix OC in Equation (29) shows that the dominant causes of failuresare as follows:1.2.3.4.5.Design (o1 ) for shaft (c3 ) and vane (c5 ).Maintenance/Fluid (o4 ) for shaft (c3 ), vane (c5 ) and bearing (c7 ).Material/Manufacturing (o2 ) for stator (c4 ), shaft (c3 ).Assembly/Installation (o3 ) for fastener (c12 ).Operation: Overload (o5 ) for housing (c1 ), cover (c2 ), shaft (c3 ), stator (c4 ), vane (c5 ),pin (c10 ), and fastener (c12 ).The matrix LC in Equation (30) indicates that, for given failures, the pump componentend effects are marginal (l3 ) and minor (l4 ).We can use the matrix LC in Equation (31) prioritize causes of failures for given endeffects. For example for end effects: Catastrophic (l1 ) and Critical (l2 ), these causes are asfollows:1.2.3.4.Design (o1 ), Material/Manufacturing (o2 ).Assembly/Installation (o3 ).Operation: Overload (o5 ).Maintenance/Fluid (o4 ).In the similar way, we can obtain causes of failures for end effects marginal (l3 ) andminor (l4 ), which are1.Design (o1 ), Material/Manufacturing (o2 ).
Energies 2021, 14, 174111 of 142.3.4.Maintenance/Fluid (o4 ).Assembly/Installation (o3 ).Operation: Overload (o5 ).Causes of failures for given component functions can be obtained from matrix UO inEquation (31) and they are:1.2.3.4.Design (o1 ), Material/Manufacturing (o2 ).Maintenance/Fluid (o4 ).Assembly/Installation (o3 ).Operation: Overload (o5 ).Matrix UL in Equation (31) indicates that potential failures make end effects marginal(l3 ) and minor (l4 ) for components performing functions (u1 ), (u2 ), and (u3 ), but it hasto be added that the analyzed failures are the primary ones that can be an initiatingfactor for other types of failures. The obtained results from Equation (29) agree with wellknown quality management rules that nearly 80% of failures are caused at the conceptualand design stages. According to the presented method, maintenance/fluid is the majorcause of failures for vane pumps, which is also confirmed in practice [29]. An additionalconfirmation factor is that the vane pumps are used as reference devices for standardizedvalidation tests [43–45] for evaluating the quality of working fluids.The Jaccard similarity index (Table 2) shows the influence of individual failures onfailure modes. For critical failure modes, the dominant failures are brittle fracture ( f 11 ),fatigue fracture ( f 12 ), yielding ( f 21 ), abrasive wear ( f 31 ), adhesive wear ( f 32 ), particles erosion ( f 41 ), cavitation erosion ( f 42 ), and chemical attack ( f 52 ). For major failure modes, thedominant failure are abrasive wear ( f 31 ) and chemical attack ( f 52 ), while for minor failuremodes, the following failures are dominant: yielding ( f 21 ), abrasive wear ( f 31 ), adhesivewear ( f 32 ), particles erosion ( f 41 ), cavitation erosion ( f 42 ), and chemical attack ( f 52 ).The obtained results agree with the empirical data included in [29], which is a compendium of vane pump and motor failures and their causes. The main failures accordingto [29] for pump components that perform main functions (shaft, stator, and rotor) are fatiguerupture (shaft) and brittle rupture (rotor and stator). The Jaccard similarity index (Table 2)indicates the same failures. It has to be mentioned that other failures presented in the tablesuch as abrasive wear, particle erosion, and cavitation erosion can also be initiators of fatiguecrack. The data from the table also agree with the results from UF in Equation (28), whichdefines the failures for components performing main functions. Noisy pump operationaccording to [29] is mainly caused by oil aeration and/or cavitation. This leads to wear ofport plates or vanes. The Jaccard similarity index (Table 2) for failure mode noisy operationshows also abrasive wear as a dominant failure.Table 2. The Jaccard similarity index for test vectors and 000.000.080.000.000.000.080.000.000.084. ConclusionsThe presented method uses the matrix analysis along with elements of statistics thatallows for the classification of potential failures and their causes in relation to the endeffects inducted by the failures and to component functions. It also allows for performingselect elements of RCA analysis. The proposed practical sheet allows for prepa
tional Organization for Standardization (ISO) 9000 series standards and implemented by SAE J1739 [15]. FMEA supplemented with criticality analysis is known as FMECA (Failure Modes Effect and Criticality Analysis). The FMEDA, for which the foundations were defined in