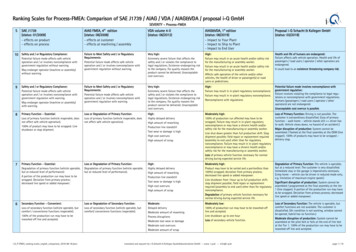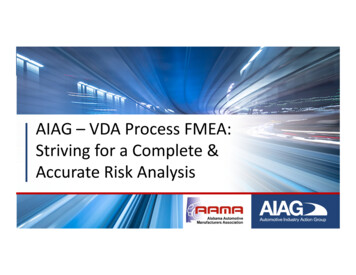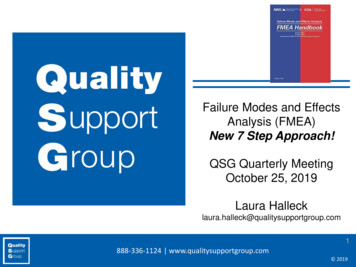
Transcription
FMEA WorkshopUpdate on the AIAG-VDA FMEAHarmonization ProjectSeptember 19, 2017
Format of Today’s Workshop Explanation of the AIAG-VDA FMEA Methodology– Project Overview – Scott Gray - AIAG– The Six Step Process – Jose Avalos – ZF/TRW– New Form Sheet – Rhonda Brender – Nexteer– The S, O, D Rating Tables – Mary Beth Soloy – Ford– Action Prioritization (AP) - Dave Dalby – Honda N.A. Question and Answers – Panel Format2
AIAG-VDA FMEA Project Why Experience with warranty results, field failures, recalls are indicative ofopportunities to improve product and process risk analysis methodologies From the AIAG Current State of Quality survey, the number two industryconcern is Customer Specific Requirements, specifically, the number ofredundant CSR’s WhatA common set of FMEA requirements will enable suppliers to have a singleFMEA business process, and associated methods/tools to produce a robust,accurate, and complete FMEA that would meet the needs of all of theircustomers Develop a single co-copyrighted AIAG - VDA FMEA Manual, that clearlydefines an improved methodology, that is aligned with SAE J1739 Take the best from VDA and AIAG and combine the processes so that theywill meet requirements for both Industry groups
Project Team ObjectiveProvide consistentdirection, guidanceto all automotivesuppliersUpdate to include:- Best Practices- Improved Examples- Functional Safety
AIAG-VDA FMEA Project TeamAIAG Work GroupOEMsFCA US LLC, Ford, GM,Honda N.A., DaimlerTruck NASuppliers Nexteer, Bendix, ONSemiconductor, ZF/TRW5VDA Work GroupDaimler AG, Ford Europe,Volkswagen AG, Adam OpelAGRobert Bosch GmbH,Continental, Schaeffler AG,Knorr-Bremse, ZFFriedrichshafen AG
FMEA Methodology ChangesProject ObjectivesCurrent StatusAlignment of the Severity, Occurrence,and Detection tables between AIAG, VDA,and SAE J1739One set of tables for DFMEA and PFMEAA second set for MSR -Alignment of ProcessA six step processNew form sheetAlignment of key terms and definitionsOne set of terms and definitionsImproved approach for documenting andreducing risksFunction focus4MAP instead of RPNAlignment with ISO26262Definition of “Supplemental FMEA forMonitoring and System Response (MSR)”Ensure the methodology can becompleted using ExcelBeing confirmed through validationtesting6
Development Status Project is currently in the “Build” phase– Although we have pulled some elements from the“validation phase” forward We expect to release a draft manual for AIAGStakeholder Review/VDA Yellowbook in November.– 90 Day commenting period Release of publication targeted for early Q2 2018– Common training is being planned Effectivity will not occur until after the IATF 16949transition deadline of Sept. 14, 20187
FMEA WorkshopUpdate on the AIAG-VDA FMEAHarmonization ProjectSeptember 19, 2017
Six Step ProcessCurrent Situation – There are two manuals with similar approaches for FMEA realization, somecustomers require suppliers to have either the AIAG or VDA FMEA method. The quality of the FMEA analysis is often reported as poor, due to manyfactors such as lack of understanding on the subject, key positions turnoverand so on.New –Six steps, a systematic approach to perform the analysisPurpose: It is recommended that the failure mode and effects analysis tobe carried out in six steps to achieve good quality, reliability,safety in our products and processes. This six steps areapplicable to Design and Process FMEA’s.9
Six Step ProcessOverviewSystem Analysis1st Step Project planAnalysis boundariesLessons learnedBasis for the StructureAnalysis step3rdStepFunction Analysis4 StepFailure AnalysisSystem structure for aproduct or elements of aprocessOverview of the functionalityof the product or processEstablishment of the failurechain (potential FailureEffects, Failure Modes, FailureCauses) for each product orprocess function (step)2 StepStructure AnalysisScope DefinitionProject identificationFailure Analysis and Risk Mitigationnd Visualization of theanalysis scopeIdentification ofinterfaces &interactionsBasis for theFunction Analysisstep Visualization of theanalysis scopeIdentification ofinterfaces &interactionsBasis for the failureanalysis step5th StepRisk Analysisth Visualization of thefailure relationshipsCreation of failurestructuresIdentification ofsources ofvariationsBasis for the recordof failures on theFMEA formAssignment of PreventionControls (existing and/orplanned) to the FailureCauses and Failure Modes Assignment ofprevention / detectioncontrolsRating of severity,occurrence anddetectionCollaboration betweencustomer and supplier(severity)Basis for theoptimization step6th StepOptimizationIdentification of the actionsnecessary to reduce risks Assignment ofresponsibilitiesDocumentation ofactionsImplementation ofactionsConfirmation ofeffectiveness of theactionsContinuousimprovement of theproduct and processBasis to therefinement of controls10
Six Step Process1st Step: Scope Definition Current - Definition of Scope says to consider all the productionprocesses and to select which process or processes to apply FMEAanalysis. New - Consider all processes within the plant that can effect thequality of the shipped product and select which process or processesto apply PFMEA analysis. This opens the door to allow data to drive which process should beanalyzed, i.e. if bad lab testing processes allowed defective productto be shipped, then those process can be analyzed.New Scope Definition Opens The Thought Process To Consider All Plant Processes For Analysis11
Six Step Process1st Step: Scope DefinitionImportant points in the scope steps are:1.- Define what to include and exclude from the FMEA.2.- FMEA project plan, such as important dates, FMEA responsible persons,potential team members, project timelines, etc.3.- Define the boundaries of the analysis.This information gathered should be captured in the FMEA header as a minimum12
Six Step Process1st Step: Scope DefinitionExample of tools used in scoping5T’sFMEA Team– Who needs to be on the team?FMEA Timing– When is this due?FMEA InTent– Why are we here?FMEA Tool– How do we conduct the analysis?FMEA Task– What work needs to be done?5T’s, Boundary block diagram, Process block diagram13
Six Step Process2nd Step: Structure AnalysisThe Structure Analysis transfers the information gathered in thescoping step to visualize the relationships and interactionsbetween the design or process elements.The structure analysis is the basis for the next step 4
Six Step Process2nd Step: Structure AnalysisVisualization of the structure analysisBoundary diagram, Structure trees – Design / Process
Six Step Process3rd Step: Function Analysis In this step the functionality of the product or processes areensured by allocating a description of the activities, purposesor tasks intended for the product performance.SystemVehicle:Safe StoppassengersSubsystemBrake System:Provide VehicleDecelerationProductCaliper:Convert fluidpressure toclamp forceComponentBrake pad:Transferfriction to therotor
Six Step Process3rd Step: Function AnalysisVisualization of the function analysisP-diagram, Function tree, Function Matrix
Six Step Process4th Step: Failure Analysis The failures of the functions are deducted from the functionsalready identified in step # 3. Step # 4 is to identify failure causes, modes, and effects, andshow their relationships to enable risk assessment.SystemVehicle function:Safe Stop passengersFailure of thevehicle function: Unable to safe stoppassengersSubsystemBrake System function:Provide Vehicle DecelerationFailure of the brake systemfunction: Unable to deceleratevehicle Delayed deceleration Rapid decelerationProductCaliper:Convert fluid pressureTo clamp forceFailure of the Caliperfunction: Caliper failed to convertfluid pressure to clampforce Reduced conversion ofpressure to clamp forceComponentBrake pad:Transfer friction to therotorFailure of the brake padfunction: Inner brake pad widthdesigned too thin Excessive frictiontransferred to the rotor
Six Step Process4th Step: Failure AnalysisVisualization of the failure analysisFMEA form , Failure Net
Six Step Process5th Step: Risk AnalysisIn this step prevention and detection controls are assigned,as well as the rankings for severity, occurrence anddetection.A new approach for action prioritization will be introduced.Note: RPN will disappear
Six Step Process6th Step: OptimizationThe primary objective of optimization is to develop actionsthat reduce risk and increase customer satisfaction byimproving the design or process.The FMEA can be used as the basis for continuousimprovement for design or process.
FMEA WorkshopUpdate on the AIAG-VDA FMEAHarmonization ProjectSeptember 19, 2017
Change Points From Current AIAGFMEA TOOL USAGE2017Sample oftools usedfor FMEAduring atrainingclass atAIAG.Recognize, butnot require anycertain softwaresolutionMicrosoft Excel will work – Microsoft Excel will work – Microsoft Excel will work
Change Points From Current AIAGTHE FMEA REPORT VIEWSAMPLE REPORT OF A REPORT GENERATED BY FMEA DATABASE SOFTWARE
Change Points From Current AIAGTHE FMEA SPREADSHEETSAMPLE REPORT OF A SPREADSHEET FILLED IN
Change Points From Current AIAG6-STEP PROCESS AND SPREADSHEET
Change Points From Current AIAGFill-in-the-Blanks MethodFORM FWe often fill out the FMEA from left to right during creation and change of the analysisReturnReturnReturnNew manual & form sheet add structure to help drive team to a more27 complete analysis
Change Points From Current AIAGStep Analysis Method2. STRUCTURE3. FUNCTIONS4. FAILURESNew manual & form sheet add structure to help drive team to a more28 complete analysis
Change Points From Current AIAG How To Complete a FMEA– Current – “Fill in the blanks method” The current manualexplains what each column is for, leaving the team to fill in theblank spreadsheet cells with information. Slower for cross-functional teams due to switching from left brain andright brain thinking– New – “Step analysis method” The new manual explains whateach step is for, allowing the team to take into considerationitems that might not have been considered using the currentform. Faster for cross-functional teams due to focused agenda on one taskwhich may be a left brain (S,O,D) or right brain (Failure Analysis) taskNew manual & form sheet add structure to help drive team to a more complete analysis
Change Points From Current AIAGDFMEACurrent AIAG 4th Ed FMEANew AIAG-VDA FMEA
Change Points From Current AIAGPFMEACurrent AIAG 4th Ed FMEANew AIAG-VDA FMEANew!
Change Points From Current AIAGDFMEACurrent AIAG 4th Ed FMEANew AIAG-VDA FMEA
Change Points From Current AIAGPFMEACurrent AIAG 4th Ed FMEANew AIAG-VDA FMEAFunctions are Positive!1–2–3
Change Points From Current AIAGDFMEA and PFMEACurrent AIAG 4th Ed FMEANew AIAG-VDA FMEAThe Failure ChainFailures are Negative!1–2–3
Change Points From Current AIAGDFMEACurrent AIAG 4th Ed FMEANew AIAG-VDA FMEANew!
Change Points From Current AIAGPFMEACurrent AIAG 4th Ed FMEANew AIAG-VDA FMEANew!
Change Points From Current AIAGDFMEA and PFMEACurrent AIAG 4th Ed FMEANew AIAG-VDA FMEANew!
Section Summary Multiple software tools can be used including MS ExcelThe handbook will include Report and Spreadsheet viewsStep Analysis replaces the Fill-in-the-Blank methodStructure, Function, and Failure Analysis sections promoteknowledge within and between the sectionsNew! Failure Chain supports the cause and effect hierarchyNew! PFMEA 4M LabelsNew! DFMEA & PFMEA Action StatusNew! Action Priority (AP)38
FMEA WorkshopUpdate on the AIAG-VDA FMEAHarmonization ProjectSeptember 19, 2017
Rating TablesProject Objective: Alignment of the Severity,Occurrence, and Detection tables betweenAIAG, VDA, and SAEJ1739Each failure mode, cause and effect relationship(failure chain or net) is assessed for itsindependent risk40
Rating Tables Evaluation numbers from 1 to 10 continue tobe used for S, O, and D respectively 10 stands for the highest risk contribution By examining these ratings individually and incombinations of the three factors the need forrisk-reducing actions may be prioritized asHigh, Medium or Low41
Rating Tables - SeverityThe Severity rating (S) is a measureassociated with the most seriousfailure effect for a given failure modeof the function being evaluated. Therating shall be used to identifypriorities relative to the scope of anindividual FMEA and is determinedwithout regard for occurrence ordetection.42
Change Points From Current AIAGDFMEA SeveritySEVSeverity criteria10Affects safe operation of the vehicle and/or other vehicles, the health ofoperator or passenger(s) or road users or pedestrians.9Noncompliance with regulations.8Loss of essential vehicle function necessary for normal driving during expectedservice life.Degradation of essential vehicle function necessary for normal driving duringexpected service life.76Loss of convenience function.5Degradation of convenience function.4Perceived quality of appearance, sound or haptics unacceptable to mostcustomersPerceived quality of appearance, sound or haptics unacceptable to manycustomersPerceived quality of appearance, sound or haptics unacceptable to somecustomersNo discernible effect.321Corporate or Product Line ExamplesThe table may beaugmented to includeproduct specificexamples.Safety is 10 regardless of warningSplit Rating Of 10 And 9 Allowing For Alignment With Functional Safety Groups
Change Points From Current AIAGPFMEA SeverityManufacturing Effect Divided Into Two Columns. Rank 10 – Safety Rank 9 - Regulations
Rating Tables - OccurrenceDFMEA OccurrenceThe Occurrence rating (O) is ameasure of the likelihood ofoccurrence of the cause, whichresults in the failure mode during thedesign life of the item, taking intoaccount the associated preventioncontrols.Occurrence Of Cause For DFMEA Based On Incidents Per Items/Vehicles
Change Points From Current AIAGDFMEA OccurrenceOCCProduct Design NewnessPrevention Controls - ProceduralNovelty of Design, Application or Use CaseBest Practices, Design rules, CompanyStandards, Lessons Learned, IndustryStandards, Material Specifications,Government RegulationsExpected Failure Occurrence(Design Newness and PreventionControls Best Fit)Prevention Controls - AnalyticalOccurrence criteria for potentialEffectiveness of Prevention orientedFailure Causes resulting in the Failureanalytical tools including ComputerMode, considering PreventionAided Engineering, Math Modelling,Controls, rated for the intendedSimulation Studies, and Toleranceservice life of the itemStacks(Qualitative rating)Not able to predict field performance.Occurrence during intended service lifecannot be determined at this time, nopreventive controls, or occurrenceduring intended service life is extremelyhigh.Not targeted to identify performance to Very high occurrence during intendedspecific requirements.service life.10First application of new technology anywhere without operatingexperience and / or under uncontrolled operating conditions. UseCase or operating conditions vary widely and cannot be reliablypredicted.Standards do not exist and best practiceshave not yet been determined.9First use of design with technical innovations or materials withinthe company. New use case, or change in duty cycle / operatingconditions. Not previously validated.Newly developed for this design. Firstapplication of new standards with noexperience.Almost identical mature design with long term field exposure.Same application, with comparable duty cycle and operatingconditions. Testing or field experience under comparable operatingconditions.Design expected to conform to Standards Capable of finding deficiencies in theand Best Practices, considering Lessonssystem/ component related to theLearned from previous designs, withfailure.significant margin of confidence.Indicates confidence in designconformance.Design proven to conform to StandardsCapable of ensuring with highand Best Practices, considering Lessonsconfidence, that the failure can notLearned, which effectively prevents theoccur.failure from occurring.87654321Known system/ component with identical mature design. Sameapplication, duty cycle, and operating conditions. Testing or fieldexperience under comparable operating conditions, orMature system/ components with long, failure-free seriesproduction experience under comparable operating conditions.Corporate orProduct LineExamplesVery low occurrence during intendedservice life.Possibility of failure is virtuallyeliminated through preventative controland history of failure-free seriesproduction.Note: A 10, 9, 8, 7 can drop to a 5 or 3 after testing.Added Emphasis On Prevention Controls As Input To The Occurrence Rating
Change Points From Current AIAGPFMEA OccurrenceOccurrence Based On Process Maturity, Controls With A Summary
Change Points From Current AIAGDFMEA DetectionThe Detection rating (D) is a measureof the effectiveness of the detectioncontrol to reliably demonstrate thefailure cause or failure mode beforethe item is released for production.The detection rating is the ratingassociated with the most effectivedetection control.Likelihood Of Detection Descriptions May Lead To Mixed Interpretation
Change Points From Current AIAGDFMEA DetectionDetection Controls rated according to the best fit for each detection activity performed prior todelivery of the design for productionDETDetection Capability10DETECTION CAPABILITY: No test or test procedure not capable of detecting failureprior to delivery of design for production.9DETECTION CAPABILITY: General test procedure not designed to specifically detectthe cause and/or failure mode.8DETECTION CAPABILITY: Procedure is uncertain and/or there is limited experiencewith the new procedure.TIMING: Post technical release and prior to production launch.7DETECTION CAPABILITY: Procedure is uncertain and/or there is limited experiencewith the modified procedure.TIMING: Post technical release and prior to production launch.6DETECTION CAPABILITY: Proven product design and development verificationprocedure with new usage profile.TIMING: Post technical release and prior to production launch.5DETECTION CAPABILITY: Proven product design and development verificationprocedure with same usage profile as previous product.TIMING: Post technical release and prior to production launch.4DETECTION CAPABILITY: Proven product design and development verificationprocedure with new usage profile.TIMING: Prior to technical release.3DETECTION CAPABILITY: Proven product design and development verificationprocedure with same usage profile as previous product.TIMING: Prior to technical release.2DETECTION CAPABILITY: Detection of Causes (including Noise Factors) with physicaltesting with high confidence.TIMING: Prior to technical release.1Design proven to conform to Standards and Best Practices, considering LessonsLearned, which effectively prevents the failure from occurring.Blank until filled in by userCorporate or Product LineExamplesConsiders Capability To Detect And Timing
Change Points From Current AIAGPFMEA DetectionDetection By Type & Detection Capability
FMEA WorkshopUpdate on the AIAG-VDA FMEAHarmonization ProjectSeptember 19, 2017
Change Points From Current AIAGAP Table - Determining Action PrioritiesCurrent Situation – The manual acknowledges that with limitations of resources, amethod to prioritize must be established. The manual offers logic on how to prioritize actions:* Review high Severity Ranks items first.* Make use of RPN, without setting thresholds.* Recognize that a higher RPN number may not be point to thecorrect item for the team to work on next.* An example of logic showing how a RPN of 90 should be prioritizedover a RPN of 112.The actual logic to drive prioritization is left to each company and is not on the form.
Change Points From Current AIAGDetermining Action PrioritiesCurrent Situation – Upside –* Manual explains how logic should dictate prioritize of actions usinga combination of Severity, Occurrence, Detection Ranks and RPN. Downside –* When is use, the spreadsheet itself, only shows the Rank Numbersand the final RPN. The direction of logic, is back in the manual.* Unless a company establishes its own procedure to give the team amethod of prioritization, the highest RPN can be the easiest methodfor the team to fall back on.The actual logic to drive prioritization is left to each company and is not on the form.
Change Points From Current AIAGNew – Action Priority (AP)Action Priority – A table was built, that is logic based. The logic takes into consideration the level of Severity, the amount ofOccurrence and the Detection Controls being used. All of these items are what the current manual advises to beconsidered when prioritizing actions. To make the table manageable, the table groups together categoriesof S, O, and D, such as, Severity 9 / 10, Detection 2 4, etc. The combination of each group is assigned a High, Medium, and Lowprioritization. The table covers the 1000 possible combinations. The logic or justification is listed on the table for each H, M & L.Action Priority Table is logic based and the results can be seen on the form
Change Points From Current AIAGNew – Action Priority (AP)Severity then Occurrence then Detection followed by AP10 (Sev) x 4 (Occ) x 2 (Det) 80 RPN3 (Sev) x 8 (Occ) x 5 (Det) 120 RPNAction Priority shows the breakdown of S, O & D, the results and explains the logic
Change Points From Current AIAGAction Priority – Upside to New AP Table* The logic that is recommended in the manual is built into the table.* As the users use the spreadsheet or software in front of them,logic based prioritization drives the High, Medium or Low.Manual logic applied to the Table and shows the results to the users.
FMEA WorkshopUpdate on the AIAG-VDA FMEAHarmonization ProjectSeptember 19, 2017
Questions and Answers Explanation of the AIAG-VDA FMEA Methodology– Project Overview – Scott Gray– The Six Step Process – Jose Avalos– New Form Sheet – Rhonda Brender– The S, O, D Rating Tables – Mary Beth Soloy– Action Prioritization (AP) - Dave Dalby Question and Answers – Panel Format58
FMEA WorkshopUpdate on the AIAG-VDA FMEAHarmonization ProjectSeptember 19, 2017
Sep 19, 2017 · There are two manuals with similar approaches for FMEA realization, some customers require suppliers to have either the AIAG or VDA FMEA method. The quality of the FMEA analysis is often reported as poor, due to many factors such as lack of unders
