Transcription
Proceedings of Informing Science & IT Education Conference (InSITE) 2012Data Sources for Scholarly Research:Towards a Guide for Novice ResearchersTimothy J. Ellis and Yair LevyNova Southeastern UniversityGraduate School of Computer and Information SciencesFort Lauderdale, FL, USAellist@nova.edu, levyy@nova.eduAbstractOne of the biggest challenges the novice researcher faces is determining just where and how tostart her or his research. During the research design stage, a novice researcher must take into consideration three key factors: a) literature; b) research-worthy problem; and c) data. While the roleof the problem and literature in research has been explored previously, inadequate attention hasbeen given to the centrality of data and access to collecting data in the context of research design.This paper explores data as a vital element of scholarly enquiry by outlining the role of data inresearch in the informing sciences, identifying some issues with access to data collection, andtheir impact on the design of a proposed research. This paper explores the categories of data, organized in a 2x2 taxonomy: the Qualitative-Quantitative-Indirect-Direct (Q2ID) Taxonomy ofData Sources. This paper concludes with examples from literature for some research studies andexplanations for the types of data used in the context of the proposed Q2ID Taxonomy of DataSources are provided.Keywords: Data Sources, Data Categorization, Qualitative vs. Quantitative Data, Categories ofData, Data as a Research Element, Access to Data Collection, Data Source Taxonomy, Types ofData, Data MeasuresIntroductionOne of the biggest challenges the novice researcher faces is determining just where and how tostart her or his research (Zikmund, Babin, Carr, & Griffin, 2010). Since the essence of research ismaking a contribution to the body of knowledge, the literature is certainly an excellent startingpoint (Levy & Ellis, 2006). One cannot make a contribution to the body of knowledge withoutbeing familiar with that body of knowledge first. Research must also be motivated by some reason beyond the obvious ones associated with meeting the requirements for degree completion,tenure, or promotion; the problem motivating the research is likewise a viable starting point (Ellis& Levy, 2008). A third, highly pragMaterial published as part of this publication, either on-line ormatic factor must also be considered is:in print, is copyrighted by the Informing Science Institute.thedata available to support the researchPermission to make digital or paper copy of part or all of theseor,moreprecisely, the researcher’s acworks for personal or classroom use is granted without feecess and ability to collect data (Leedy &provided that the copies are not made or distributed for profitor commercial advantage AND that copies 1) bear this noticeOrmrod, 2010). The most promisingin full and 2) give the full citation on the first page. It is perresearch-worthy problem, indisputablymissible to abstract these works so long as credit is given. Tosupported by the literature cannot leadcopy in all other cases or to republish or to post on a server orto scholarly enquiry if the researcherto redistribute to lists requires specific permission and paymentof a fee. Contact Publisher@InformingScience.org to requestdoes not have access to the data necesredistribution permission.sary to conduct that research. All three
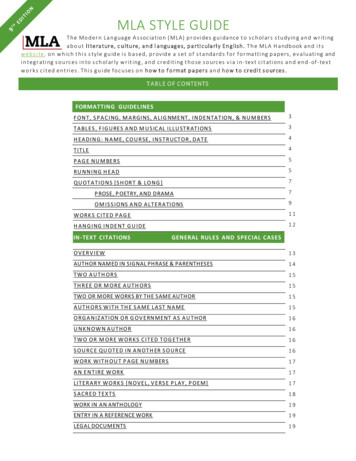
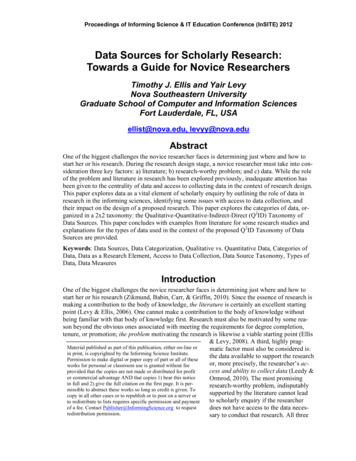
Distributed Collaborative Learningfactors – literature, research-worthy problem, and access to data – must be taken into consideration by the novice researcher early in the design stage of her or his study.The role of the research-worthy problem and literature in research have been explored previously(Ellis & Levy, 2008; Levy & Ellis, 2006). This paper explores the third piece, data, as a vitalcomponent of scholarly enquiry. The target audience for this paper is the novice researcher, suchas doctoral students or junior faculty members. In the balance of this introduction, context will beestablished by briefly exploring two essential factors: the nature of research in the informing sciences, and data as an element of research. The second section of the paper expands the definitionof data by exploring the different categories of research data. The third section explores potentialsources for the different categories of data identified in section two by identifying examples fromthe literature of the different data sources. Finally, a summary and recommendations are provided.Research in the Informing SciencesIn his seminal work, Cohen (1999) claimed that informing science is a field of inquiry on theprocess and infrastructure of “providing a client with information in a form, format, and schedulethat maximizes its effectiveness” (p. 215). He outlined three interrelated components of the field:a) the client, b) the delivery system, and c) informing environment. Since informing sciencerepresents the nexus of technology, processes, and people, research in that discipline is certainlynot monolithic in nature (Gill & Bhattacherjee, 2009). Published enquiries have been conductedfrom a number of different philosophical perspectives on the meaning and meaningfulness of theresults of research. The three most universally accepted perspectives are the positivist, the interpretive, and critical research (Kim, 2003). The positivist epistemology, for example, being basedon the assumption “that physical and social reality is independent of those who observe it, andthat observations of this reality, if unbiased, constitute scientific knowledge” (Gall, Gall, & Borg,2003, p. 14), asserts that objective “truth” can be derived through research. The interpretive perspective, on the other hand, is based on the “assumption that access to reality (given or sociallyconstructed) is only through social constructions such as language” (Myers, 1997, p. 241), assertsthat reality can be best understood in the context of the meanings assigned by people. A third perspective, critical research, “focuses on the oppositions, conflicts and contradictions in contemporary society, and seeks to be emancipatory i.e. it should help to eliminate the causes of alienationand domination” (Myers, 1997, p. 242).Regardless of the philosophical perspective underlying the research, all scholarly enquiry hasthree elements: the applicable, scholarly literature; a research-worthy problem; and data(Creswell, 2005; Leedy & Ormrod, 2010). As detailed in Figure 1, the literature serves as thefoundation for research. Research worthy problems are identified and supported through thescholarly literature, and the applicability and validity of the data is established through the literature. The research worthy problem motivates and justifies the research by answering the question“Why is the study being conducted” (Ellis & Levy, 2008). The data serves the dual function oflimiting and enabling the research (Zikmund et al., 2010). The type of study possible is both indicated and restricted by the data available to the researcher. Data obviously serves a central function in research. However, just what constitutes data is less obvious. The text below will attemptto address that question.406
Ellis & LevyFigure 1: The Role of Data in the Structure of ResearchData as an Element of ResearchThe manner in which “data” is defined is of critical importance (Mertler & Vannatta, 2010). According to Leedy and Ormrod (2010), “the term data is plural (singular is datum) and derivedfrom the past participle of the Latin verb dare, which means “to give” (p. 94). Too narrow a definition, such as restricting data to only those things that can be measured with numerical precision,can restrict the meaning of research in informing science to such an extent that few, if any, outside academe would find the results of value. On the other hand, too broad a definition, such asincluding in “data” anything that one purports to observe, could expand the meaning of researchto such an extent that any assertion one makes could be categorized “research”. A well-formeddefinition of data is essential to a meaningful understanding of research.Although the importance of data to research is well accepted, there is not a universally accepteddefinition of data. Many resources that detail research methods devote chapters on how to acquireand analyze data without ever describing and delimiting the term (Gall et al., 2003; Richey &Klein, 2007; Sekaran, 2003). When the term has been defined, a number of approaches have beenfollowed. Gay, Mill, and Airaisian (2006) adopted an operational approach to the definition byindicating: “Data are the pieces of information you collect and use to examine your topic, hypotheses, or observations” (p. 122). Leedy and Ormrod (2010), on the other hand, defined datafrom a more functional approach: “Data are those pieces of information that any particular situation gives to an observer” (p. 94). Zikmund et al. (2010) defined data as “facts or recorded measures of certain phenomena (things or events)” (p. 19). The classical database definition for data,reiterated by Elmasri and Navathe (2011) is data are “known facts that can be recorded and thathave implicit meaning” (p. 4), implying a descriptive approach. Although all of these definitionsoffer insight to the meaning of data in a scholarly enquiry environment, none seem to adequatelycapture the role of data in research. Thus, in this paper, data will be defined as a purposive collection of perceived facts. Obviously, that definition needs some refinement. Toward that end, theexpression is deconstructed as follows:407
Distributed Collaborative LearningPurposive: All that can be observed or otherwise sensed is not necessarily “data”. An observationor other sensation is data only within the context of its use. For example, an observation of ethnicity was “data” in the United States during the 1950s in the context of eliminating certain racialgroups from employment opportunities. In the 1970s that same observation was “data” in theUnited States in the context of providing favored employment consideration to those same racialgroups. In scholarly research, the literature is the primary resource for attributing the context necessary to change observations and sensations to data.Collection: Despite common usage to the contrary, grammatically, the word “data” is plural, notsingular. That distinction is not of only grammatical importance, however. A single observation,no matter how purposive and contextualized, does not constitute data. Data must be comprised ofa set of related observations. Trying to draw conclusions from a single observation would beanalogous to draw a line with only a single known point.Perceived facts: It is important to remember that data is not equal to facts or, by extension,“truth”. The accuracy of data can be negatively impacted by collection errors such as trying todetermine the average height of the residents of a city by measuring the first 20 people you seeleaving a grade school building. The accuracy of the data can also be negatively impacted bymeasurement errors such as using the wrong instrument to measure an observation (i.e. using anIQ test to measure academic achievement) or using the correct instrument incorrectly. Of greaterimpact than either collection or measurement errors, however, is the fact that data are based on anobservation of phenomena, not the phenomena themselves. Data can point toward reality, butshould never be confused with reality. A simple example to illustrate this point can be a measureof body weight. Although one might think that the numerical value displayed by the scale is theabsolute “truth”, although that value might be close to the “truth”, it can never be regarded assuch. Instrument errors (i.e. lack of calibration) and instrument rounding (i.e. a weight that canprovide numerical data to the ½ of pound, another to the 1/10 of a pound, another to the 1/100 ofa pound) preclude observation of the “truth”.Access to Data CollectionA research study, as previously indicated, is based on data that the researcher sets forth in order toprovide evidence supporting the conclusions of the study (Zikmund et al., 2010). While there aretheoretical and anecdotal scholarly literature pieces, research, by definition, is unique in that it isan endeavor that must use data in order to provide evidence to the theoretical (Ellis & Levy,2008). One of the great challenges for many researchers in the design stage of their study is tosecure access to data (Zikmund et al., 2010). In this paper, access to data collection is defined asthe ability of the researcher to secure ways to obtain data for the purpose of his or her proposedstudy. Such access is a requirement that all novice researchers must consider as early in their research design as possible (Ellis & Levy, 2008), and will impact the type of study proposed (Ellis& Levy, 2009). Although in some research institutions or other unique contexts the novice researcher might be given access to data, not all are so fortunate.Access to a solid source of the data necessary to conduct the proposed research is a major challenge facing the novice researcher. A common example of a case where access to data is not viably solid may include a proposal where the novice researcher wishes to investigate the role ofInformation Technology (IT) investments in organizations and how they relate to security breachincidents within that organization. The novice researcher’s proposed approach of access to datawas by using mail (electronic & regular) to send a survey to all Chief Information Officers (CIOs)of Fortune 500 companies. While the intent of the research might have been interesting, accessto the necessary data is not viably solid in this case as the possibility of receiving a meaningfulnumber of participants in such proposed data collection is slim. Certainly, such access to datamight have been considered viable if the novice researcher had the personal ability to ask For-408
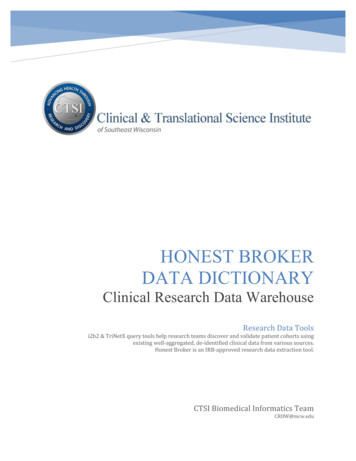
Ellis & Levytune 500 companies’ CIOs to take part in the research on the basis of being an executive in acompany that provides information security (InfoSec) consulting to a large number of the Fortune 500 companies.Categories of DataData can, of course, be categorized in a number of ways. Two dimensions for categorizing data –proximity and precision – are particularly useful in the context of scholarly research. For the purposes of this paper, proximity is defined as the degree of separation between the actual phenomena of interest and the method in which it is observed and measured. Precision, again in this paper, refers to the degree to which the value of the data can be objectively represented. Both proximity and precision can be subdivided into two levels: for proximity, direct and indirect measures;for precision, qualitative and quantitative data. Since data have both proximity and precisioncharacteristics, there are four subcategories of data. Figure 2 provides an overview of the 2x2Qualitative-Quantitative-Indirect-Direct (Q2ID) Taxonomy of Data Sources. The four proposedsubcategories include: a) direct measure for qualitative data (DiQual); b) direct measure for quantitative data (DiQuant); c) indirect measure for qualitative data (InQual); and d) indirect measurefor quantitative data (InQuant). While these are the four main subcategories of measuring data, aresearch study is often made more rigorous when the two categories of precision of data, qualitative and quantitative, are both included in a ‘mixed methods’ study.Figure 2: The Q2ID Taxonomy of Data SourcesProximity: Direct vs. Indirect DataDirect data are derived from direct observations of the phenomena of interest. Indirect data arederived from indirect observations; observations of representations of the phenomena rather thatthe phenomena itself. Both direct and indirect data are of great value to research in informationsystems and informing science. Some examples include: In human-computer interaction research, the cognitive walkthrough would produce directdata while the heuristic evaluation produce indirect data.In end-user computing skills research, logs of actual system use would produce directdata while a survey based on the perceived skills, produces indirect data.409
Distributed Collaborative Learning In education research, direct observation of a student’s performance in multiple settingsover time would produce direct data while a standardized test produce indirect data.It is important to note that both direct and indirect data present benefits and challenges (Hair,Black, Babin, & Anderson, 2010). Direct data, being based on direct observation of the phenomena of interest, are often richer and accurately describes the phenomena than indirect data. Directdata often have a much greater degree of internal validity than indirect data. On the other hand,direct data are often much more difficult to collect than indirect data and more subject to the skillof the one collecting the data. Furthermore, the very richness of the data makes direct data morerelated to a specific instance of phenomena than indirect data. Direct data, as a result, often have asmaller degree of external validity (generalizability) and reliability than indirect data.To illustrate the strengths and weakness of direct versus indirect data, consider the task of measuring human intelligence. One way to determine just how intelligent someone is would be to observe that individual in a number of different situations over an extended period of time – togather direct data. Those data would be very rich and representative of the individual’s capabilities – they would be internally valid. The data would, however, be very dependent on the interpretation the observer. Since two different observers, or even the same observer at different times,might view the same activity of the subject in entirely different ways, those data might not be reliable. On the other hand, one could use a standardized measure of intelligence such as theWechsler Intelligence Scale. The questions regarding the “fairness” and capacity of such instruments to actually measure human intelligence are well documented in both the scholarly andpopular literature – the internal validity of the data so derived would not be as strong as that derived from extensive close observation over time. Since, however, administration of the instrument is standardized and well documented, it is quite probable that essentially the same resultswould be derived regardless of who administered the test (providing, of course that the documented procedures are followed). The data derived from the standardized test would likely bemore reliable than that derived from observation over time.The discussion of direct versus indirect data should not, however, be in terms of which are thebetter data for research. If a researcher has access to both direct and indirect data, the strength ofthe study would be increased significantly if both were included. In many instances, the researcher will have access to only direct data or only indirect data. It is important in those circumstances to recognize the limitations inherent in whichever form of data is available for the research.Precision: Quantitative vs. Qualitative DataThe term “precision” is perhaps misleading in drawing the distinction between quantitative andqualitative data. As mentioned above, “precision” is used in this context to indicate the degree towhich the data can be objectively represented, not the accuracy, validity, or usefulness of thedata. Simply put, quantitative data are expressed in terms of numbers while qualitative data areexpressed in terms of words (Sekaran, 2003). Although quantitative data are considered sometimes to be more precise, they are not necessarily more meaningful than qualitative data, depending on the goals of the proposed study. For example, if one were to ask ‘How big is an aircraftcarrier?’, the answer using quantitative data would be “1088 feet” while the answer using qualitative data would be “More than three and a half football fields”; the more useful answer would bedependent on the context.Quantitative data, as the name implies, are numerical in nature and, depending on the type ofdata, can be analyzed with various mathematical and statistical procedures. There are four typesof quantitative data. Since each level permits a different range of statistical tests, it is imperativeto correctly identify the type of quantitative data available. The Academic Technology Services410
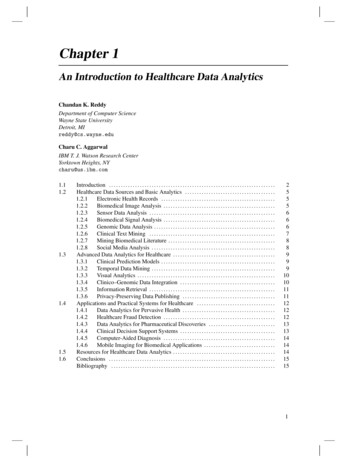
Ellis & Levydepartment at the University of California Los Angeles provides an overviewof the statistical analyses appropriate foreach level of quantitative data. Thatoverview is summarized in Table 1 andcan be viewed in its entirety athttp://www.ats.ucla.edu/stat/mult pkg/whatstat/ .Table 1: Examples of statistical tests by data typeType of DataStatistical TestsNominalChi-Square (χ2)McNemar testOrdinal RegressionSpearman’s rhoMann-Whitney U TestWilcoxon TPath AnalysisFactor Analysist-TestANOVAPearson’s rBeta (β) correlationMultiple RegressionOrdinalNominal data, also known as categoricaldata, classifies the phenomena observedinto two or more groupings (Gay, Mills,Interval and Ratio& Airasian, 2006). Nominal data can becounted, but cannot be further analyzedmathematically or statistically. For example, if one were conducting researchin e-commerce and gathered the state ofresidence for each participant in thestudy, one could count the number fromMassachusetts and from Florida, determine which number was larger, and otherwise describe thedata but could make no inferences regarding the significance of those differences. Other examplesof nominal data could include gender (i.e. Male/Female), ethnic background (i.e. ), and job level (i.e. er).Ordinal data classifies the instances of the phenomena being observed into rank order. The Fortune 500 ranking of a company is an example of ordinal data. Ordinal data can tell the observerthat one instance of a phenomenon is in some aspect greater than another instance of that phenomenon, but it cannot tell you in any meaningful sense just how great that difference is. For example, the difference between the number one and number two companies in the Fortune 500might or might not be equal to the difference between the number two and number three companies. The data produced from the Likert-type scale is a commonly seen example of ordinal dataused in scholarly research (Jamison, 2004). Although numbers are often associated with the various values used on the classical Likert-type scale such as “Strongly Agree”, and “Agree”, Jamison (2004) indicated that “it is ‘illegitimate’ to infer that the intensity of feeling between ‘stronglydisagree’ and ‘disagree’ is equivalent to the intensity of feeling between other consecutive categories on the Likert scale” (p. 1217).Interval data is similar to ordinal data in that the numbers represent meaningful points of comparison. However unlike ordinal data, the difference between values in interval data also is meaningful. As mentioned above, the difference between a value of one and two is not necessarily thesame as the difference between a value of two and three with ordinal data; with interval data,those differences are assumed equal. An example of interval data in scholarly research would bescores on an intelligence test; the difference between the score of 90 and the score of 100 represents the same value as the difference between the score of 100 and 110.Ratio data has the same characteristics as interval data, with one important addition; unlike interval data, ratio data has a true zero. In the example of the intelligence test scores mentioned above,there is not a true zero in that a score of zero on the test does not mean that there is a completeabsence of intelligence. With ratio data, on the other hand, a score of zero indicates the completeabsence of the phenomenon being observed. Examples of ratio data used in scholarly researchinclude counts of the number of click-through on an e-commerce site or number of times aknowledge base has been accessed.411
Distributed Collaborative LearningQuantitative data can be distinguished along a second dimension: discrete versus continuous data(Leedy & Ormrod, 2010). Discrete data “has a small and finite number of possible values” (p.261), whereas continuous data “reflects an infinite number of possible values falling along a particular continuum” (p. 261). An example of discrete data would be number of children. Althoughthere is no theoretical limit to that value, there is a practical limit and there certainly is the limitation to whole numbers. An example of continuous data would be amount of time to access a Website; there would not be either a theoretical or practical limit to the range of values, and fractionalvalues with infinite precision would certainly be possible. All four levels of data – nominal, ordinal, interval, and ratio – can be either continuous or discrete (Creswell, 2005).Qualitative data are narrative in format and, consequently, inherently subjective in nature. Thepurpose of qualitative data is to describe, not measure, the phenomenon of interest (Gay et al.,2006; Sekaran, 2003). Unlike quantitative data that has an objective meaning, the meaning ofqualitative data cannot be divorced from the context in which it is collected. Included in that context are the researcher as well as his or her background, perspectives, capabilities, and personalbiases.Since qualitative data are not numeric, statistical tests are of no use in interpretation. The basicprocess of the analysis of qualitative data is one of organizing and categorizing, identifying patterns and synthesizing to create a narrative that describes the phenomenon of interest. Specificprocesses for analyzing and interpreting qualitative extend beyond the scope of this article; thereare a number of texts that detail processes for working with qualitative data (Gay et al., 2006;Miles & Huberman, 1984). Computerized tools to preform qualitative data analysis, such as Atlas.ti (http://www.atlasti.com/), MAXQDA (http://www.maxqda.com/), or Ethnograph (http://www.qualisresearch.com/), are available, but their use lies beyond the scope of this article.Examples of Data Sources from LiteratureThe scholarly literature includes numerous examples of research that utilized the various subcategories of data sources discussed previously. In this section, a few selected studies are provided toillustrate how data sources shaped the research study, the goals of the research, and how the specific subcategory of data source (or mixture of data sources) enabled the researchers to achievethose research goals. Please note these studies are provided to illustrate the data subcategories inthe Q2ID Taxonomy of Data Sources described above and should not be considered as the modelstudies in each subcategory.QuantitativeExample of direct-quantitative (DiQant) measureOne common approach to collecting direct-quantitative data is with the use of quantitative surveys on direct measures. One of many examples for this direct-quantitative data collection isdocumented in the study by Gafni and Geri (2010) who measured the role of mandatory versusvoluntary tasks and gender differences in task procrastination. As part of their study, they collected the actual submission data extracted from the submission system including the dates ofsubmission and proximity to the deadline. Their directly measured data was based on two groups:a) participants who voluntary submitted their files, while not being required; versus b) participants who were required to submit their files to the system. Their findings indicate that in general,when the task is non-required, participants tend to procrastinate significantly more than when it’srequired. They found no gender differences on procrastination in their data.412
Ellis & LevyExample of indirect-quantitative (InQuant) measureSome studies that collected quantitative data may mix direct and indirect measures under a singlestudy. As such, although Koh, Prybutok, Ryan, and Wu (2010) assessed directly via survey from330 end-users’ perceived information quality, information satisfaction, attitude, intention to use asystem, some of the other measures used were measured indirectly on a quantitative data. Specifically, they measured the constructs of performance expectancy (i.e. the degree that a system canhelp the user to accomplish tasks), social influence (i.e. the degree of other people’s influence touse the system), and net benefit (i.e. the degree that the system provides positive benefit to theorganization).QualitativeExamples of direct-qualitative (DiQual) measureSome phenomena related to a viable research problem identified may not lend itself to measuresthat are numerical in nature (i.e. quantitative). As such, the use of qualitative measures can provide insight. An example of direct-qualitative measure is documented by Gefen, Ragowsky,Licker, and Stern (2011), who interviewed Chief Information Officers (CIOs) about issues thatbother them and how they address these issues. A roundtable approach was taken to perform discussions on the issue of outsourcing challenges and how the CIOs address these challenges. Thediscussions were video recorded and transcribed. While the issues discussed among the CIOswere on the nature of outsourcing, specific data were collected by the researchers on the penetration of outsourced IT services the participating organizations had, compared to the in-house ITservices. Moreover, they collected data on the challenges encountered as a result of outsourcingand ways to address such challenges were discussed. The changes that occurred over the past fewyears as a result of such challenges were also
This paper explores data as a vital element of scholarly enquiry by outlining the role of data in research in the informing sciences, identifying some issues with access to data collection, and . represents the nexus of technology, processes, and people, research in that discipline is certainly not monolithic in nature (Gill & Bhattacherjee .