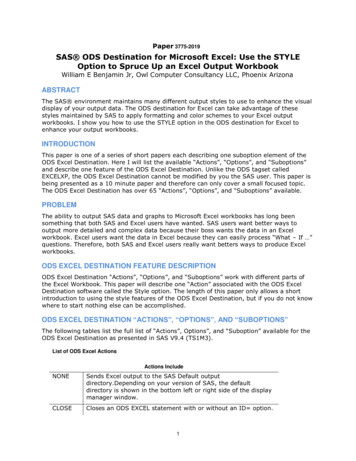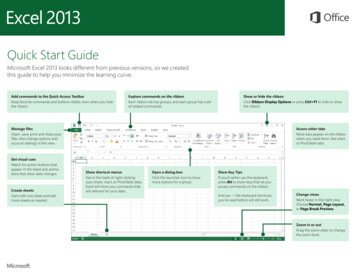
Transcription
It’s all aboutAnalytics!Advanced Analytics using ExcelIBF Accredited CourseSkillsFuture ClaimableThis course is designed for learners who wish to designstoryboards and data displays to communicate key insights,trends and findings derived from data, incorporating new andadvanced visualization techniques and messaging aligned tobusiness needs and audience.Course Fee (Before Funding): 750 (excl. GST)Course Fee (After Funding): 80.25 - 277.50 (incl. GST)Start your data journey with us.
Course Duration16 hoursWhat You’ll LearnThis course provides participants with the knowledge and skillsto work with raw data, perform data wrangling, build datamodels and analyze data with business cases using MicrosoftExcel. Participants will learn to use Excel gather data, shapethe data, use data models and create interactive reports.Through this course, participants can learn that Excel is apowerful tool as well and can help centralize, simplify, andstreamline data tasks efficiently at a small scale.Learn Excel functions, data aggregation, pivot tables, and otheradvanced analytics features that Excel has to offer!Pre-requisitesWorkplace Literacy (Advanced Literacy) Level 4-5Basic English LiteracyBasic knowledge of Excel would be beneficial
Key-Takeaways!After going through the course, participants will: Be able to work with and shape data on Excel Be able to understand why Excel Functions are powerful Be able to control the transformation of data Be able to summarize and aggregate data efficiently Be able to have a grasp over data analytics Be able to build interactive reports for analysis Experience varying business cases from differentperspectives
Course OutlineWORKING WITH FUNCTIONSLogical and Aggregation Functions in ExcelIn this module the learners will learn about various data transformation functions and will be ableto apply the relevant function based on their use case with their own data. Logical functions: SUMIF, AVERAGEIF, IFS, and others Aggregation functions: SUM, AVERAGE, AGGREGATE, and others Additional functions for data transformationReferencing - Lookup & Handling ErrorsIn this module the learners will learn about various lookup functions as well as on how to handleerrors. VLOOKUP HLOOKUP IFERRORAdvanced Lookup FunctionsIn this module the learners will learn XLOOKUP, FUZZY LOOKUP, partial lookup using wildcardsas well as lookup using INDEX and MATCH. The learners will be able to understand the usage ofthe various lookup functions and its applications.Date FunctionsIn this module the learners will get comfortable with different date functions likeNETWORKDAY.INTL, WORKDAY.INTL and how to handle data related to the calendar.Working with TextIn this module the learners will learn to apply different text functions for data transformation. Split columns with delimiters Text functions: TEXTJOIN, CONCAT and others
Subtotal and GroupingThis module will allow the learners to learn powerful features to summarize and organize the datafor analysis.ANALYZING DATA WITH EXCELPivot TablesBy the end of this module, the learners will get a hands-on experience working on pivot table andthe various components of pivot tables. Additionally, the learners will also learn how to performquick analysis. Data summarization using pivot tables Quick analysis using sparkline charts Top N Filtering using LARGE FunctionData Modelling and Visualization – Power Query and ChartsBy the end of this module, the learners will get an understanding of ETL process, get comfortablein extracting data from multiple sources both live and static, cleaning them in power query andfinally loading them in Excel. The learners will also learn to create an interactive dashboard fordetailed analysis.Advanced Data AnalyticsBy the end of this module, the learners will get an understanding of ETL process, get comfortablein extracting data from multiple sources both live and static, cleaning them in power query andfinally loading them in Excel. The learners will also learn to create an interactive dashboard fordetailed analysis. What If Analysis and Scenario Manager Statistical analysis using Descriptive Statistics Correlation analysis to identify relationships Forecasting in Excel
Funding Information (Upto 30th June 2022)For Self-Sponsored Individuals (Upto 30th June 2022)For Singaporeans below40 & Singapore PR of allage groups(80% Funding Support)For Singaporeans 40 andabove(90% Funding Support)Original Course Fee7% GSTEnhanced FundingSupport 750 52.50 750 52.50 642.00 722.25Total fee payable 160.50 80.25For Company-Sponsored Individuals (Upto 30th June 2022)For Singaporeans below40 & Singapore PR of allage groups(80% Funding Support)For Singaporeans 40 andabove(90% Funding Support)Original Course Fee7% GSTEnhanced FundingSupport 750 52.50 750 52.50 600.00 675.00Total fee payable 202.50 127.50Training Allowance Grant (TAG) at 10/training hourfor eligible company-sponsored individuals is paidout after course completionOn successfullycompleting the course 160*Participants need to clear the assessment and acquire the minimum attendance to be eligible for the funding
Funding Information (From 1st July 2022)For Self-Sponsored Individuals (From 1st July 2022)For Singaporeans belowFor Singaporeans 40 and40 & Singapore PR of allaboveage groups(90% Funding Support)(70% Funding Support)Original Course Fee7% GST 750 52.50 750 52.50Funding Support 561.75 722.25Total fee payable 240.75 80.25For Company-Sponsored Individuals (From 1st July 2022)For Singaporeans below40 & Singapore PR of allage groups(70% Funding Support)For Singaporeans 40 andabove(90% Funding Support)Original Course Fee7% GST 750 52.50 750 52.50Funding Support 525.00 675.00Total fee payable 277.50 127.50*Participants need to clear the assessment and acquire the minimum attendance to be eligible for the funding
Join us & launchyour career in datascience.It's time to upskill for the Industry 4.0www.xaltiusacademy.comContact us learn@xaltius.tech or 65 83039150 / 65 91389813
for analysis. Pivot Tables By the end of this module, the learners will get a hands-on experience working on pivot table and the various components of pivot tables. Additionally, the learners will also learn how to perform quick analysis. Data summarization using pivot tables Quick analysis using sparkline charts
