Transcription
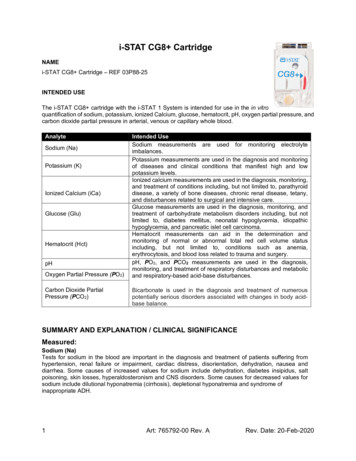
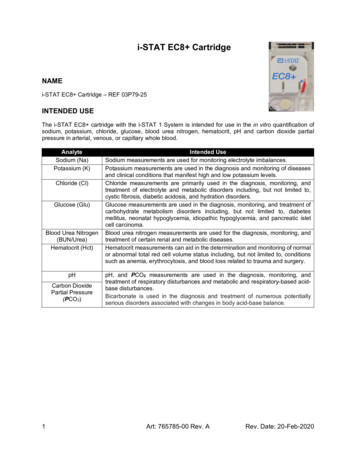
i-STAT EC8 CartridgeNAMEi-STAT EC8 Cartridge – REF 03P79-25INTENDED USEThe i-STAT EC8 cartridge with the i-STAT 1 System is intended for use in the in vitro quantification ofsodium, potassium, chloride, glucose, blood urea nitrogen, hematocrit, pH and carbon dioxide partialpressure in arterial, venous, or capillary whole blood.AnalyteSodium (Na)Potassium (K)Chloride (Cl)Glucose (Glu)Blood Urea Nitrogen(BUN/Urea)Hematocrit (Hct)pHCarbon DioxidePartial Pressure(PCO2)1Intended UseSodium measurements are used for monitoring electrolyte imbalances.Potassium measurements are used in the diagnosis and monitoring of diseasesand clinical conditions that manifest high and low potassium levels.Chloride measurements are primarily used in the diagnosis, monitoring, andtreatment of electrolyte and metabolic disorders including, but not limited to,cystic fibrosis, diabetic acidosis, and hydration disorders.Glucose measurements are used in the diagnosis, monitoring, and treatment ofcarbohydrate metabolism disorders including, but not limited to, diabetesmellitus, neonatal hypoglycemia, idiopathic hypoglycemia, and pancreatic isletcell carcinoma.Blood urea nitrogen measurements are used for the diagnosis, monitoring, andtreatment of certain renal and metabolic diseases.Hematocrit measurements can aid in the determination and monitoring of normalor abnormal total red cell volume status including, but not limited to, conditionssuch as anemia, erythrocytosis, and blood loss related to trauma and surgery.pH, and PCO2 measurements are used in the diagnosis, monitoring, andtreatment of respiratory disturbances and metabolic and respiratory-based acidbase disturbances.Bicarbonate is used in the diagnosis and treatment of numerous potentiallyserious disorders associated with changes in body acid-base balance.Art: 765785-00 Rev. ARev. Date: 20-Feb-2020
SUMMARY AND EXPLANATION/CLINICAL SIGNIFICANCEMeasured:Sodium (Na)Tests for sodium in the blood are important in the diagnosis and treatment of patients suffering fromhypertension, renal failure or impairment, cardiac distress, disorientation, dehydration, nausea anddiarrhea. Some causes of increased values for sodium include dehydration, diabetes insipidus, saltpoisoning, skin losses, hyperaldosteronism and CNS disorders. Some causes for decreased valuesfor sodium include dilutional hyponatremia (cirrhosis), depletional hyponatremia and syndrome ofinappropriate ADH.Potassium (K)Tests for potassium in the blood are important in the diagnosis and treatment of patients suffering fromhypertension, renal failure or impairment, cardiac distress, disorientation, dehydration, nausea anddiarrhea. Some causes of increased values for potassium include renal glomerular disease,adrenocortical insufficiency, diabetic ketoacidosis (DKA), sepsis and in vitro hemolysis. Some causes ofdecreased values for potassium include renal tubular disease, hyperaldosteronism, treatment of DKA,hyperinsulinism, metabolic alkalosis and diuretic therapy.Chloride (Cl)Tests for chloride in the blood are important in the diagnosis and treatment of patients suffering fromhypertension, renal failure or impairment, cardiac distress, disorientation, dehydration, nausea anddiarrhea. Some causes of increased values for chloride include prolonged diarrhea, renal tubulardisease, hyperparathyroidism and dehydration. Some causes for decreased values for chloride includeprolonged vomiting, burns, salt-losing renal disease, overhydration and thiazide therapy.Glucose (Glu)Glucose is a primary energy source for the body and the only source of nutrients for brain tissue.Measurements for determination of blood glucose levels are important in the diagnosis and treatment ofpatients suffering from diabetes and hypoglycemia. Some causes for increased values of glucose includediabetes mellitus, pancreatitis, endocrine disorders (e.g., Cushing’s syndrome), drugs (e.g., steroids,thyrotoxicosis), chronic renal failure, stress, or I.V. glucose infusion. Some causes of decreased valuesof glucose include insulinoma, adrenocortical insufficiency, hypopituitarism, massive liver disease,ethanol ingestion, reactive hypoglycemia, and glycogen storage disease.Blood Urea Nitrogen (BUN/Urea)An abnormally high level of urea nitrogen in the blood is an indication of kidney functionimpairment or failure. Some other causes of increased values for urea nitrogen include prerenalazotemia (e.g., shock), postrenal azotemia, GI bleeding and a high protein diet. Some causesof decreased values for urea nitrogen include pregnancy, severe liver insufficiency, overhydrationand malnutrition.Rev. Date: 20-Feb-2020Art: 765785-00 Rev. A2
Hematocrit (Hct)Hematocrit is a measurement of the fractional volume of red blood cells. This is a key indicator of thebody’s state of hydration, anemia or severe blood loss, as well as the blood’s ability to transport oxygen.A decreased hematocrit can be due to either overhydration, which increases the plasma volume, or adecrease in the number of red blood cells caused by anemias or blood loss. An increased hematocritcan be due to loss of fluids, such as in dehydration, diuretic therapy, and burns, or an increase in redblood cells, such as in cardiovascular and renal disorders, polycythemia vera, and impaired ventilation.pHpH is an index of the acidity or alkalinity of the blood with an arterial pH of 7.35 indicating an acidemiaand 7.45 alkalemia 1.Carbon Dioxide Partial Pressure (PCO2)PCO2 along with pH is used to assess acid-base balance. PCO2 (partial pressure of carbon dioxide), therespiratory component of acid-base balance, is a measure of the tension or pressure of carbon dioxidedissolved in the blood. PCO2 represents the balance between cellular production of CO2 and ventilatoryremoval of CO2 and a change in PCO2 indicates an alteration in this balance. Causes of primaryrespiratory acidosis (increase in PCO2) are airway obstruction, sedatives and anesthetics, respiratorydistress syndrome, and chronic obstructive pulmonary disease. Causes of primary respiratory alkalosis(decreased PCO2) are hypoxia (resulting in hyperventilation) due to chronic heart failure, edema andneurologic disorders, and mechanical hyperventilation.TEST PRINCIPLEThe i-STAT System uses direct (undiluted) electrochemical methods. Values obtained by direct methodsmay differ from those obtained by indirect (diluted) methods. 2Measured:Sodium (Na), Potassium (K) and Chloride (Cl)The respective analyte is measured by ion-selective electrode potentiometry. Concentrations arecalculated from the measured potential through the Nernst equation.Glucose (Glu)Glucose is measured amperometrically. Oxidation of glucose, catalyzed by the enzyme glucose oxidase,produces hydrogen peroxide (H2O2). The liberated H2O2 is oxidized at the electrode to produce a currentproportional to the sample glucose concentration.BUN/UreaUrea is hydrolyzed to ammonium ions in a reaction catalyzed by the enzyme urease.The ammonium ions are measured potentiometrically by an ion-selective electrode. In the calculation ofresults, concentration is related to potential through the Nernst Equation.3Art: 765785-00 Rev. ARev. Date: 20-Feb-2020
Hematocrit (Hct)Hematocrit is determined conductometrically. The measured conductivity, after correction for electrolyteconcentration, is inversely related to the hematocrit.pHpH is measured by direct potentiometry. In the calculation of results for pH, concentration is related topotential through the Nernst equation.PCO2PCO2 is measured by direct potentiometry. In the calculation of results for PCO2, concentration is relatedto potential through the Nernst equation.Temperature “Correction” AlgorithmpH, and PCO2 are temperature-dependent quantities and are measured at 37 C. The pH and PCO2readings at a body temperature other than 37 C can be ‘corrected’ by entering the patient’s temperatureon the chart page of the analyzer. In this case, blood gas results will be displayed at both 37 C and thepatient’s temperature.pH and PCO2 at the patient’s temperature (Tp) are calculated as follows 3:Calculated:Anion Gap (AnGap)Anion Gap is calculated in the EC8 cartridge as follows:Anion gap is reported as the difference between the commonly measured cations sodium and potassiumand the commonly measured anions chloride and bicarbonate. The size of the gap reflects unmeasuredcations and anions and is therefore an analytical gap. Physiologically, a deficit of anions cannot exist.While relatively nonspecific, anion gap is useful for the detection of organic acidosis due to an increasein anions that are difficult to measure. Anion gap can be used to classify metabolic acidosis into high andnormal anion gap types.Hemoglobin (Hb)The i-STAT System provides a calculated hemoglobin result which is determined as follows:hemoglobin (g/dL) hematocrit (% PCV) x 0.34hemoglobin (g/dL) hematocrit (decimal fraction) x 34To convert a hemoglobin result from g/dL to mmol/L, multiply the displayed result by 0.621. Thecalculation of hemoglobin from hematocrit assumes a normal MCHC.Rev. Date: 20-Feb-2020Art: 765785-00 Rev. A4
HCO3, TCO2, and BE HCO3 (bicarbonate), the most abundant buffer in the blood plasma, is an indicator of the bufferingcapacity of blood. Regulated primarily by the kidneys, HCO3 is the metabolic component of acid-basebalance.TCO2 is a measure of carbon dioxide which exists in several states: CO2 in physical solution or looselybound to proteins, bicarbonate (HCO3) or carbonate (CO3) anions, and carbonic acid (H2CO3).Measurement of TCO2 as part of an electrolyte profile is useful chiefly to evaluate HCO3 concentration.TCO2 and HCO3 are useful in the assessment of acid-base imbalance (along with pH and PCO2) andelectrolyte imbalance.The calculated TCO2 provided by the i-STAT System is determined from the measured and reportedvalues of pH and PCO2 according to a simplified and standardized form of the Henderson-Hasselbalchequation. 3 This calculated TCO2 measurement is metrologically traceable to the i-STAT pH and PCO2measurements, which are in turn traceable to primary standard reference materials for pH and PCO2.Like all calculated parameters reported by the i-STAT System, the user can independently determineTCO2 values from the reported pH and PCO2 measurements using a combination of the equation forHCO3 given in the PCO2. Base excess of the extracellular fluid (ECF) or standard base excess is defined as the concentration oftitratable base minus the concentration of titratable acid when titrating the average ECF (plasma plusinterstitial fluid) to an arterial plasma pH of 7.40 at PCO2 of 40 mmHg at 37 C. Excess concentration ofbase in the average ECF remains virtually constant during acute changes in the PCO2 and reflects onlythe non-respiratory component of pH‑disturbances.When a cartridge includes sensors for both pH and PCO2, bicarbonate (HCO3), total carbon dioxide (TCO2)and base excess (BE) are calculated. 3log HCO3 pH log PCO2- 7.608TCO2 HCO3 0.03PCO2BEecf HCO3-24.8 16.2(pH-7.4)BEb (1 - 0.014*Hb) * [ HCO3 - 24.8 (1.43 * Hb 7.7) * (pH - 7.4) ]See below for information on factors affecting results. Certain substances, such as drugs, may affectanalyte levels in vivo. 4 If results appear inconsistent with the clinical assessment, the patient sample shouldbe retested using another cartridge.REAGENTSContentsEach i-STAT cartridge contains one reference electrode sensor, sensors for the measurement of specificanalytes, and a buffered aqueous calibrant solution that contains known concentrations of analytes andpreservatives. A list of reactive ingredients for the EC8 cartridge is shown below:SensorReactive IngredientBiological SourceMinimum QuantityNaSodium (Na )N/A121 mmol/LKPotassium (K )N/A3.6 mmol/LClChloride (Cl –)N/A91 mmol/LGlucoseN/A7 mmol/LGlucose OxidaseAspergillus niger0.002 IUGlu5Art: 765785-00 Rev. ARev. Date: 20-Feb-2020
SensorReactive IngredientBiological SourceMinimum QuantityUreaN/A4 mmol/LUreaseCanavalia ensiformis0.12 IUpHHydrogen Ion (H )N/A6.66 pHPCO2Carbon Dioxide (CO2)N/A25.2 mmHgBUN/UreaWarnings and Precautions For in vitro diagnostic use. Cartridges are intended for single-use only. Do not reuse. Refer to the i-STAT 1 System Manual for all warnings and precautions.Storage Conditions Cartridges are intended for single-use only. Do not reuse. Room Temperature at 18 30 ºC (64 86 ºF). Refer to the cartridge box for recommended shelf life.INSTRUMENTSThe EC8 cartridge is intended for use with i-STAT 1 analyzer.SPECIMEN COLLECTION AND PREPARATION FOR ANALYSISSpecimen TypesArterial, venous or capillary whole blood.Sample volume: 65 µLBlood Collection Options and Test Timing (time from collection to cartridge N/UreaHematocritSyringesWithoutanticoagulantWith balancedheparinanticoagulant orlithium heparinanticoagulant(syringe must befilled permanufacturer'srecommendation) Maintainanaerobicconditions. Remixthoroughlybefore fillingcartridge.WithoutanticoagulantWith balancedheparinanticoagulant orlithium heparinRev. Date: 20-Feb-2020TestTiming3 minutes10 minutes3 minutes30 minutesEvacuated TubesWithoutanticoagulantWith lithiumheparinanticoagulant(tubes must befilled permanufacturer'srecommendation) Maintainanaerobicconditions. Remixthoroughlybefore fillingcartridge.WithoutanticoagulantWith lithiumheparinanticoagulantArt: 765785-00 Rev. ATestTiming3 minutes10 minutes3 minutes30 minutesCapillary TubesWith balancedheparinanticoagulant orlithium heparin iflabeled for themeasurement ofelectrolytesWith balancedheparinanticoagulant orlithium heparinor lithiumheparin ifTestTiming3 minutes3 minutes6
AnalyteSyringesanticoagulant(syringe must befilled permanufacturer'srecommendation) Remixthoroughlybefore fillingcartridge.TestTimingEvacuated Tubes(tubes must befilled permanufacturer'srecommendation) Remixthoroughlybefore fillingcartridge.TestTimingCapillary TubesTestTiminglabeled for themeasurement ofelectrolytesPROCEDURE FOR CARTRIDGE TESTINGEach cartridge is sealed in a foil pouch for protection during storage--do not use if pouch has beenpunctured. A cartridge should not be removed from its protective pouch until it is at room temperature(18-30 C or 64-86 F). For best results, the cartridge and analyzer should be at room temperature. Since condensation on a cold cartridge may prevent proper contact with the analyzer, allowrefrigerated cartridges to equilibrate at room temperature for 5 minutes for a single cartridge and 1hour for an entire box before use. Use a cartridge immediately after removing it from its protective pouch. Prolonged exposure maycause a cartridge to fail a Quality Check. Do not return unopened, previously refrigerated cartridges to the refrigerator. Cartridges may be stored at room temperature for the time frame indicated on the cartridge box.Filling and Sealing the Cartridge (after cartridge has been equilibrated and blood sample has beencollected)1. Place the cartridge on a flat surface.2. Mix the sample thoroughly. Invert a lithium heparin blood collection tube at least 10 times. Ifsample was collected into a syringe, invert syringe for 5 seconds then roll the syringe between thepalms (hands parallel to the ground) for 5 seconds, flip and roll for an additional 5 seconds. Theblood in the hub of the syringe will not mix, therefore expelling 2 drops before filling a cartridge isdesired. Note that it may be difficult to properly mix a sample in a 1.0 mL syringe.3. Fill the cartridge immediately after mixing. Direct the hub of syringe or tip of the transfer device(capillary tube, pipette, or dispensing tip) into the sample well of the cartridge.4. Slowly dispense sample into the sample well until the sample reaches the fill mark indicated on thecartridge. Cartridge is properly filled when the sample reaches the ‘fill to’ mark and a small amountof sample is in the sample well. The sample should be continuous, no bubbles or breaks (seeSystem Manual for details).5. Fold the snap closure of the cartridge over the sample well.Performing Patient Analysis1. Press the power button to turn on the handheld.2. Press 2 for i-STAT Cartridge.3. Follow the handheld prompts.4. Scan the lot number on the cartridge pouch.5. Continue normal procedures for preparing the sample, and filling and sealing the cartridge.6. Push the sealed cartridge into the handheld port until it clicks into place. Wait for the test to complete.7. Review the results.7Art: 765785-00 Rev. ARev. Date: 20-Feb-2020
For additional information for cartridge testing, refer to the i-STAT 1 System Manual located atwww.pointofcare.abbott.Analysis TimeApproximately 130–200 seconds.Quality ControlThe i-STAT quality control regimen comprises four aspects, with a system design that reduces theopportunity for error, including:1. A series of automated, on-line quality measurements that monitors the sensors, fluidics, andinstrumentation each time a test is performed.2. A series of automated, on-line procedural checks that monitors the user each time a test isperformed.3. Liquid materials are available to be used to verify the performance of a batch of cartridges whenthey are first received or when storage conditions are in question. The performance of thisprocedure is not a manufacturer’s system instruction.4. Traditional quality control measurements that verify the instrumentation using an independentdevice, which simulates the characteristics of the electrochemical sensors in a way that stressesthe performance characteristics of the instrumentation.For additional information on Quality Control, refer to the i-STAT 1 System Manual located atwww.pointofcare.abbott.Calibration VerificationCalibration Verification is a procedure intended to verify the accuracy of results over the entiremeasurement range of a test. The performance of this procedure is not a manufacturer’s system instruction.However, it may be required by regulatory or accreditation bodies. While the Calibration Verification Setcontains five levels, verification of the measurement range could be accomplished using the lowest, highestand mid-levels.Rev. Date: 20-Feb-2020Art: 765785-00 Rev. A8
EXPECTED VALUESTESTUNITS *REPORTABLERANGEREFERENCE nUreaHematocrit/HctpHPCO2mmol/L (mEq/L)mmol/L (mEq/L)mmol/L (mEq/L)mmol/Lmg/dLg/Lmg/dL100 1802.0 9.065 1401.1 38.920 7000.20 7.003 140138 146 53.5 4.9 5 **98 109 53.9 5.8 670 105 60.70 1.05 68 26 5mmol/L1 502.9 9.4 5mg/dL6 30017 56 5g/L0.06 3.000.17 0.56 5% PCV ***Fraction15 750.15 0.756.50 - 8.205 – 1300.67 – 17.33mmHgkPa38 51 5 ****0.38 0.51 57.31 - 7.41*****7.35 - 7.45 635 - 45 641 - 514.67 - 6.005.47 - O2Base Excess/ mol/L(mEq/L)mmol/L(mEq/L)10 20 612 17 5 ****120 170 57 11 5(-10) ( 99)5.1 25.551 2553.2 15.81.0 – 85.022 – 26*****23 – 28*****5 - 5023 - 2724 - 29(-30) – ( 30)(-2) – ( 3) 6(-2) – ( 3) 6The i-STAT System can be configured with the preferred units. Not applicable for pH test.The reference range for potassium has been reduced by 0.2 mmol/L from the range cited inReference 5 to account for the difference in results between serum and plasma.PCV, packed cell volume.The reference ranges for hematocrit and hemoglobin span both female and male populations.Calculated from Siggard-Andersen nomogram. 1Unit Conversiono Glucose (Glu): To convert mg/dL to mmol/L, multiply the mg/dL value by 0.055.o BUN/Urea: To convert a BUN result in mg/dL to a urea result in mmol/L, multiply the BUN resultby 0.357. To convert a urea result in mmol/L to a urea result in mg/dL, multiply the mmol/L resultby 6. To convert a urea result in mg/dL to a urea result in g/L, divide the mg/dL result by 100.9Art: 765785-00 Rev. ARev. Date: 20-Feb-2020
ooHematocrit (Hct): To convert a result from % PCV (packed cell volume) to fraction packed cellvolume, divide the % PCV result by 100. For the measurement of hematocrit, the i-STAT Systemcan be customized to agree with methods calibrated by the microhematocrit reference methodusing either K3EDTA or K2EDTA anticoagulant. Mean cell volumes of K3EDTA anticoagulatedblood are approximately 2–4% less than K2EDTA anticoagulated blood. While the choice ofanticoagulant affects the microhematocrit method to which all hematocrit methods are calibrated,results from routine samples on hematology analyzers are independent of the anticoagulant used.Since most clinical hematology analyzers are calibrated by the microhematocrit method usingK3EDTA anticoagulant, the i-STAT System default customization is K3EDTA.PCO2: To convert PCO2 results from mmHg to kPa, multiple the mmHg value by 0.133.The reference ranges programmed into the analyzer and shown above are intended to be used as guidesfor the interpretation of results. Since reference ranges may vary with demographic factors such as age,gender and heritage, it is recommended that reference ranges be determined for the population beingtested.METROLOGICAL TRACEABILITYThe measured analytes in the i-STAT EC8 cartridge are traceable to the following reference materials ormethods. The i-STAT System controls and calibration verification materials are validated for use onlywith the i-STAT System and assigned values may not be commutable with other methods.Sodium (Na), Potassium (K) and Chloride (Cl)The respective analyte values assigned to i-STAT System controls and calibration verification materialsare traceable to the U.S. National Institute of Standards and Technology (NIST) standard referencematerial SRM956.Glucose (Glu)The i‑STAT System test for glucose measures glucose amount-of-substance concentration in the plasmafraction of arterial, venous, or capillary whole blood (dimension mmol L‑1) for in vitro diagnostic use.Glucose values assigned to i‑STAT System controls and calibration verification materials are traceableto the U.S. National Institute of Standards and Technology (NIST) standard reference material SRM965.i‑STAT System controls and calibration verification materials are validated for use only with the i‑STATSystem and assigned values may not be commutable with other methods.Blood Urea Nitrogen (BUN/Urea)The i‑STAT System test for blood urea nitrogen/urea measures blood urea nitrogen/urea amount-ofsubstance concentration in the plasma fraction of arterial, venous, or capillary whole blood (dimensionmmol L-1) for in vitro diagnostic use. BUN/urea values assigned to i‑STAT System controls and calibrationverification materials are traceable to the U.S. National Institute of Standards and Technology (NIST)standard reference material SRM909. i‑STAT System controls and calibration verification materials arevalidated for use only with the i‑STAT System and assigned values may not be commutable with othermethods.Hematocrit (Hct)The i‑STAT System test for hematocrit measures packed red blood cell volume fraction in arterial, venous,or capillary whole blood (expressed as the % packed cell volume) for in vitro diagnostic use. Hematocritvalues assigned to i‑STAT working calibrators are traceable to the Clinical and Laboratory StandardsInstitute (CLSI) H7-A3 procedure for determining packed cell volume by the microhematocrit method. 7Rev. Date: 20-Feb-2020Art: 765785-00 Rev. A10
pHThe i‑STAT System test for pH measures the hydrogen ion amount-of-substance concentration in theplasma fraction of arterial, venous, or capillary whole blood (expressed as the negative logarithm of therelative molal hydrogen ion activity) for in vitro diagnostic use. pH values assigned to i‑STAT Systemcontrols and calibration verification materials are traceable to the U.S. National Institute of Standards andTechnology (NIST) standard reference materials SRMs 186-I, 186-II, 185, and 187.PCO2The i‑STAT System test for carbon dioxide partial pressure measures carbon dioxide partial pressurein arterial, venous, or capillary whole blood (dimension kPa) for in vitro diagnostic use. PCO2 valuesassigned to i‑STAT System controls and calibration verification materials are traceable to U.S. NationalInstitute of Standards and Technology (NIST) standard reference materials via commercially availablecertified specialty medical gas standards.Additional information regarding metrological traceability is available from Abbott Point of Care Inc.PERFORMANCE CHARACTERISTICSThe typical performance data summarized below were collected in health care facilities by health careprofessionals trained in the use of the i-STAT System and comparative methods.PrecisionPrecision data collected was collected in multiple sites and tested as follows: Duplicates of each controlfluid were tested in the morning and in the afternoon on five days for a total of 20 replicates. The averagedstatistics are presented below.SDCV (%)Aqueous(Standard[CoefficientControlDeviation)of Variation (%)]TestUnitsMeanNammol/L or mEq/LLevel 1120.00.460.4Level 3160.00.530.3Kmmol/L or mEq/LLevel 12.850.0381.3Level 36.300.0390.6Clmmol/L or mEq/LLevel 176.70.540.7Level 3114.00.560.5Glumg/dLLevel 141.80.681.6Level 32892.40.8BUN/Ureamg/dLLevel 152.80.761.4Level 35.50.458.2Low30.00.441.5Hct% PCV(packed cell volume)High49.00.501.0pHLevel 17.1650.0050.08Level 37.6560.0030.04PCO2mmHgLevel 163.81.572.5Level 319.60.402.0Method ComparisonMethod comparison data were collected using CLSI guideline EP9-A. 811Art: 765785-00 Rev. ARev. Date: 20-Feb-2020
Deming regression analysis 9 was performed on the first replicate of each sample set. In the methodcomparison table, n is the number of specimens in the data set, Sxx and Syy refer to estimates ofimprecision based on the duplicates of the comparative and the i-STAT methods respectively, Sy.x is thestandard error of the estimate, and r is the correlation coefficient. *Method comparisons will vary from site to site due to differences in sample handling, comparative methodcalibration and other site-specific variables.* The usual warning relating to the use of regression analysis is summarized here as a reminder. For any analyte, “ifthe data is collected over a narrow range, the estimate of the regression parameters are relatively imprecise and maybe biased. Therefore, predictions made from these estimates may be invalid”. 9 The correlation coefficient, r, can beused as a guide to assess the adequacy of the comparative method range in overcoming this problem, and, as aguide, the range of data can be considered adequate for r ron CX 31890.740.531.00-0.111.171261480.865Kodak a STATProfile ’tSy.xXminXmaxrBeckmanSynchron CX 31890.0600.0550.970.020.0762.85.70.978Kodak 3Nova STATProfile eInt’tSy.xXminXmaxrBeckmanSynchron CX 31891.270.880.99-0.821.65931140.817Kodak EktachemTM7001420.410.900.8814.61.84631280.914Nova STATProfile 51920.890.880.934.32.33961170.752Sodium/Na(mmol/L or mEq/L)Venous blood samples werecollected in lithium heparinVacutainer tubes and analyzed induplicate on the i-STAT System.A portion of the specimen wascentrifuged and the separatedplasma was analyzed in duplicateon comparative methods within 20minutes of collection.Potassium/K(mmol/L or mEq/L)Venous blood samples werecollected in lithium heparinVacutainer tubes and analyzed induplicate on the i-STAT System.A portion of the specimen wascentrifuged and the separatedplasma was analyzed in duplicateon comparative methods within 20minutes of collection.Chloride/Cl(mmol/L or mEq/L)Venous blood samples werecollected in lithium heparinVacutainer tubes and analyzed induplicate on the i-STAT System.A portion of the specimen wascentrifuged and the separatedplasma was analyzed in duplicateon comparative methods within 20minutes of collection.Rev. Date: 20-Feb-2020Art: 765785-00 Rev. A12
Glucose/Glu(mg/dL)Venous blood samples were collectedin lithium heparin Vacutainer tubesand analyzed in duplicate on thei-STAT System.A portion of the specimen wascentrifuged and the separated plasmawas analyzed in duplicate oncomparative methods within 20minutes of a(mg/dL)Venous blood samples were collectedin lithium heparin Vacutainer tubesand analyzed in duplicate on thei-STAT System.A portion of the specimen wascentrifuged and the separated plasmawas analyzed in duplicate oncomparative methods within 20minutes of rit/Hct(% PCV)(% packed cell volume)Venous blood samples, collected inlithium heparin Vacutainer tubes,were analyzed in duplicate on thei-STAT System and on thecomparative methods for hematocritwithin 20 minutes of collection.pHVenous blood samples were collectedin evacuated tubes and arterialsamples were collected in blood gassyringes with lithium heparinanticoagulant. All sample wereanalyzed in duplicate on the i-STATSystem and on the comparativemethods within 10 minutes of eachother. Arterial blood samples werecollected from hospital patients in 3mL blood gas syringes and wereanalyzed in duplicate on the lter LX20 Bayer 91.01-0.851.57482570.998BeckmanCoulter LX20 Dade DimensionRxL-Xpand .315380.998BeckmanCoulter CX9 260.390.601.00-0.380.857660.997Coulter S e ’tSy.xXminXmaxIL ICA Art: 765785-00 Rev. TAT Profile5570.0060.0081.058-0.4360
1 Art: 765785-00 Rev. A Rev. Date: 20-Feb-2020 i-STAT EC8 Cartridge NAME i-STAT EC8 Cartridge - REF 03P79-25 INTENDED USE The i-STAT EC8 cartridge with the i-STAT 1 System is intended for use in the in vitro quantification of sodium, potassium, chloride, glucose, blood urea nitrogen, hematocrit, pH and carbon dioxide partial
