Transcription
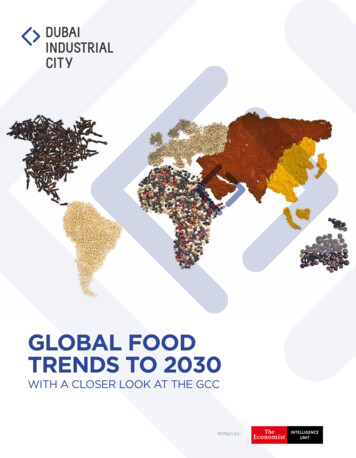
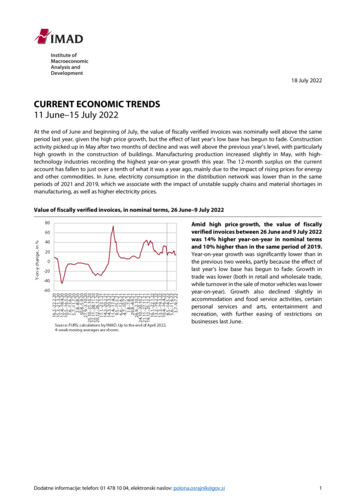
18 July 2022CURRENT ECONOMIC TRENDS11 June–15 July 2022At the end of June and beginning of July, the value of fiscally verified invoices was nominally well above the sameperiod last year, given the high price growth, but the effect of last year’s low base has begun to fade. Constructionactivity picked up in May after two months of decline and was well above the previous year’s level, with particularlyhigh growth in the construction of buildings. Manufacturing production increased slightly in May, with hightechnology industries recording the highest year-on-year growth this year. The 12-month surplus on the currentaccount has fallen to just over a tenth of what it was a year ago, mainly due to the impact of rising prices for energyand other commodities. In June, electricity consumption in the distribution network was lower than in the sameperiods of 2021 and 2019, which we associate with the impact of unstable supply chains and material shortages inmanufacturing, as well as higher electricity prices.Value of fiscally verified invoices, in nominal terms, 26 June–9 July 2022Amid high price growth, the value of fiscallyverified invoices between 26 June and 9 July 2022was 14% higher year-on-year in nominal termsand 10% higher than in the same period of 2019.Year-on-year growth was significantly lower than inthe previous two weeks, partly because the effect oflast year’s low base has begun to fade. Growth intrade was lower (both in retail and wholesale trade,while turnover in the sale of motor vehicles was loweryear-on-year). Growth also declined slightly inaccommodation and food service activities, certainpersonal services and arts, entertainment andrecreation, with further easing of restrictions onbusinesses last June.Dodatne informacije: telefon: 01 478 10 04, elektronski naslov: polona.osrajnik@gov.si1
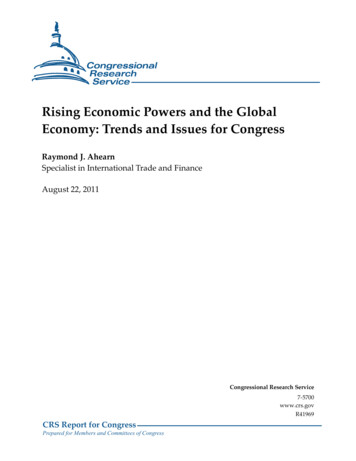
Activity in construction, May 2022According to figures on the value of constructionput in place, construction activity increased inMay and was significantly higher year-on-year.After a strong pick-up at the beginning of this year,the value of construction put in place declined on amonthly basis in March and April before rising againin May. In the first five months, the value ofconstruction put in place was 22.2% higher than inthe same period of 2021. Construction of buildingsstands out in terms of growth in activity. Activity alsoincreased in civil engineering, while activity waslower in specialised construction work (installationworks, building completion, etc.).The data based on VAT forms show that the year-onyear increase of construction activity was about 17p.p. lower this year than can be assumed from thedata on the value of construction put in place.Production volume in manufacturing, May 2022Manufacturing production continued to riseslightly in May. Growth continued in the hightechnology and medium-low-technology industries,while production in the other two groups declinedagain. In the first five months, production was 5.1%higher than a year ago, with the strongest growth inthe high-technology industries. Most otherindustries were also at or above last year’s levels,while the manufacture of motor vehicles, trailers andsemi-trailers in particular was lower and was also theonly industry that has not yet reached pre-epidemiclevels due to various factors (supply chaindisruptions, lower demand, restructuring towards agreater supply of electric vehicles).More information: phone: 386 1 478 10 04, e-mail: polona.osrajnik@gov.si2
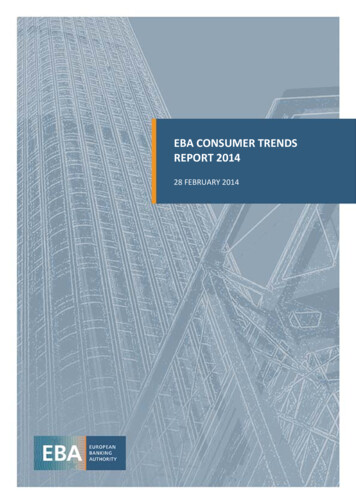
Current account of the balance of payments, May 2022The 12-month surplus of the current account ofthe balance of payments fell to just over a tenthof what it was a year ago. It amounted to EUR 363.7million (0.6% of estimated GDP), compared to EUR3.5 billion or 6.8% of GDP in 2021. With importsgrowing faster than exports, this was mainly due togoods trade balance, which turned from a surplus toa deficit at the end of last year. This is mainly relatedto rising prices for energy and other primarycommodities, which have a negative effect on thebalance of payments due to a relatively rigiddemand. Net outflows of primary and secondaryincomes were also higher year-on-year in May. Theprimary income deficit was higher mainly due tohigher payments of dividends and profits to foreigninvestors, which is related to high economic activityin Slovenia. In addition, payments from traditionalown resources to the EU budget were also higher.The higher secondary income deficit wascharacterised by higher pension transfers topensioners abroad. The services surplus continues togrow, especially in trade in travel (easing of COVID-19restrictions) and in trade in telecommunication,computer and information services.Electricity consumption by consumption group, June 2022In June, electricity consumption in thedistribution network was lower than in the sameperiods of 2021 and 2019. With one more workingday, industrial electricity consumption in June was0.6% lower year-on-year, while small businesselectricity consumption was 2.0% higher. The lattermay have been partly influenced by last year’s lowbase due to restrictions in trade and services.Household consumption in June was 6.2% lowerthan a year ago and 4.3% lower than in the sameperiod of 2019, which could already be due to higherelectricity prices for households. Industrial electricityconsumption and small business electricityconsumption in June were about the same as in June2019, with three more working days this June. Thisdevelopment is related to the impact of unstablesituation regarding supply chains and materialshortages in manufacturing and higher electricityprices.More information: phone: 386 1 478 10 04, e-mail: polona.osrajnik@gov.si3
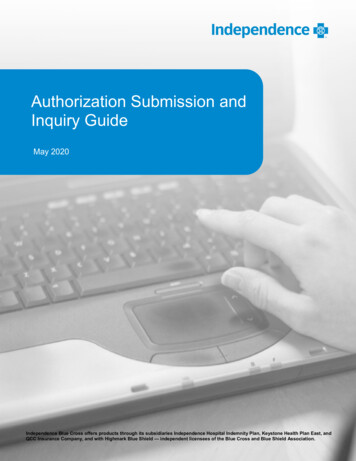
Road and rail freight transport, Q1 2022The volume of road and rail freight transportincreased in the first quarter of 2022. The volumeof road transport performed by Slovenian vehiclesincreased significantly quarter-on-quarter and was13% higher than in the same quarter of 2019 (crosstrade increased by 7% and other road transport by19%). Amid strong growth of economic activity, thehigh quarter-on-quarter growth was mainly due tofurther increase in road transport performed at leastpartially on Slovenian territory (exports, imports andnational transport combined), while the volume ofcross-trade decreased again. Thus, the share of crosstrade transport performed by Slovenian vehicles intotal transport is still much lower than before theepidemic, while the share of transport performed byforeign vehicles on Slovenian motorways (accordingto DARS data) has returned to its previous level. Railfreight transport, which had been declining alsobefore the epidemic, was a tenth lower than in thesame quarter of 2019.More information: phone: 386 1 478 10 04, e-mail: polona.osrajnik@gov.si4
Table: Selected macroeconomic indicators for SloveniaSelected macroeconomic indicators for SloveniaGDP, realPrivate consumption, realGovernment consumption, realGross investment, realExports of goods and services, realImports of goods and services, realDate of releaseLatestNext18.05.2022 18.08.202218.05.2022 18.08.202218.05.2022 18.08.202218.05.2022 18.08.202218.05.2022 18.08.202218.05.2022 18.08.202218.05.2022 18.08.202218.05.2022 18.08.202218.05.2022 18.08.202218.05.2022 18.08.202218.05.2022 18.08.202218.05.2022 18.08.2022Unit% (Q/Q-1)% (Q/Q-4)3% (Q/Q-1)% (Q/Q-4)3% (Q/Q-1)% (Q/Q-4)2020 021 Q11.61.54.2-1.12.81.2-6.35.63.91.64.71.23% (Q/Q-1)% (Q/Q-4)3% (Q/Q-1)% (Q/Q-4)3% (Q/Q-1)% (Q/Q-4)3Reference period2021 Q22021 6.324.51.01.230.511.64.61.336.119.12021 Q45.310.42.122.92.17.0-0.10.85.312.15.116.82022 202204.08.2022EUR mEUR m4% (M/M-1)% (M/M-12)4% (M/M-1)% (M/M-12)2022 m 12.7142.9-0.38.8-1.720.22022 m 2-237.7-185.60.34.64.819.62022 m 3-239.8-108.53.48.10.213.32022 m 4-250.1-35.73.79.82.210.42022 m 5-277.2-16.81.525.13.919.52022 m 6::::::30.06.202230.06.202229.07.202229.07.2022% (M/M-1)% (M/M-12)2022 m 10.45.82022 m 21.46.92022 m 3-1.15.42022 m 42.66.92022 m 52.08.12022 m .07.202222.07.2022% (M/M-1)% (M/M-12)% (M/M-1)% (M/M-12)% (M/M-1)% (M/M-12)% (M/M-1)% (M/M-12)2022 m 1-6.8-2.7-7.63.4-5.2-10.8-3.2-13.32022 m 20.2-1.01.64.2-2.4-8.4-3.0-10.82022 m 34.2-0.14.25.64.3-8.31.6-11.22022 m 4-0.30.4-1.16.41.2-8.13.3-10.42022 m 5::::::::2022 m 8.07.2022% (M/M-1)% (M/M-12)4% (M/M-1)% (M/M-12)%2022 m 1-0.53.3-2.8-25.96.92022 m 20.33.2-2.4-26.46.62022 m 30.22.9-2.1-26.76.22022 m 40.32.9-2.1-26.75.92022 m 5::-2.2-25.7:2022 m 02230.08.202230.08.2022% (Q/Q-1)% (Q/Q-4)%2020 Q41.20.45.12021 Q1-5.1-5.55.62021 Q24.91.14.32021 Q31.11.94.52021 Q4-0.9-0.34.52022 229.07.2022% (M/M-1)% (M/M-12)% (M/M-1)3% (M/M-12)% (M/M-1)3% (M/M-12)% (M/M-1)3% (M/M-12)% (M/M-1)3% (M/M-12)2022 m 12.512.8-1.211.032.415.2-0.621.9-0.725.72022 m 25.718.4-2.22.48.432.24.412.73.015.32022 m 31.720.32.55.2-3.918.6-0.210.32.619.32022 m 43.223.40.62.5-4.815.00.312.62.523.52022 m 53.125.70.25.65.830.2::::2022 m 6::::::::::General government deficit/surplus (ESA 2010)Consolidated gross general government debt (ESA 2010)31.03.202231.03.202230.09.202230.09.2022% BDP% 020-7.879.82021-5.274.7Economic sentiment indicator5, seasonally adjusted24.06.202222.07.2022%2022 m 15.52022 m 26.72022 m 31.52022 m 44.22022 m 52.82022 m 60.8%%US 2022 m 1-0.56010.44001.13142022 m 2-0.53230.84001.13422022 m 3-0.49671.17001.10192022 m 4-0.44791.75001.08192022 m 5-0.38572.05001.05782022 m 6-0.23922.53001.0566Trade balance1Current account 1Exports of goods, real2Imports of goods, real2Inflation (CPI)Gross earnings per employee – nominal- private sector- public sector- of which government sectorEmployed personsRegistered unemployed personsRegistered unemployment rateEmployment, LFSILO unemployment rate, LFSIndustrial producer prices, domestic marketProduction volume in manufacturing, realConstruction, real value of construction outputTurnover in trade, realReal turnover in market servicesEURIBOR, 3-monthLong-term government bond yieldsExchange rate, USD to EURBeginning of the month *Beginning of the monthBeginning of the month453Source: SURS, BS, ECB, EUROSTAT, EURIBOR.org, calculations by IMAD.Notes: 1Balance of payments statistics of the BoS. 2External trade statistics SURS. 3Seasonally adjusted – SURS. 4Seasonally adjusted – IMAD. 5 Difference between positive and negative answers, in %.* calculations by IMAD.For comparisons with the EU and EMU see: eeisThe table format accessible to screen reader users can be found on the IMAD website among the appendices to the current graphsof the week (Selected macroeconomic indicators for euro area)More information: phone: 386 1 478 10 04, e-mail: polona.osrajnik@gov.si5
mbtu zfbs t mpx cbtf ibt cfhvo up gbef (spxui jo usbef xbt mpxfs cpui jo sfubjm boe xipmftbmf usbef xijmf uvsopwfs jo uif tbmf pg npups wfijdmft xbt mpxfs zfbs po zfbs (spxui bmtp efdmjofe tmjhiumz jo bddpnnpebujpo boe gppe tfswjdf bdujwjujft dfsubjo qfstpobm tfswjdft boe bsut foufsubjonfou boe sfdsfbujpo xjui gvsuifs fbtjoh pg sftusjdujpot po