Transcription
ALASKA ECONOMICAlaska Economic Trends is a monthly publicationde; lingw with avarietyof economic-related issues in thestate.Ala ska Economic Trendsis funded by the EmploymentSec:urity Division and published by the AlaskaDelpartmentof Labor, P.O. Box 21 149, Juneau,Alaska.991302-1149. For more information, call the DOLPul9lications Office at (907) 465-6019 or email theauthors.A TRENDS Profile1Matanuska-Susitna BoroughAlaska Employment Scene:9Unemployment and Inflation FallEmployment Scene Tables:Material in this publication is public information and,wit h appropriate credit, may be reproduced withoutPer,mission.10Editor's Note: The views presented in guest articles inAlarska Economic Trendsdo not necessarilyreflect theviews of the Alaska Department of LaborNonagricultural Wage and SalaryEmployment-Alaska and Anchorage10Hours and Earnings forSelected IndustriesTony Knowles, GovernorState of Alaska11Nonagricultural Wage and SalaryEmployment in Other Economic Regions12Unemployment Rates by Region and Census AreaTom Cashen, CommissionerDepartment of LaborDiana Kelm, EditorOctober 1997Volume 17Number 10ISSN 0160-3345IPrinredanddistributedbyASSETS: a vocationaltrainingcenter andemploymentprogram.This puldic tion.funded by theSecur tyDkv siorl,was pmduced ata cos?d 5 67 per copy%-Cover design by Jim Fowler
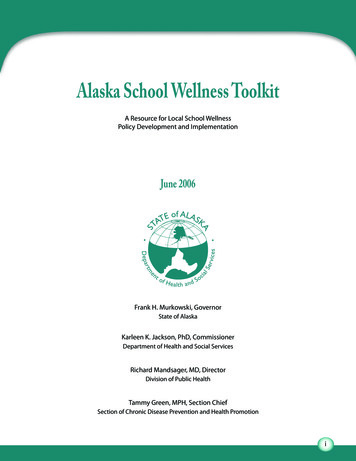
Natanuska-Susitna Boroughby Neal FriedT h e atanuska- usitnaBorough is the thirdlargest in Alaska, with 24,683 square miles; it isabout the same size as West Virginia. Home tothree incorporated cities and at least 13 otheridentified communities (See Table 1.), the MatSu Borough is the third most populous area of thestate. Even though the borough is large, and mostof its landmass is remote, approximately 90 percent of its more than 52,000 residents live alongthe road system between Willow and Sutton. Thefew communities in the borough that are off theroad system can be reached by boat, snow machine, off-road vehicle, bush plane or the AlaskaRailroad.Population growth is a primaryeconomic forceFigures 1 and 2.) The affinity of these two areashelps explain their strong inter-relationship. (SeeFigure 3.) Not only do many Mat-SU residentsmake a daily commute, but 10 percent of boroughresidents work elsewhere in the state. The largestgroup of these "remote commuters" work in theNorth Slope oilfields, but others work in mines, onthe fishing grounds, or at construction sites andother worksites throughout Alaska. In asense, oneof the borough's biggest exports is its labor force,rather than the goods and services that otherregions in the state export. In fact, more than 40percent of the income Mat-Su residents earncomes from outside the borough. In most otherareas of the state the income flow is just thereverse. Why do so many people choose to live inthe Mat-Su Borough and earn their livelihoodelsewhere?Originally, most of the economic activity in theMat-Su Borough developed around agricultureand gold and coal mining. Although some of theseactivities still exist, they aredwarfed by larger economicforces. The Mat-Su Borough'seconomy and workforce patterns are unique within Alaska,but in some ways resemblemany of those found elsewherein the U.S.Because much of the borough'spopulation lives within 40-50miles of Anchorage, many MatSu residents commute to Anchorage for work. According tothe 1990 census, the last countavailable, 28 percent of Mat-SuBorough residents worked inAnchorage. Strong growth inborough population has beencoupled with a steady climb intraffic counts on the new fourlane highway between the MatSu Valley and Anchorage. (SeeAlaska Economic Trends October 1997AnchorageMat-Su BoroughbWasilla1TalkeetnaMeadow Lakes-43%52%Big LakePalmer.139%Houstonwillow22%Sample communitieswithin the Mat-SuBorouahI43%71I98%1NealFriedisa t Research andAnalysis Section,Adm'nistrativeServicesAlaskaDepartment ofL&Neal islocated inSource: AlaskaDepartment o fLabor, Researchand AnalysisSection.m'
Mat-Su Borough'saffordable housing is acost advantageSource: AlaskaDepartment o /Source: AlaskaDepartment o fLabor, Researchand AnalysisSection.20,00025%The Mat-Su Borough's appeal isdue, in part, to affordable housing and lifestyle, which help explain strong economic and population growth up to and including the 1990s. The average salesprice of a single family home inthe Mat-Su Borough in 1997 was20 percent below a similar homein Anchorage. (See Figure 4.) Inthe future, this cost advantagecould increase as the residentialbuilding lots in Anchorage become increasingly scarce.Another way of lookingat affordability is calculating how manywage earners are required tosupport the average mortgage.Because the average wage inthe Mat-Su Borough is lower thanin Anchorage and statewide, ittakes as many local wage earnersto afford the average Mat-Suhome as it does Anchorage wageearners to afford an average Anchorage home. This equation isimpacted, however, by the number of Mat-Su residents who earntheir wages outside of the borough. For example, for thoseworking in Anchorage, it takesonly 1.1 workers to afford a MatSu home versus 1.4 for an Anchorage home. It is important toremember that these numbersrepresentaverages onlyand maskother importantdetailsthat mightmake housingin the Mat-Su Borough even more attractive tohomeowners.Another housing advantage offered by the Mat-Su Borough isthe ready availabilityof alternate-LAlaska Economic Trends October 1997
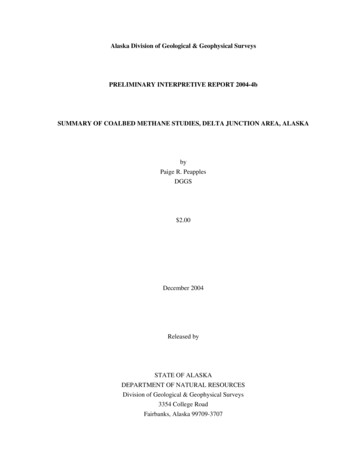
housing. For instance, in 1996,330 of the 829 residential starts Irecorded by the borough weredesignated "cabins." Housing ofthis type usually requires nomortgage or lending activity.Many of these cabins are recreJuneauational, but others are yeararound primary residences. ThisKetchikantype of alternative housing is notnormally available to urban resiAnchoragedents due to the cost of land, andplanningand zoning regulations.AlaskaThis affordable and attractiveoption for some Mat-Su Valleyresidents is not often capturedMat-Suby "average housing" data.and AnalysisSection.KenaiOther advantagesCost advantages are not limited to housing, butalso extend tibusinessas well. As land and development costs continue to rise in Anchorage, theMat-su Valley becomes increasingly competitivefor certain projects. The Mat-Su Borough is positioned to capture an expanding share of theeconomic growth taking place in SouthcentralAlaska. For example, GCI, a telecommunicationscompany headquartered in Anchorage, located acall center in the Mat-Su Borough in 1992. Thereare many businesses in the borough that caterboth to the Mat-Su Valley and Anchorage markets.For example, the many car dealers in the boroughservice the local population but also rely heavilyon Anchorage consumers.Visitor industry a growingeconomic playerThe Mat-Su Valley is a major visitor destination. Itis home to Denali State Park and serves as agateway to Denali climbs and tours. Bisected bythe Parks and Glenn Highways, the borough offershundreds of lakes, rivers, and attractions such asthe state fair. For decades, the Valley has been oneof the primary recreation areas for Southcentralresidents. In fact, in 1990, 21 percent of theAlaska Economic Trends October 1997T a b l e e l-41997Matanuska-SusitnaBoroughAlexanderBig LakeButteChaseChickaloonHouston (city)KnikLazy MountainMeadow LakesPalmer (city)SkwentnaSuttonTalkeetnaTrapper CreekWasilla (city)WillowRemainder of Borough52,448382,2432,538532059944433Source: AlaskaDepartment o fLabor, Researchand AnalysisSection.
Source: AlaskaDepartment o fLabor, Researchand AnalysisSection.Ius.I1housing units counted by theCensus Bureau in the Mat-SuBorough were for seasonal orrecreational use. Hundreds ofnew cabins are built in the borough each year, many of whichare for recreational purposes.Their owners spend money inthe local economy and pay property taxes. Many others who maynot have recreational propertyalso spend time in the Mat-Suarea fishing, hunting, snowmobiling, boating or enjoying otherrecreational activities.Thousands of out-of-state visitorsand Alaskans from around thestate make their way to the MatSu Borough each year. Most ofthe borough's visitors are independent travelers and are notpart of larger organized tours.The Valley's visitor industry, however, is beginning to change anddiversify. This year, PrincessTours, one of the state's largesttour operators, opened a 160room hotel in Denali State Park.In addition, Cook Inlet RegionalCorporation recentlyannouncedplans to build a new hotel/lodgein the Talkeetna area.Trade*FIRE Finance,Insurance, andReal Estate.841Source: AlaskaDepartment ofLabor, Researchand AnalysisSection.2604Traditional players stillhave economic roleAlthough eclipsed by other economic sectors, agricultural production in theMat-Su Borough isthe largest in the state. In 1996,the Mat-Su Valley produced 7million worth of farm goods representing 56 percent of all agricultural production in the state.Since the closure of the ValdezCreek gold mine in 1995, mining in the borough is limited to aAlaska Economic Trends October 1997
1985 1986 1987 1988 995Total mm. & Util.'TradeWholesale TradeRetail c. & Unclassified' Transportation employment 7996 adjusted for post benchmark correction. This figure differs from annualaverage industry employment published in the 1996 Employment & Earnings Summary Report.Source: Alaska Department o f labor, Research and Analysis Section.few small operators employingvery few workers. There is somepotential in the coal mining arena. Recently the state's only coalproducer, UsibelliMines, boughtbutthe wishbone Hill coal interests, a move that could eventually bring back coal mining to theborough.F i g u r e o 7mpMarmfacturinaTransportation8%'FIRE Finance,Insurance, andReal Estate.Source: AlaskaDepartment o f1abor, Researchand AnalysisSection, and U.S.Department o fCommerce,Bureau o f theCensus.The Mat-Su Boroughis still growing fasterRecent population figuresdescribe the area's stronggrowth. During the 1990s, MatSu Borough growth has outpaced population growth statewide. Between 1990 and 1997,the population of the boroughAlaska Economic Trends October 19975
Source: AlaskaDepartment ofLabor, Researchand AnalysisSection.ment in the Mat-Su Boroughgrew more than 40 percentcompared to a little over 10 percentstatewide. (See Figure 5.) In diRank Employer1996 rect contrast with other areas ofthe state, most of the employment growth in the Mat-Su lev Hospital365ough is a result of population23Carr Cottstein Foods339growth. Nearly two-thirds of4Matanuska Telephone Association284these new jobs were in retailWal-Mart2595and services, which constitute aMatanuska-Susitna Borough2026bigger slice of the borough'sMat-Su Community Counseling Gelnter7172 wage and salary pie than they doAlaska Department of Corrections171 statewide or in Anchorage. (See8University of Alaska1649Table 2 and Figures 6 and 7.)lob Corm (Advanced Concepts in Education)12710This is because a disproportion11Nye Frontier Ford124ate segment of Mat-Su employ12Matanuska Electric Association121ees serves the local populationAlaska Department of Administration (Pioneer Home) 11813and visitors. There are excep14Kinn Enter rises(McDonald's)99tions,however. For example, inSafeway Stores89151994,JobCorps built a campus16CCI Communications81in Palmer to provide training to17Tony Chevrolet79Mat-Su Services for Children and Adults71 Alaskans around the state. It has18now become one of the largerLake Lucille Inn (Best Western)6619employers in the borough. (See20Chugach Development Cor oration21City of WasillaTable 3.) Other sizable contrib22U.S. Post Officeutors to employment growth23Wolverine Supplywere the construction industry5 6 and local government. Most ofSpenard Builders SUDD VMECA-Employment Connection56local government's growth has55New Horizons Telecomcome from the Matanuska-SusCity of Palmer53itna BoroughSchool District, theAlaska Department of Health & Social Services51borough's largest employer. Bigincreases in the Mat-Su Valley'sstudent population have madegrew 32 percent primarily as a result of in-migra- this necessary. (See Figure 8.) Much of the intion. During the last four years, Anchorage and the crease in construction has resulted from a need forstate as a whole experienced net out-migration infrastructure to accommodate this populationwith population growth increasing only 13 and 11 growth.percent, respectively, due to natural increase.(See Figure 1 and Table I.) In 1997, the Mat-SuBorough's population reached 52,488, making it Wages and income still lagthe third most populous borough in the state,Wages and income have traditionally been lowerbehind Anchorage and Fairbanks.in the Mat-Su Borough. In 1996, the averageIn addition to rapid population growth, theMat-Su monthly wage and salary job in the boroughBorough has enjoyed impressive employment earned 2,320 versus 2,673 statewide. (Seegrowth. From 1990-96, wage and salary employ- Table 4.) Most of this difference is explained by6Alaska Economic Trends October 1997
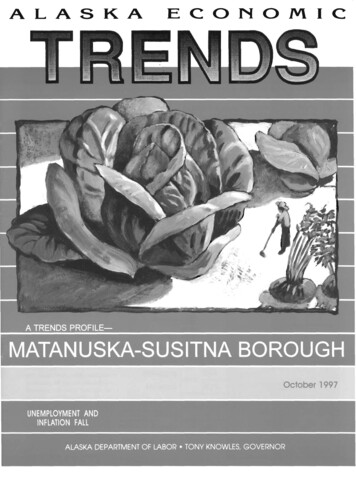
the employment mix. More jobsin the borough fall into lowerpaying industry categories suchas retail, services, and financeinsurance and real estate whilefewer are available in the highPopulation (1997)er-paying industries such as oil,transportation and government. Mat-SuBomugh's populationisolder,As we have noted, many Mat-Su Median ageresidents work elsewhere in the lessraciallydiverse,state, where wages are higher. WhiteEven considering higher wages NativeAmericanearned outside the borough, BlackAsian & Pacific IslanderMat-Su's per capita income wasonly 72 percent of the statewide hasmorechildren,rnoreseniors,average. This lower income is a Percent under 20partial reflection of lower wag- Percent 20 to 64Percent 65 years & overes, larger households, higher unanaverageproportionof females.employment and other factors.Percent femaleFewerresidenltshave collegedegrees,,----.Unemployment rates fall High school graauate or nlgner (-IYYU)Bachelor'sdegree or higher (1990)but remain highmoreareunemployed,The unemployment picture inPercent of all 16 years in labor forcethe Mat-Su Borough has imPercent unemployedproved, but figures remain stubbornly high compared to those incomeandwagesare lower.of Anchorage. This is somewhat Personal per capita income (1994)Annual average monthlyearningsvexing because much ofthe borough shares a common labor Housing istighter,market with Anchorage. (See Percentvacancy rateFigure 9.) For example, in Julyof rentsdiffer little.2Anchorage -- 667this year, Anchorage's jobless Average 4.54.492.95.40.90.834.161 .O4.936.058.75.3'Source: U.S.Department ofCommerce,Bureau of theCensus.Source: AlaskaDepartment o/Labor, Researchand AnalysisSection.0rate was 4.7% versus 9.2% inthe Mat-Su Borough. Part of the explanation is thatMat-Su's economy tends to be more seasonal anda segment of the borough's population is notwithin an easy commute of Anchorage. Anotherfactor is that many permanent borough residentsemployed elsewhere in the state return homewhen they lose their jobs. There are, obviously,other factors for this consistently higher unemployment rate which are difficult to identify andisolate.Alaska Economic Trends October 1997' A verage monthlyrent forapartments,condominiumsand other rentalunits, notincluding singlefamily residencesor mobile homes.Rent adjusted toinclude utilities.7
SummarySource:Matanuska Susitna BoroughSchool District.'12 , 0 . 11,000 - -*There is little doubt that thegrowth rates of the Mat-Su Borough's population and economywill continue to outpace those ofthe rest of the state or Anchorage. The desire to live in theMat-Su Borough remains a keyfactor in a healthy economic future. Growth will not be limitedto housing but also will be seenin the business sector as well.The Mat-Su Borough visitor industry will continue to expandand diversify. Projects such asports and other industrial development are also high on theborough'slistofgoals. In theshortrun, income will remain lowerand unemploymentwill be higher, but as the Anchorage andMat-Su economies become increasingly integrated, many ofthe current differences will blur.1estimatedSource: AlaskaDepartment o f1 abor, Researchand AnalysisSection.8Alaska Economic Trends October 1997
Unemployment and Inflation FallIIAlaska's unemployment rate, without reflecting seasonal adjustment, continued its summerdownturn in July, falling seven-tenths of a Percentage point to 6.0%. (See Table4.) The O m parable national rate was 5.0%' About 20f300e dJuly, almost p 8 O 0Alaskanswere u n e m l o inless than the June figure. For the third straight'Cuts a head in state governmentRecent pressure to restrain public sector spendingisevident inthe employment numbersfor governmerit. So far, federal government has taken thelargesthit, In 1996, federal government employment reached ib lowestlevelsince 1973, downnearly 2,700 from ih 1993 peak. This drop in-month the unemployment rate showed an im- cludes civilian layoffs related to military cutbacks.provement compared to Alaska's year-ago rate ofFrom 1990 through 1996, employment in state6.6%.government fluctuated within one percent ofWith the exception of government, every major 21,500 despite a 10.5% increase in population.industry had more jobs available in July than in While federal government employment lossesJune. The construction, transportation, mining appear to be moderating, state government deand tourism-related industries all added signifi- clines are expected to accelerate. Only local govcant numbers of new jobs in July. (See Table 1.) ernment added significant employment in theThe drop in government employment reflected 1990s. So far this decade, education-related emseasonal losses in local school districts and at the Ployment has risen 10.5%and other local employment 11-6%.University of Alaska.Kristen Trombleis a laboreconomist withthe Research andAnalysis Section,AdministrativeServicesDivision, AlaskaDepartment o /Labor. Kristen islocated inJuneau.The biggest source of additional employment in The University of Alaska projects a reduction ofJuly was Alaska's seafood processing industry, nearly 600 full-time equivalent jobs by fall 1999,which added 5,800 jobs in response to the peak or 17.9% of its fall 1996 workforce. The projectedsalmon processing season. However, employ- cut is allocated as follows: 30.0% faculty; 22.7%ment in this industry was approximately 700 less clerical; 20.9% administrative and professional;than last year's level. Indeed, employment 16.1% crafts/trades/maintenance; and 10.4%fromreached the lowest level for the month of July technical positions. As a percentage of its totalsince 1989, when the ExxonF i g u r e e 1Valdez oil spill forced the do4sure of some fisheries. (See Figure 1.) This year, smaller thanforecast salmon returns in Bris- - - - - - - - - - - - - - - - - - - .to1 Bay, Cook Inlet, Kodiak, and 20 - - - - - - - - - - - - - - - Source: AlaskaSoutheast, coupled with harvestDepartment o /ers'strikes for higher prices, lowLabor, Researchered employment needs. Not l5- - - - - - - and AnalysisSection.cessing jobs available, but surduction employees in this industry worked fewer hours perweek this July than last. (SeeTable 2.)-- -Alaska Economic Trends October 1997o
Changes from:7/96 6/97 7/96AlaskaTotal Norlag. Wage & SalaryGoods-pnoducingService-p roducingMiningConstruc:tionManufacturingDurable GoodsLumbe , & Wood ProductsNondurabble GoodsSeafood ProcessingPulp MiIIsTransportationTruckin(I &WarehousingWater TransportationAir TransportationCommunicationsTradeWholes: ale TradeRetail TIradeGen. Merch. & ApparelFood S toresEating & Drinking PlacesFinance.Ins. & Real EstateServices & Misc.Hotels fk Lodging PlacesBusinesis ServicesHealth ServicesEnginee!ring & Mngmt. SewGovemnnentFederalStateLocalPI7/97rl6/97Changes from:7196 6/97 7/96Total Nonag. Wage & ctionManufacturingTransportationAir TransportationCommunicationsTradeWholesale TradeRetail TradeGen. Merch. & ApparelFood StoresEating & Drinking PlacesFinance-Ins & Real EstateServices & Misc.Hotels B Lodging PlacesBusiness ServicesHealth ServicesEngineering & Mngmt. Sew.GovernmentFederalStateLocaltAverage Weekly E a r n i n g sPI7/97MiningConstructionManufacturing. Seafood Processingf rans., Comm. & UtilitiesTradeWholesaleRetailFinance-Ins. & R.E.Municipalityof /97374.39684.13422.47659.65379.01518.94Notes to Tables 1-3:Tables 1&2- Prepared in cooperation with the U.S.Department o f Labor, Bureau o f Labor Statistics.Table 3- Prepared in part with funding /rom theEmployment Security Division.,Average Weekly H o u r sAverage Hourly Earningspl-r 7212.1616.77Government includes employees o / public school systemsand the University o f Alaska.Average hours and earnings estimates are based on datafor full-time and part-time production workers(manufacturingl and nonsupervisory workers(nonmanufacturingl. Averages are for gross earnings andhours paid, 'including overtime pay and hours,p/ denotes preliminary estimates.Benchmark: March 1996r/ denotes revised estimates10Alaska Economic Trends October 1997
Southeast RegionP'd7/976197Changes7/96 6/97em:7/96Total Nonag. Wage & uctionManufacturingTransportationTradeFinance-Ins. & Real EstateServices & MI%.GovernmentFederalStateLocalTotal Nonag. Wage & uctionManufacturingDurable GoodsLumber & Wood ProductsNondurable GoodsSeafood ProcessingPulp MillsTransportationTradeWholesale TradeRetail TradeFinance-Ins. & Real EstateServices & Misc.GovernmentFederalStateLocalFairbanks North Star BoroughAnchorageIMat-Su RegionTotal Nonag. Wage & uctionManufacturingTransportationTradeFinance-Ins. & Real EstateServ ces& Misc.GovernmentFederalStateLocalTotal Nonag. Wage & uctionManufacturingSeafood ProcessingTransportationTradeWholesale TradeRetail TradeFinance-Ins & Real EstateServices & 508.65010,90011.90010,950 -1,000-50Total Nonag. Wage & uctionManufacturingTransportationTrucking & WarehousingAir TransportationCommunicationsTradeWholesale TradeRetail TradeGen. Merch. &ApparelFood StoresEating & Drinking PlacesFinance-Ins. & Real EstateServices & Misc.GovernmentFederalStateLocalTotal Nonag. Wage & SalaryGoods-producingService-producingSeafood ProcessingGovernmentFederalStateLocalNorthern RegionTotal Nonag. Wage & eLocal35,100
-T a b l e m 4. . *-,I-.:-Percent Unemployedplrl7/976/977/96p/ denotespreliminaryestimatesNot Seasonally Adjusted5.05.25.6rl denotesre vised estimatesAlaska Statewide6.0A n c h A a t S u Region5.5Municipality of Anchorage4.7Mat-Su Borough9.2Gulf Coast Region7.4Kenai Peninsula Borough8.3Kodiak Island Borough5.1.-valaez- oraovati.6Interior Region5.9Denali Borough5.8Fairbanks North Star Borough5.6Southeast Fairbanks8.4Yukon-Koyukuk11.2Northern Region11.3Nome12.9North Slope Borough5.6Northwest Arctic Borough17.1Southeast Region5.5Haines Borough4.7Juneau Borough4.6Ketchikan Gateway Borough6.9Prince of Wales-Outer Ketchikan 9.9Sitka urg5.1Yakutat Borough7.5Southwest Region7.0Aleutians East Borough4.5Aleutians West4.6Bethel8.5Bristol Bay Borough3.4Dillingham4.74.3Lake 8. Peninsula BoroughWade Hampton11.0Seasonally AdjustedUnited .83.48.66.06.48.611.7Benchmark.March 1996Comparisonsbetweendifferent timeperiods are notas meaningful asother time seriespublished by theAlaskaDepartment o fLabor.The officialdefinitionof unemploymentcurrently in placeexcludes anyonewho has notmade an activeattempt to findwork in the fourweek period upto and includingthe week thatincludes the 12tho f the re/erencemonth. Due t othe scarcity o femploymentopportunities inrural Alaskanlocations, manyindividuals donot meet theo/ficia/ definitiono f unemployedbecause theyhave notconducted anactive job search.These individualsare considerednot in the laborforce.Source: AlaskaDepartment o fLabor, Researchand AnalysisSection.United Statesa , . .-- .-t i/.IState government employment is also expected tobe reduced through the implementation of anAs of August 1, moreearly retirementthan 300 state employees had chosen to retireunder the State of Alaska's early retirement program. According to the Governor's Office of Management and Budget, some of those positions willbe deleted from agency budgets, while others willremain unfilled for a period of time as agenciesassess theirabilityto function withoutthe position.While the current impact of the early retirementprogram on overall state employment is relativelysmall, over the next three fiscal years this programis expected to cut steadily into state agency employment counts.Anchorage inflation rate slowsFigures recently released by the Bureau of LaborStatistics show the rate of inflation in the state'slargest urban area slowing significantly. Calculations for the Anchorage Consumer Price Index forAll Urban Consumers, All Items indicate an inflation rate of 1.6% for the fiscal year ending June1997. This is a full percentage point below theprevious year's rate, and the lowest recorded rateof inflation since the downturn in Alaska's economy during 1986-88. Anchorage is the only Alaskalocation for which this rate is measured.Compared to the fiscal year endingJune1996, therate of inflation slowed or remained the same formost components that make up the Index, withtwo exceptions: apparel and upkeep, and othergoods and services. Entertainment posted the5.05.4largest decline, with an inflation rate of 1.1%compared to a rate of 4.6% for the previous fiscalemployment, the crafts/trades/and maintenance year. The next largest drop was in transportationcategory would take the biggest hit, a reduction of where costs fell by -0.5% compared to an increasealmost one-third. Employment at the system's of 2.6% in the previous year. Medical care costs,largest campus, Fairbanks, would fall by over one- with an inflation rate of 8.5%, continued to infifth, comprising more than 60 percent of the total crease the fastest.cut. Some of the cuts will be achieved through anearly retirement program.Alaska Economic Trends October 1997
Alaska Employment ServiceAnchorage: Phone 269-4800Homer: Phone 235-7791Kotzebue: Phone 442-3280Kodiak: Phone 486-31 05Bethel: Phone 543-2210Nome: Phone 443-262612460Dillingham: Phone 842-5579Seward: Phone 224-5276Tok: Phone 883-5629Eagle River: Phone 694-6904107Juneau: Phone 465-4562Valdez: Phone 835-4910Mat-Su: Phone 352-2500Petersburg: Phone 772-3791Kenai: Phone 283-2927Fairbanks: Phone 451 -5967Sitka: Phone 747-33471342316921Glennallen: Phone 822-3350Ketchikan: Phone 225-31 81/82/83The Alaska Department of Labor shall foster and promote thewelfare of the wage earners of the state and improve their workingconditions and advance their opportunities for profitable employment.
Edi Ala I % - ska Economic Trends is a monthly publication lingw with avarietyof economic-related issues in the e. ska Economic Trendsis funded by the Employment . Safeway Stores 89 CCI Communications 8 1 Tony Chevrolet 79 Mat-Su Services for Children and Adults 71 Lake Lucille Inn (Best Western) 6 6