Transcription
Brain ImagingNeuroReportNeuroReport 10, 2911 2917 (1999)WE evaluated the relationship between amyloid-â protein (Aâ) concentration and the metabolic abnormalityin an Alzheimer's disease (AD) patient as measured by[18 F] uorodeoxyglucose positron emission tomography(FDG-PET). Across most regions there were signi cantinverse correlations among FDG-PET intensity valuesand both insoluble. The temporal lobe samples showedno signi cant correlation between FDG-PET valuesand Aâ deposition. Findings support Aâ as contributingto the hypometabolism in regions of the AD brain thatare still relatively viable metabolically; those regionswith chronic pathologic damage, such as temporalcortex, may have other factors that contribute tometabolic de cits. NeuroReport 10:2911 2917 # 1999Lippincott Williams & Wilkins.Mapping biochemistry tometabolism: FDG-PET andamyloid burden inAlzheimer's diseaseMichael S. Mega,1,2,CA Teresa Chu,2,3John C. Mazziotta,1Kashyap H. Trivedi,1Paul M. Thompson,1 Amish Shah,1Gregory Cole,2 Sally A. Frautschy,2and Arthur W. Toga11Department of Neurology, Laboratory of NeuroImaging, Division of Brain Mapping, 2 Alzheimer'sDisease Center, and 3 Department of MedicineUCLA School of Medicine, 710 Westwood Plaza,Rm 4-238 Reed, Los Angeles, CA 90095-1769,USAKeywords: Alzheimer's disease; Amyloid protein; Brainmapping; PETIntroductionThe relationship between the metabolic defect inAlzheimer's disease (AD), as measured by[18 F] uorodeoxyglucose positron emission tomography (FDG-PET), and the cellular markers of thedisease is poorly understood. Atrophy is the bestcorrelate to focal hypometabolism [1,2]. In a pathological study conducted 16 months after an ADpatient was evaluated with FDG-PET, regionalhypometabolism correlated with cell loss, gliosis andamyloid plaques [3]. In that study the PET wasobtained long before the post-mortem evaluationand tissue samples were not precisely localized tothe PET data.Amyloid is deposited in the posterior parietal lobeearly in AD [4]. Medial temporal structures areaffected early in mildly impaired patients [5] but arenot well visualized by PET. The preclinical parietalhypometabolism supports a role for amyloid in thepathophysiology of AD. Although amyloid containing plaques do not correlate with cognitive de citsin AD [6] or disease duration, altered synapticfunction is associated with the accumulation of0959-4965 # Lippincott Williams & WilkinsCA,1Corresponding Author and Addressamyloid â-protein (Aâ) [7]. The activity observedon FDG-PET, assuming that blood ow and glucoseutilization remain coupled, re ects the metabolismof active synapses as they restore their resting ionicgradients via Na/K-ATPase [8]. Metabolism of glucose and the production of ATP from the electrontransport chain in mitochondria concentrated insynapses may be dysfunctional in AD due tooxidative damage [9].Oxidative damage is increased in AD comparedwith age-matched controls, as re ected by increasedmitochondrial DNA deletions [9] due to the generation of reactive oxygen species (ROS), increasedlipid peroxidation [10] and an increase in the cell'sattempt to generate reducing power by up-regulating glucose-6-phosphate dehydrogenase [11]. If Aâcauses oxidative damage in vivo, then disorderedenergy metabolism re ected by low FDG-PETvalues should be signi cantly associated with highlevels of Aâ. This study tests the above hypothesisby measuring Aâ concentrations in fresh frozenbrain samples mapped to their spatial location in thesame patient's pre-mortem functional imaging data.By employing both linear and non-linear [12] warpVol 10 No 14 29 September 19992911
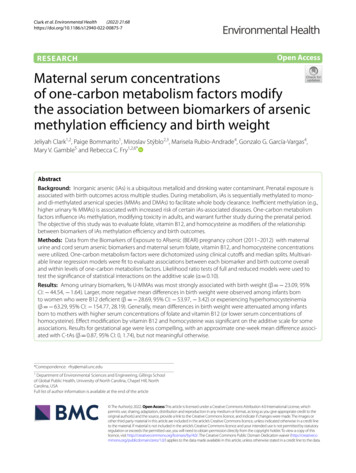
NeuroReporting algorithms cryomacrotome tissue deformationsare corrected allowing metabolic biochemical analysis.Materials and MethodsPatient: The patient was a right-handed man, employed as a circuit court judge, who died at the ageof 80 years with a premorbid diagnosis of probableAD as de ned by the National Institute of Neurological and Communicative Disorders and Stroke/Alzheimer's Disease and Related Disorders Association [13]. Symptoms rst appeared approximately 10years prior to death manifested by apathy andforgetfulness. Instrumental activities of daily living(paying bills, writing checks, shopping, etc.) werelost 5 years prior to death. Activities of daily living(feeding, bathing, toileting, etc.) were lost 3 yearsprior death. A gradual decline of other functionsensued with no evidence of systemic, metabolic orfocal brain abnormalities revealed by laboratoryanalysis and structural imaging. A FDG-PET studywas obtained 8 h before death and the patient's brainwas frozen 12 h after death. At the time of scanningthe patient's neurological examination was signi cant for eyes open with blinking to threat bilaterally.The patient had no spontaneous verbal output anddid not follow commands. With painful stimuli thepatient moved all extremities equally; there was noasymmetries on deep tendon re exes and toes weredown-going. The cause of death was cardiopulmonary arrest. The patient had a neuro brillary tangleburden, as re ected by Gallyas staining intensity,consistent with Braak and Braak stage IV [14], asreported previously in a methodological description[15]. This study was approved by the HumanSubjects Protection Committee of the University ofCalifornia at Los Angeles, and the patient's nearestrelative signed a written informed consent.Scanning procedure: Arrangements were made toscan the patient with FDG-PET when death appeared imminent, and the patient's family signed aninformed consent for scanning. During uptake theroom was dimmed, the patient received a 5 mCi i.v.injection of [18 F] uorodeoxyglucose (half life110 min) according to a protocol described previously [16]. Scanning was performed on a SiemensECAT 961 scanner that produces 47 slices. Imageswere reconstructed with a Hanning lter for a nalimage resolution of 3.6 mm FWHM inplane atcenter and 4.5 mm at 20 cm off-center. A calculatedattenuation correction was used [17]. The FDGPET voxel is 1.69 mm in the x and y dimensions and3.125 mm in the z axis. Imaging commenced 40 minafter administration of FDG and lasted for 60 min,2912Vol 10 No 14 29 September 1999M. S. Mega et al.with . 2 million counts per plane. We did notobtain absolute metabolic rates in this study; allfunctional images re ect FDG-PET intensity valuesreferenced to a peak in the patient's cerebellum. Thepatient's head was immobilized using a polystyrenehead-holder. Continuous pulse-oximeter readings ofthe patient during scanning never fell below 92%saturation.Tissue collection: Cryomacrotome sectioning of thefrozen tissue produced whole brain sections fortissue samples and allowed the reconstruction of a3D digital data set. Within 6 h of death, the brainwas prepared by en bloc frozen xation starting at atemperature of 108C and then lowered into a isopentane bath at ÿ708C at a rate of 1 cm/min. Thefrozen brain was then sectioned in the coronal planein a large industrial cryomacrotome (PMV Stockholm, Sweden) using a hardened steel knife. Imagecapture was accomplished by a Dage-MTI digitalcamera integral to the hydraulic descending bladeallowing in-register capture of serial blockfaceimages throughout sectioning. Digital images werecaptured every 500 ìm; every 2 cm a 500 ìm wholebrain slice was obtained and cut by a 1.5 cm2 griddie cutter as shown in Fig. 1. Once a digital imageof this grid cut slice was obtained for later warping(thawing occurred for 1 min) it was stored atÿ708C for later biochemical analysis.Image processing Sectioning of the block face, withdigital capture after each 500 ìm cut, resulted in 320images of high resolution (1472 3 1152 3 320; with114 ìm2 pixels). This digital volume was then reduced to a 10.2 Mbyte le (368 3 288 3 159; onepixel 457 ìm2 and z 1 mm). The background andnonbrain tissue were digitally removed from thisdataset and a surface model was constructed. Giventhe minimal anatomic deformation resulting fromcryo-preparation, the premortem FDG-PET wasthen coregistered to the digital cryo dataset using asix parameter rigid body algorithm rather than amultiparameter transformation. A surface model ofthe patient's brain derived from the reconstructedcryosectioned dataset with the coregistered FDGPET is shown in Fig. 1. Any slice in this model canbe viewed on a computer screen and serves as aspatial reference for both the premortem PET andthe fresh frozen tissue slices.Digital images of the tissue sections acquired forbiochemical analysis were then registered to thereference cryo-space using a 3D elastic warpingalgorithm described previously [12,15]. Brie y, target and reference contours drive the warp to correcttissue deformation. The algorithm treats tissue as anelastic material and pulls the anchored contours,
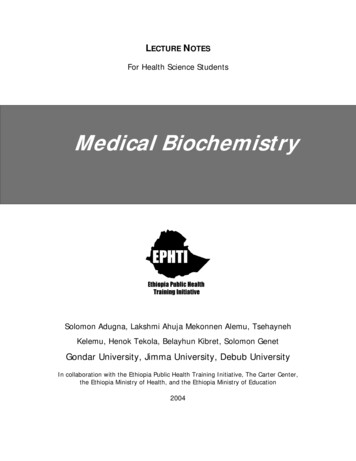
Mapping biochemistry to metabolismNeuroReportFIG. 1. Biochemical analysis was accomplished with the cryomacrotome harvested snap frozen tissue. Using a grid die cutter 1.5 cm2 samples wereobtained and stored for future analysis. The location of each grid sample within the slice is referenced to this digital image that will subsequently beelastically warped back into the cryo-space that allows 3D reconstruction and PET registration.interactively drawn on the sections, into registerwith the corresponding target contours of the cryoimage. The elastic warp was performed on grid slicesobtained every 2 cm from the anterior to posteriorlimit of the brain in the coronal plane. The result ofthese deformation corrections applied to a freshfrozen section is shown in Fig. 2. Registration of thePET data with the cryo structural volume wasaccomplished with a six parameter rigid body alignment [18] to minimize PET voxel distortion. Excellent registration can be achieved for the purpose ofPET comparisons using this approach even whenthe harvesting process distorts the tissue from itsoriginal morphology (Fig. 2b,c).The mean FDG-PET values produced by eachgrid sample was determined by drawing regions ofinterest (ROIs) on the elastically warped grid imageand then transferring them onto the PET imageresampled in cryo-space (Fig. 2d). The CSF andwhite matter (WM) space was excluded from theseROIs by drawing outlines around only grey matter(GM) on the warped grids. From the high resolutioncryomacrotome image the quantity of GM pixels(with a known dimension of 0.457 3 0.457 mm) wasVol 10 No 14 29 September 19992913
NeuroReportM. S. Mega et al.FIG. 2. The cryo-space is derived from a digital image of the tissue (a) prior to harvesting from the whole brain block-face. The target outline is shownin red. The fresh frozen tissue section (b) is elastically warped back into the cryo-space using a modi ed 3D warping algorithm (c) [12]. Concentrationsof amyloid â-protein (Aâ) can be assayed from aliquots of the grid samples, outlined in blue (white matter and csf pixels are excluded in analysis), usinga sandwich ELISA with antibodies speci c to Aâ and compared to the mean FDG-PET intensity values referenced to a peak in the cerebellum (d) andco-registered to the cryo-space.calculated for each tissue sample. This GM pixelquantity was used to derive the volume of GM(mm3 ) in each 500ìm thick tissue sample producingthe metabolic data. By referencing the metabolic andbiochemical data to the volume of GM in each tissuesample suf cient correction of the partial volumeimaging error and differing GM proportions of thetissue samples can be achieved.Biochemical analysis: Cellular Aâ was quantitatedfrom 66 grid locations, of varying metabolic values,with a sandwich enzyme-linked immunoabsorbentassays (ELISA) [19] utilizing two Aâ peptide speci c antibodies. Mouse monoclonal 4G8 against Aâ aa17-24 (Senetek, Maryland Heights, MO) was used asthe capture antibody, loaded at a concentration of3 ìg/ml in 0.1 M carbonate buffer, pH 9.6 onto a 96well plate (Nunc Maxisorp). Blocking was com2914Vol 10 No 14 29 September 1999pleted with 2% bovine serum albumin (BSA) inTris-buffered saline (TBS). Centrifugation of thesesamples at 100 000 3 g at 48C occurred for 20 min.Aâ in the pellet (insoluble fraction), separated fromthe supernatant (soluble fraction), was extractedwith 70% formic acid. The suspended insolublefraction was then centrifuged at 100 000 3 g at 48Cfor 45 min to separate the lipid content. Processedand neutralized samples were diluted with EC buffer(20 mM Tris, 400 mM NaCl, 2 mM EDTA, pH 7.4with 1% BSA and 0.05% CHAPS) containingprotease inhibitors (20 ìg/ml each of pepstatin,aprotinin, leupeptin and phosphoramidon, 0.5 mMPMSF, 1 mM EGTA) and loaded into the wells. Thedetector antibody was biotinylated mouse monoclonal 10G4 against Aâ amino acids 5 13 [20], addedat a nal dilution of 1:1500 in TBS containing 1%BSA. The reporter system was streptavidin alkaline
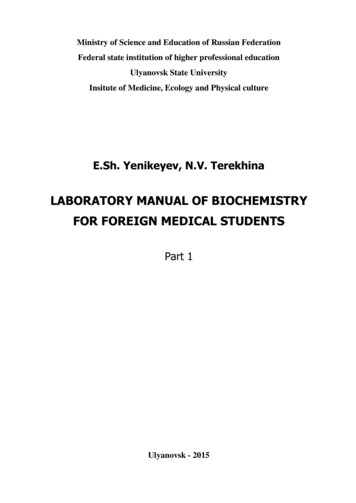
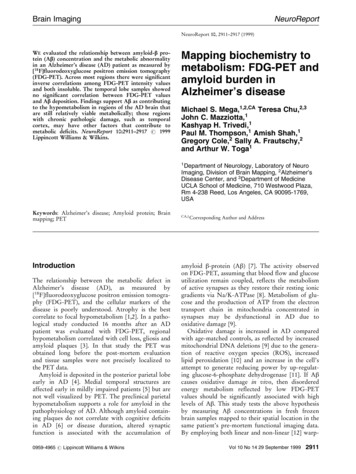
Mapping biochemistry to metabolismphosphatase (Vector Labs, Burlingame, CA) usingAttoPhos (JBL, St. Luis Obispo, CA) as the substrate. Fluorescence of the AttoPhos product wasmonitored at an excitation wavelength of 450 nmand an emission wavelength of 580 nm with aCytoFluor II plate reader (PerSeptive Biosystems,Bedford, MA). A standard curve over a range of0.02 to 10 ng was prepared from Aâ peptide andsubjected to four-parameter t by non-linear regression. Data (total Aâ 1-40 and 1-42 from samples)were analyzed by tting to the equation derivedfrom the standard curve. Since all grid aliquots hadan equal volume, results are reported as ng of Aâconcentration in each sample referenced to thevolume of GM in each grid.Statistical analysis: Pearson correlations were computed for all FDG-PET intensity values (referencedto a peak in the cerebellum), with the Aâ levels.Because the PET and Aâ data did not generate anormal distribution, a bootstrap analysis [21] wasemployed to test the signi cance of the correlations.The program Resampling Stats was used to evaluatesigni cance. Brie y, bootstrap analysis randomlymixes one of the dataset pairs (e.g. the PET measures) and a new r value is calculated based upon thisrandomization of the dataset pairing. This possible rvalue is recorded and the above procedure isrepeated 1000 times, producing a distribution ofpossible r values from the observed dataset. Theobserved r value can then be compared with thedistribution of the possible r values between randomized PET and Aâ data. The probability of ndingthe observed correlation based upon the distributionof possible correlations generated from the samedataset by resampling is then recorded. This processwas repeated 10 times for each of the correlationsreported to arrive at an average probability value foreach comparison. If the observed correlation isgreater than 95% of the correlations expected fromrandom resampling in the bootstrap method, theobserved difference was judged to be statisticallysigni cant at the 0.05 level.ResultsA regional analysis of the mean FDG-PET intensityvalues (referenced to a peak in the cerebellum) andAâ tissue concentrations for both the soluble andinsoluble fractions is shown in Fig. 3. The highestPET values were in regions with the lowest Aâlevels (cerebellum, thalamus and putamen); as Aâlevels increased from subcortical to cortical regionsmean PET values declined. Across the cortex regional mean PET values increased from the temporallobes spreading anteriorly and posteriorly, with theNeuroReporthighest regional anterior metabolic activity in theanterior cingulate, and posteriorly in the medialoccipital lobe.Total brain samples showed a signi cant inverserelationship among FDG-PET values and insoluble(r ÿ0.59, p , 0.001) and soluble (r ÿ0.42, p 0.001) Aâ ( ng/mm3 GM), however regional analysisshowed stronger correlations among FDG-PET values and insoluble Aâ (ng/mm3 GM) across theparieto-occipital (r ÿ0.71, p , 0.001) and prefrontal (r ÿ0.67, p , 0.001) tissue samples. Soluble Aâdemonstrated a signi cant inverse correlation withFDG-PET values in the parieto-occipital (r ÿ0.67,p , 0.001) and prefrontal samples (r ÿ0.41,p 0.05). The temporal lobe samples showed nosigni cant correlation between FDG-PET valuesand Aâ deposition. Figure 4 shows the relationshipbetween Aâ tissue fractions and the regional meanFDG-PET values for the entire dataset.DiscussionThis is the rst study to map a biochemical markerof disease, using fresh frozen brain tissue, to itsspatial location in the same patient's pre-mortemfunctional imaging data. Linear and nonlinear [12]warping algorithms corrected the spatial misalignments and tissue deformities to allow metabolic/biochemical analysis of human brain tissue. Theinitial application of this methodology in our patienthas implicated Aâ as contributing to the metabolicabnormalities seen on FDG-PET in AD in prefrontal and parieto-occipital but not temporal regions.The present ndings of a signi cant inverse relationship between prefrontal and parieto-occipital cortical FDG-PET values and Aâ concentration in asingle patient should be interpreted cautiously, theproximity of PET prior to death (8 h) nonethelessprovides a rare opportunity for some preliminaryobservations. The high prefrontal Aâ levels found inthis advanced AD patient are consistent with aposterior to anterior progression of plaque formation in AD [4,14]. The similar signi cant inverserelationship between Aâ concentration and meanFDG-PET values in the parieto-occipital region alsosupports the role of Aâ in the pathophysiology ofaltered synaptic metabolism.Neuritic plaques consist of neuritic processes withassociated proteins including Aâ (in an insolubleform), apolipoprotein E, immune components, andother moieties. The aggregation of Aâ is probably adynamic process initiated by the Aâ 1-42 amino acidsequence which precipitates the more soluble Aâ 140 protein [22]. Aâ is toxic to cultured neurons,increasing their vulnerability to metabolic insultsVol 10 No 14 29 September 19992915
NeuroReportM. S. Mega et al.FDG-PETAβ InsolubleAβ soluble1600.0175FDG-PET Intensity (mean)0.01251400.011300.0075Aβ (ng)/mm3 GM0.0151501200.0051100.00251000.00Cerebellum OccipitalFIG. 3. Mean Aâ tissue concentration and regional FDG-PET intensity (referenced to a peak in the cerebellum) for all 66 samples, (error bars re ects.e.m.). The putamen had a single sample from the left.SoubleInsolubleTotal Samples165r 5 2.42, p 5 0.001 (soluble)r 5 2.59, p 5 0.001 (insoluble)1551451351251151059585r 5 2.67, p , 0.001 (soluble)r 5 2.71, p , 0.001 (insoluble)150FDG-PET IntensityFDG-PET IntensityParieto-occipital Samples14013012011010000.005 0.01 0.015 0.02 0.025 0.03 0.035Aβ Concentration ng / GM mm300.0050.010.0150.020.025Aβ Concentration ng / GM mm3FIG. 4. Relationship between the soluble and insoluble Aâ tissue fractions (for all 66 samples) and FDG-PET intensity (referenced to a peak in thecerebellum) in the parieto-occipital region. Note the curves for the soluble and insoluble Aâ levels from the parieto-occipital samples are superimposed.[23 26]. Damage may rst effect the most metabolically active component of the neuron, the synapse.The poor inverse association in the temporal lobesbilaterally may implicate other disease mechanismsbesides Aâ accumulation. Synaptic loss, diaschisis,or neuro brillary tangles burden may better explainthe metabolic defect in this region. If Aâ aggregationis a dynamic process then the lower average levels ofAâ in the temporal lobes may represent chronicchanges and possibly clearance. Severe neuronal lossin the temporal region due to years of active diseasemay result in low levels of soluble Aâ production.Thus, the low mean FDG-PET values and low Aâconcentrations across most temporal regions mayindicate that the acute disease process no longer2916Vol 10 No 14 29 September 1999affects this region and only the chronic effects of thedisease are present in this patient. This lack of anassociation may re ect greater partial volume errorin the temporal region not suf ciently corrected byour ROI method but this should also be the case inthe prefrontal and parietal regions which also hadsevere cortical atrophy yet showed a robust correlation.Future studies should map other markers acrosspatients to enable a better understanding of thepathologic basis of the metabolic abnormalities inAD. Understanding the pathologic correlates ofPET abnormalities in AD will also aid our interpretation of the functional imaging changes in agingand other disease processes.
Mapping biochemistry to metabolismReferences1. Jamieson DG, Chawluk JB, Alavi A et al. J Cerebr Blood Flow Metab 7, S410(1987).Fazekas F, Alavi A, Chawluk JB et al. J Nucl Med 30, 1607 1615 (1989).McGeer PL, Kamo H, Harrop R et al. Neurology 36, 1569 1574 (1986).Arnold SE, Hyman BT, Flory J et al. Cerebr Cortex 1, 103 116 (1991).de Santi S, de Leon MJ, Rusinek H et al. Selective medial temporal lobepathology in cases at risk for Alzheimer's disease: diagnostic role of positronemission tomography. In: Iqbal K, Mortimer JA, Winblad B et al., eds. ResearchAdvances in Alzheimer's Disease and Related Disorders. New York: John Wiley,1995: 173 180.6. Terry RD, Masliah E, Salmon DP et al. Ann Neurol 30, 572 580 (1991).7. Terry RD, Maslaih E, Hansen LA. Structural basis of the cognitive alterations inAlzheimer disease. In: Terry RD, Katzman R and Bick KL, eds. AlzheimerDisease. New York: Raven Press, 1994: 179 196.8. Kadekaro M, Crane AM and Sokoloff L. Proc Natl Acad Sci USA 82, 6010 6013(1985).9. Mecocci P, MacGarvey U and Beal MF. Ann Neurol 36, 747 751 (1994).10. Palmer AM and Burns MA. Brain Res 645, 338 342 (1994).11. Balazs L and Leon M. Neurochem Res 19, 1131 1137 (1994).12. Thompson PM and Toga AW. IEEE Trans Med Imaging 15, 1 16 (1996).13. McKhann G, Drachman D, Folstein M et al. Neurology 34, 939 944 (1984).14. Braak H and Braak E. Acta Neuropathol 82, 239 259 23.24.25.26.Mega MS, Chen SS, Thompson PM et al. Neuroimage 5, 147 153 (1997).Barrio JR, MacDonald NS, Robinson GD et al. J Nucl Med 22, 372 375 (1981).Siegel S and Dahlbom M. IEEE Trans Neurol Sci 39, 1117 1121 (1992).Woods RP, Mazziotta JC and Cherry SR. J Comput Assist Tomogr 17, 536 546(1993).Suzuki N, Cheung TT, Cai XD et al. Science 264, 1336 1340 (1994).Yang F, Mak K, Vinters HV et al. NeuroReport 5, 2117 2120 (1994).Efron B and Tibshirani R. Science 253, 390 395 (1991).Iwatsubo T, Mann DM, Odaka A et al. Ann Neurol 37, 294-299 (1995).Koh J-Y, Yang LL and Cotman CW. Brain Res 533, 315 320 (1990).Yankner BA, Duffy LK and Kirschner DA. Science 250, 279 282 (1990).Mattson MP, Cheng B, Davis D et al. J Neurosci 12, 379 389 (1992).Mark RJ, Hensley K, Butter eld A et al. J Neurosci 15, 6239 6249 (1995).ACKNOWLEDGEMENTS: Grant Support for this work was provided by an NIA award(K08AG100784) to M.S.M., Human Brain Project (NIMH/NIDA: P20MH/DA 52176),NSF (BIR9322434), NLM (LM/MH05639), and NCRR (RR05956) to A.W.T., and anAlzheimer's Disease Center grant (AG 10123). Special appreciation goes to the familyof the patient for their kindness and accommodation.Received 21 June 1999;accepted 30 July 1999Vol 10 No 14 29 September 19992917
0959-4965 # Lippincott Williams & Wilkins Mapping biochemistry to metabolism: FDG-PET and amyloid burden in Alzheimer's disease Michael S. Mega,1,2,CA Teresa Chu,2,3 John C. Mazziotta,1 Kashyap H. Trivedi,1 Paul M. Thompson,1 Amish Shah,1 Gregory Cole,2 Sally A. Frautschy,2 and Arthur W. Toga1 1Department of Neurology, Laboratory of Neuro


![Clinical significance of incidental [18 F]FDG uptake in the .](/img/32/s12876-016-0545-x.jpg)