Transcription
CMC-IM Working 28293031Pharmaceutical DevelopmentCase Study: “ACE Tablets”Prepared by CMC‐IM Working GroupMarch 13, 2008Version 2.0Intended for DistributionACE tablets V2.0Page 1March 13, 2008
CMC-IM Working Group323334CONTENTS35Foreword . 836Acknowledgements . 9371. Report on the Pharmaceutical Development of Acetriptan Tablets . 10381.1 Introduction and Overview . 10391.2 Target Product Profile . 10401.3 Formulation and Pharmaceutical Manufacturing Selection . 12411.4 Control Strategy . 13422. Selection of the Components of the Drug Product . 14432.1 Drug Substance . 14442.2 Excipients . 14453. Drug Product Formulation Development . 16463.1. Formulation Development Overview . 16473.2 Development of a Discriminatory Dissolution Method . 17483.3. Biopharmaceutics and Pharmacokinetics of ACE . 18493.4 Prototype Formulation and Process Selection . 18503.4.A Formulation Component Level Definition Study. 20513.4.B API Particle Size and Magnesium Stearate Interaction Study. 25523.5 Summary of Formulation Component Studies . 28534. Manufacturing Process Development . 29544.1 Overview . 29554.1.A Summary of the selected process . 29564.2 Process Optimization – Blending Unit Operation. 31574.2.A Method for Determining Blend Homogeneity . 31ACE tablets V2.0Page 2March 13, 2008
CMC-IM Working Group584.2.B Critical Parameters Affecting the blend homogeneity . 32594.2.C Scale-up of the Blending Process . 35604.2.D Conclusion for Blending . 36614.3 Process Optimization – Roller Compaction Unit Operation . 37624.3.A Introduction . 3763644.3.B Failure Modes, Effects and Criticality Analysis (FMECA) approach toRoller Compaction . 3865664.3.C Initial Quality Risk Assessment (QRA-1) for the roller compaction andmilling stages . 38674.3.D Process Development Work . 40684.3.E DoE-2: Roller compaction response surface . 46694.3.F Roller Compaction and Milling Conclusions . 51704.3 G Second Risk Assessment for Compaction and Milling (QRA-2) . 53714.4 Process Optimization – Lubrication Unit Operation . 55724.4 A Lubrication Blending . 55734.5 Process Optimization – Tablet Compression Unit Operation . 58744.5.A Introduction . 58754.5.B Compression DoE 2 . 61764.5.C Compression DoE 3 . 68774.6 The In vivo investigation . 75784.6.A Rationale for study ACEPK0015 . 75794.6.B Clinical pharmacokinetic study (ACEPK0015). 75804.6.C Results . 76814.6.D Exploration of an in vitro-in vivo correlation for ACE tablets . 78824.7 Summary Control Strategy for the ACE Tablets Manufacturing Process . 79834.7.A Overview. 79ACE tablets V2.0Page 3March 13, 2008
CMC-IM Working Group844.7.B Unit Operation Control Strategy . 82854.7.C Control of Drug Product Critical Quality Attributes . 85864.7.D Control Strategy Conclusion. 87875. Container Closure System . 87886. Microbiological Attributes. . 87897. Summary of the Manufacturing Procedure . 88907.1 Manufacturing Formula for ACE 20 mg Tablets . 8891927.2 Description of Manufacturing Process and Process Controls for ACE, IRTablets . 89937.2.AProcess Flow Diagram . 89947.3 Description of Manufacturing Process. 89957.4 Primary packaging. 91968. Control of Critical Steps and Intermediates for ACE Tablets . 91978.1 Control of Drug Product . 91988.1.ASpecification for ACE 20 mg Tablets . 9199ACE tablets V2.0Page 4March 13, 2008
CMC-IM Working 1132133134135136137138139140141142143144145LIST OF FIGURESFigure 1: Plot of % Target Tablet Weight vs % Label Claim for Individual Tablets Testedfrom Formulation Definition Study . 22Figure 2: Interaction profile for Hardness Response at Fixed Compression Pressure. . 22Figure 3: Interaction Profile for Dissolution Response at a Set Target Tablet Hardness of12kP. . 23Figure 4: Contour plot of Dissolution response for 10% drug load at a set Target TabletHardness of 12kP . 24Figure 5: Interaction profile for Weight %RSD Response at Fixed Compression Pressure. 25Figure 6: Interaction profile for Hardness Response at Fixed Compression Pressure. . 26Figure 7: Interaction profile for Tablet Weight % RSD Response at Fixed CompressionPressure. . 27Figure 8: Contour Plot of Dissolution at a Set Target Tablet Hardness of 12kP. . 28Figure 9: Manufacturing Process Flow for ACE tablets . 30Figure 10: Correlation of Blend NIR CV with Tablet Content Uniformity RSD . 32Figure 11: Cause and Effect Diagram for Blend Uniformity . 32Figure 12: Blend Contour plots. 34Figure 13: NIR output of DoE Blending Experiments (Representative Results) . 34Figure 14: Blending Control Data. 36Figure 15: Process Map for Roller Compaction and Milling . 38Figure 16: Initial Quality Risk Assessment (QRA-1) for the Roller Compaction andMilling stages . 39Figure 17: Half-normal Plot and ANOVA for Effects on Ribbon Density . 42Figure 18: Relationship between Roller Pressure and Ribbon Density . 43Figure 19: Half-normal Plot and ANOVA for Effects on GSA. 44Figure 20: The Effects of Mill Screen Size and Mill Speed (600 or 1200 rpm) on GSA. 45Figure 21: Half-normal plot and ANOVA for effects on tablet dissolution . 46Figure 22: Contour plot for API particle size and roller pressure versus tablet dissolution(% at 30 mins) with a 1% magnesium stearate level . 47Figure 23: Contour plot for API particle size and roller pressure versus tablet dissolution(% at 30 min) with a 1.5% magnesium stearate level . 48Figure 24: Contour plot for API particle size and roller pressure versus tablet dissolution(% at 30 min) with a 2% magnesium stearate level . 48Figure 25: Confirmed Linear Relationship between Roller Pressure and Ribbon Density 49Figure 26: Description of Parameters associated with Roller Compactor . 50Figure 27: Scale independent Relationship Illustration . 51Figure 28: Roller Compaction: Summary of Cause and Effect Relationships identifiedfrom Process Development Studies . 52Figure 29: NIR in-process control feedback loop . 53Figure 30: Final Risk Assessment (QRA-2) for the Roller Compaction and Milling Stages. 54Figure 31: Effect of Blending Parameters on Tablet Hardness . 57Figure 32: Effect of Blending Parameters on Drug Release at 30min . 57Figure 33: ACE Tablet Compression Process Flow . 59ACE tablets V2.0Page 5March 13, 2008
CMC-IM Working 161162163164165Figure 34: IPO Diagram for ACE Compression Step . 60Figure 35: Effect of Compression Force on Tablet Hardness. 63Figure 36: Effect of Compression Force on Tablet Dissolution at 15min . 65Figure 37: Correlation between Tablet Hardness and Dissolution at 15 Minutes . 65Figure 38: Effect of Compression Force on Tablet Dissolution at 30min . 66Figure 39: Correlation between Tablet Hardness and Dissolution at 30 Minutes . 66Figure 40: Correlation between Disintegration Time and Dissolution at 30min . 67Figure 41: Example Plots of Dissolution versus Hardness for Different Tablet Variants . 70Figure 42: Tablet Content Uniformity: data plot for one of six tablet batches . 71Figure 43: Plot of %Target Weight versus % label Claim. 72Figure 44: Representation of Proven Acceptable Ranges for Compression . 73Figure 45: Average dissolution of all 5 tablet variants in the 1% SLS method . 77Figure 46: Average plasma concentration-time profiles (0 to 48 hrs) for 20 mg ACE IRvariants and oral solution (geomean, n 12) . 79Figure 47: Control Strategy for CQAs for ACE Tablets . 82Figure 48: Control Strategy for Blending . 83Figure 49: Control Strategy for Roller Compaction . 84Figure 50: Control Strategy for Compression . 85ACE tablets V2.0Page 6March 13, 2008
CMC-IM Working 7198199200201202203204205206207208LIST OF TABLESTable 1:Target Product Profile. 11Table 2: Risk Assessment to Identify Variables Potentially Impacting Product Quality . 12Table 3: Potential impact of API Attributes on Drug Product Attributes . 14Table 4: Excipients in ACE tablets . 15Table 5: Potential impact of Excipients on Drug Product CQAs . 16Table 6: Formulation Composition Risk Assessment . 20Table 7: Risk Matrix for Drug Product CQAs for each unit operation . 30Table 8: Process Parameter Ranges for Blending . 31Table 9: Risk Matrix Table for Blending Unit Operation. 33Table 10: Summary of Scale Up Blending Parameters . 35Table 11: Input attributes for Blending Operation . 36Table 12: Risk Matrix Table for Blending Unit Operation after Controls . 37Table 13: Process Parameter Targets for Lubrication. 55Table 14: Cause and Effect Matrix Risk Analysis for Lubrication . 55Table 15: DoE Results: AQL Observations as a Response to Fill Ratio and Number ofRevolutions ( 25 cosmetic observations acceptable) . 56Table 16: Cause and Effect Matrix Risk Analysis for Lubrication . 58Table 17: Summary of Scale Up Lubrication Parameters . 58Table 18: Summary of High Potential Risks from ACE Compression Step FMEA . 60Table 19: Potentially Important Compression Process Variables and Quality Attributes . 61Table 20: Process parameters ranges investigated in compression DoE 2 . 62Table 21: Effect tests for Hardness . 63Table 22: Effect tests for 15min Dissolution . 64Table 23: Effect tests for 30min Dissolution . 65Table 24: Effect tests for Disintegration Time . 67Table 25: Output Attributes for Compression Unit Operation . 68Table 26: Input variables and process parameter ranges investigated . 69Table 27: Example compression process operating conditions . 70Table 28: Updated Compaction FMEA . 74Table 29: Composition of ACE 20mg Tablets used in Study ACECPK00015 . 76Table 30: Mean Pharmacokinetic Parameters for the ACE Tablet Variants (AUC0- , Cmax,tmax and t1/2) all represented as Geometric Mean Values . 78Table 31: Overall Risk Assessment Updated in line with Process UnderstandingDeveloped . 80Table 32: Summary of overall Design Space for ACE tablets . 81Table 33: Manufacturing Formula for ACE 20 mg Tablets . 88Table 34. Critical Process Steps and associated Intermediates. 91Table 35. Specification for ACE 20 mg Tablets . 92ACE tablets V2.0Page 7March 13, 2008
CMC-IM Working ordThe last decade has seen a significant transformation in pharmaceutical quality regulationfrom an empirical process to a more science and risk based approach. This case study isan extremely important document for helping guide FDA and the industry toward the“desired state” of pharmaceutical quality envisioned for the 21st Century. It is throughthis and similar documents that we can determine how best to implement the principles ofICH Q8, Q9, and Q10 to meet the requirements of this new regulatory paradigm.I believe this case study, and others like it, will provide a foundation for discussion withour scientific and regulatory constituents within industry and with our global regulatorycolleagues in other agencies. Such documents are necessary to enable dialogue andunderstanding of what we all mean and expect from the ICH paradigms, and to ensure anappropriate framework for future regulatory processes, including both review andinspection of all pharmaceuticals. Not only does this case study provide a basis forunderstanding and commitment to the process, it also helps identify the opportunities thatcan be gained through the enhanced scientific experience and knowledge sharing.I want to personally thank Conformia, FDA’s CRADA partner, the CMC-IM WorkingGroup team that Conformia convened and all of those individuals who contributed tocreating this Pharmaceutical Development Case Study on ACE Tablets . I truly believethat it will be invaluable to all of us in moving forward in implementing a modernapproach to the regulatory processes. This case study is a perfect example of howscientific collaboration can lead to synergism across our regulatory programs in order tobetter serve the public.Helen Winkle, Director, Office of Pharmaceutical Sciences, CDER, FDAACE tablets V2.0Page 8March 13, 2008
CMC-IM Working wledgementsThe acetriptan tablets (ACE) case study that follows is the first deliverable froman industry led, not-for profit, working group focused on two areas ofimplementation around the ICH Quality vision: track 1) a chemistry,manufacturing and controls focus and track 2) an information management /knowledge management focus. This group, called the CMC-IM Working group, iscomprised of Abbott Laboratories (Abbott), AstraZeneca (AZ), Conformia, EliLilly and Company (Eli Lilly), GlaxoSmithKline (GSK) and IBM Global BusinessServices (IBM).Special thanks are due to the CMC-IM Working Group members who helpedauthor “ACE”: Liam Feely (Abbott), Ken Cline (Abbott), Steve Laurenz (Abbott)Shuhong Zhang (Abbott), Julie Garren (Abbott), Mike Hannay (AZ), Anna Ahern(AZ) Bryan Mobbs (AZ), John Smart (AZ), Liuda Shtohryn (AZ), John Berridge(Conformia), Vineet Gulati (Conformia), Anjali Kataria (Conformia), Ken Morris(Conformia), Joe Prang (Conformia), Sam Venugopal (Conformia), DavidMaclaren (Eli Lilly), Jeff Hofer (Eli Lilly), Eric Jensen (Eli Lilly), Lindsay Wylie(GSK), Norma Collinsworth (GSK), Jo Craig (GSK), Vance Novak (GSK), RayStevens (GSK), Richard Young (GSK), Dennis Bell (IBM), Marc Weisenberg(IBM) and Charlie Honke (IBM).We also acknowledge EFPIA’s Examplain mock P2 discussion paper, which gaveus the ability to see that a more comprehensive case study could be used toimprove transparency and change the nature of dialogue between industryand regulators.Anjali Kataria, Chief Marketing Officer and Founder of ConformiaPrincipal Investigator, FDA-Conformia CRADAACE tablets V2.0Page 9March 13, 2008
CMC-IM Working 03013023033043053063073083091. Report on the Pharmaceutical Development of AcetriptanTablets1.1 Introduction and OverviewThis report presents a summary of the pharmaceutical development of acetriptan (“ACE”)tablets. It emphasizes a science and risk-based approach to product and processdevelopment, and presents findings as a knowledge-based report. Where relevant,supporting data have been summarized in appropriate tables or illustrationsThe scientific approach used begins with identification of the desired dosage form andperformance attributes through the target product profile. From this target product profile,an initial list of critical quality attributes was developed. A risk assessment wasundertaken to identify the variables and unit operations which are most likely to impactthe critical quality attributes. This was then used to focus development activities onpotential high risk areas. A risk assessment, starting with the physico-chemicalcharacteristics of the API, led to the identification of a viable formulation andmanufacturing approach. Formulation development involved the use of prior knowledgeand structured experimentation to investigate the relationship between formulationcomponent levels, API attributes and the drug product quality attributes. An interactionbetween API particle size and magnesium stearate level was demonstrated and acceptableformulation component levels and API particle size ranges were identified. Developmentof the manufacturing process focused on the unit operations posing greatest potential riskto drug product quality. Using prior knowledge, models, extrapolation and risk assessmentprocesses, the material attributes and process parameters, which could have an impactupon final product quality, were identified. For each unit operation experimentation wasundertaken to define the relationship between the input attributes, process parameters,output attributes and final drug product quality. The intermediate critical qualityattributes, operating conditions and a control strategy were defined to mitigate risk andensure final product quality. An in-vivo study was then conducted to compare formulationand manufacturing variables. This study revealed that the dissolution test procedureprovided excellent prediction of biopharmaceutical performance, but that the initialacceptance criterion needed to be modified. Based on the pharmaceutical developmentwork and in-vivo results, a design space and science and risk-based approaches toformulation component level adjustment, scale-up, site transfers and ‘real time release’are proposed based on the enhanced product and process understanding.1.2 Target Product ProfileACE tablets are being developed for the treatment of migraine. The intent is to develop arapid onset therapy which will provide relief of the symptoms of migraine.The pharmaceutical target profile for acetriptan is a safe efficacious convenient dosageform, preferably a tablet, that will facilitate patient compliance. The tablet should be of anACE tablets V2.0Page 10March 13, 2008
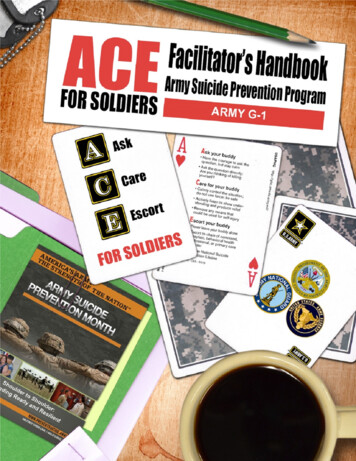
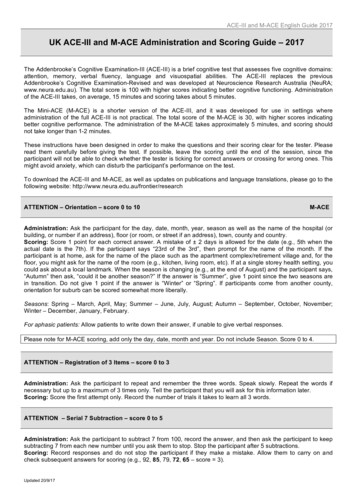
CMC-IM Working te size, with a single tablet per dose. The manufacturing process for the tabletshould be robust and reproducible, and should result in a product that meets theappropriate drug product critical quality attributes, for example identity, assay,appearance, chemical and microbiological purity, disintegration and/or dissolution as wellas content uniformity. The drug product should be packaged in a container closure systemthat will provide adequate protection from moisture vapour, protection throughdistribution and use as well as convenience of use for the patient.A Target Product Profile is presented in the Table 1: below. From the profile, the initialCritical Quality Attributes which were used to define satisfactory quality were identified.Table 1:Target Product Profile322QualityAttributeDosage formTargetCriticalityTablet, maximum weight200mgPotency20 mgPharmacokinetics Immediate release enablingTmax in 2 hours or lessAppearanceTablet conforming todescription shape and sizeIdentityPositive for acetriptanAssay95 – UniformityResistance ationMicrobiologyACE12345 NMT 0.5%,other impurities NMT 0.2%,total NMT 1%NMT 1%Meets USPNot applicableNot applicableRelated to dissolutionCriticalNot critical – API not sensitiveto hydrolysisCritical5-12kPNot critical since related todissolutionNMT 1.0%Consistent with immediaterelease, e.g., NLT 75% at30minsNMT 15minsNot criticalCriticalIf testing required, meets USPcriteriaNot critical, a precursor todissolutionCritical only if drug productsupports microbial growth323ACE tablets V2.0Page 11March 13, 2008
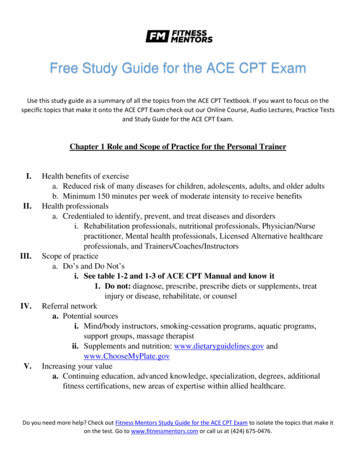
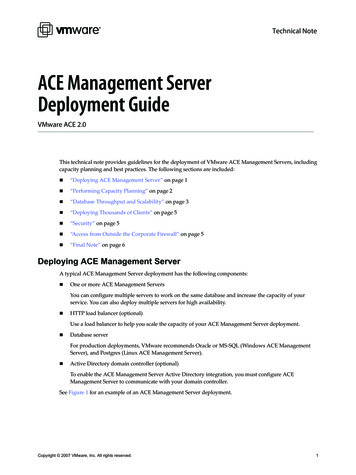
CMC-IM Working 3393403413423433443453461.3 Formulation and Pharmaceutical Manufacturing Selection347348Table 2: Risk Assessment to Identify Variables Potentially Impacting ProductQuality349350351352353354355356357358359The formulation type chosen was an oral standard release tablet, in consideration of theknown PK characteristics of the molecule. A rapid onset is desirable for the treatment ofmigraine and a Tmax of less than 2 hours was desired, and subsequently achieved, with thisformulation.A roller compaction granulation process was chosen based on prior scientific knowledgeof products with similar physical and chemical properties, and available technologies andequipment. Factors that influenced the selection of a roller compaction process were: 1)degradation of the drug on exposure to heat precluding drying following wet granulation,and 2) poor flow properties precluding direct compression. Thermal degradation alsoprecluded drying following film coating. Roller compaction was also chosen in theexpectation of its meeting the expectation of its suitability for operating with excipientswhich are compatible with acetriptan, active pharmaceutical ingredient (API)processability and API stability requirements during manufacture, and since it shouldresult in a tablet that will have a shelf life of at least 2 years.The development of ACE tablets and the associated manufacturing process used priorknowledge from previous products and development projects. A risk analysis, inaccordance with ICH Q9, was used to establish which variables and unit operations werelikely to have the greatest impact on product quality. This initial risk assessment is shownin Table 2 below.The boxes shaded green were concluded, through prior knowledge, to present lowrisk to the product critical quality attributes. The red boxes represent potential risks to theproduct and formed areas for further study during development.The proposed commercial formulation is an immediate release tablet. Only one tabletstrength is proposed for commercialization, a 200 mg tablet containing 20 mg ofacetriptan. Each tablet contains the following excipients: microcrystalline cellulose,lactose monohydrate, croscarmellose sodium, magnesium stearate and talc. Themanufacturing process involves a preblending step, roller compaction of the acetriptanACE tablets V2.0Page 12March 13, 2008
CMC-IM Working Group360361362363364365366367368369370371372with microcrystalline cellulose, croscarmellose sodium, magnesium stearate and lactosemonohydrate, then milling to produce granules before blending with magnesium stearate,and talc. This is then followed by compression on a rotary tablet press. ACE tablets areproposed to be supplied as white, biconvex, round tablets containing 20 mg of acetriptanidentified with “ACE” and “20” debossed on one side, in cartons containing a blister packof 6 tablets, or in polypropylene bottles containing 10 tablets. Further information on thepackaging is provided under Container Closure System, Section 5.3733743753
203 Table 32: Summary of overall Design Space for ACE tablets . 81 204 Table 33: Manufacturing Formula for ACE 20 mg Tablets . 88 205 Table 34. Critical Process Steps and associated Intermediates . 91 206 Table 35.