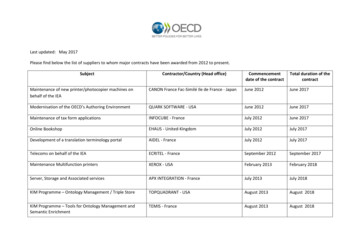
Transcription
July – September 2017
OverviewSnapshot of Experian Total Revenue: US 4.3bnBenchmark EBIT: US 1.2bnMarket Cap*: c. 16bnIn top 50 of FTSE-100Employees: c.16,000Offices in 37 countriesLargest markets: US, Brazil, UKCorporate headquarters: DublinExperian is the world’s leading globalinformation services company. Our roots lie inassessing credit risk; today we do much more.2 Experian PublicFor the year ending 31 March 2017* At 14 July 2017
OverviewThe Experian investment caseMarket leading global information company Unique proprietary data, coupled withanalytics and software Scalable business modelStrong market positions No. 1 or 2 position across our largest markets High barriers to entrySignificant growth potential By bringing our assets together to access newmarket opportunitiesStrong financial track record High quality, recurring revenues Highly cash generative with low capital intensity3 Experian Public
OverviewExperian business ServicesConsumerServices Large databases ofinformation, used tomanage risk Helping clients to: Lend effectively Data quality andmanagement Direct to consumercredit monitoring Minimise the riskof fraud Targeting relevantoffers to individuals Credit matchingservices / leadgeneration 17 consumer creditbureaux 11 business creditbureaux Automotiveinformation Using advancedsoftware andanalytics, and expertconsulting Identity theftprotection services Affinity (white label)credit and identitymonitoring services Health55%4 Experian Public13%% split of revenue shown for the year ending 31 March 2017.10%22%
OverviewGlobal revenue FY17EMEA/Asia Pacific8%ByregionUK andIrelandBy customer segment19%Financial services56%LatinAmerica3% 2%NorthAmericaDirect to consumer4%Healthcare5%17%5%33%5%Automotive7%Telco and isionAnalyticsRetailInsurance17%10%19%Media technologyPublic ervices22%Diverse portfolio by region, business activity and customer segment
OverviewMarket leader with unparalleled global reach and range5,0004,5004,3351Global revenue US 2%FICOAcxiom0ExperianEquifaxTransUnionNorth AmericaD&BOther regions1 Year ended 31 March 20173 Year ended 30 September 2016*US only.2 Year ended 31 December 2016Source: Latest full year revenue, company SEC filingsThis analysis covers traditional competitors that are publicly listed. It does not include companies where a single division competes against Experian.
Strategic overview7 Experian Public
Strategic overviewIn 2014, we set a clear plan of aloptimisation Simplified our portfolio Growth has returned to our target range Considerably improved performance in Brazil and Marketing Services Executing on a strategic repositioning of our relationship with consumers Driven substantial efficiencies from our business, and used the funds to invest Innovation is accelerating Rigorous approach to capital allocation8 Experian Public8
Strategic overviewWe have enhanced our foundations to drive betterperformance at lower costSuperior technologyOpen systemsCloud computingAPI HubAgile developmentGreater speed, accuracy and flexibilityImproved time to market with new productsEnhancing client access to our dataScaling our technology platforms across marketsOperating excellenceacross core functionsTransformed call centresIntroduced new standardsfor customer serviceInvestment in our people9Enhanced consumer experienceHigher client and employee retentionUnmatchedglobal footprintand offering Experian Public9
Strategic overviewDefining the path ahead: our growth objectivesBroaden and deepen our data assetsExtend our lead in analytics and software solutionsExploit the breadth of our capabilitiesAccelerate pace of innovationScale in targeted verticals and geographiesTransform engagement with consumers10 Experian Public
Strategic overviewBuilding engagement with consumers in North AmericaLendingWorks 9m free members, growing 0.5m permonth; accelerate through free FICO offer Shifting further to new revenue modelsduring FY18 LendingWorks: Over 200 card and personal loanproducts and growing Serves up the best offer forconsumers Prescreens using lenders’ exactcredit criteriawww.experian.com11 Experian Public11
Strategic overviewBuilding engagement with consumers in North AmericaIdentityWorks Combines capabilities of Experian andCSID Best-in-class features Lower price point Proven market demandwww.experian.com12 Experian Public12
Strategic overviewDelivering innovation to meet growing new customer needsB2B customer needs Deliver fast, efficient services in the digitalecosphere Undertake checks in real time to ensure a smoothcustomer experience while managing risks Counter risks from fraud while authenticatingpeople quickly Make sense of data across their wholeorganisation, to get a single view of their customer Know why a customer has missed a loan payment oris late paying a bill and deliver a better collectionsexperience13 Experian PublicExperian innovationData Data ingestion engine Alternative sources of data, including positive data Targeted digital advertising PandoraPlatforms CrossCore PowerCurve CollectionsAnalytics North America Credit Services DaaS Decision Analytics SaaSServices SerasaConnecta Digital Credit Marketing Universal Master Patient Index (UMPI) Text To Credit
Strategic overviewCase study: digital credit marketing update14 Experian Public14
Strategic overviewCase study: Text for CreditCurrent process15 Experian PublicText for credit option
Strategic overviewPowerCurve: better decisions, fasterStrategymanagementCollectionsPowerCurve Over 200installed clientsCustomermanagement16 Experian PublicOriginations
Strategic overviewCase study: PowerCurve Collections: a growing and sizeableopportunity Significant global opportunity Banking sector market c. US 0.5bn, plus telco, utilities Signed major Tier 1 bank in Australia as early adopter Pipeline growing and engagement across all regionsSource: IDC Banking IT Spending Guide H2 2014 (Custom Dataset for Experian), November 201417 Experian Public17
Strategic overviewLatin AmericaBrazilUnited rInformationEXPNCoreConsumerInformationEXPN18 ExperianEXPNEXPNEXPNEXPNFraud & SmallEXPNEXPNEXPNOthersFraud & IDModerateConsumerDirectAffinity MarketingServicesLargePositioned to capture the structural potential
Capital strategyOur medium-term financial frameworkOperating cash flow applicationOrganic business Structural growth Strong cash generation Strong core andportfolio optionalityMid single-digitorganic growthOrganicinvestmentPortfolioOptimised capital allocationStrong growth in Benchmark earnings per share19 Experian PublicShareholderreturns
Recent performance20 Experian Public
Recent performanceSummary of portfolio performanceTwo thirds of the portfolio growing in mid-high single digit for FY17FY17: 5% organic growth9%8%8%6%3%EMEA/APACCredit Services(2%)(3%)North AmericaConsumerServicesUK&ICreditServicesLatin AmericaCredit ServicesGlobal MarketingServicesNorth AmericaCredit ServicesGlobalDecision AnalyticsQ1 FY18(9)%UK&IConsumerServicesHorizontal axis indicates share of revenue excluding CSIdentity and vertical axis indicates organic revenue growth.21 Experian PublicTotal revenue growth6%Organic revenue growth4%
Recent performanceRevenue walkthrough 5% Group organic revenue growth4,477(313) 5% 9%LatinAmericaCCMFY16revenueincluding CCM122At actual FX rates Experian Public4,164FY16restatedrevenue 1%UK andIreland 9% 6% totalrevenuegrowth 4%1 APAC4,335NorthAmericaFY17revenue beforeFXFY17 reportedrevenue
Recent performanceCapital frameworkCapital summaryCapital allocation1,6001,400OtherIncrease innet debtAcquisitionsand minorityinvestments1,200 Signed agreement for the sale of CCMSharerepurchaseprogramme1,000800Funds fromOperations2600DividendsOrganic capitalinvestment2000Cashgenerated223Uses ofcashShare repurchases as at 31 March 2017.Funds from Operations is defined as Benchmark free cash flow plus organic capital investment (capital expenditure). Experian Public FY17 shareholder returns: Dividend growth of 4% US 353m1 net share repurchases completedduring the year4001 Organic innovation investment Expect to make US 600m of sharerepurchases in FY18.
SummaryInvesting in the growth of the futureInvesting for a better and stronger business,well positioned for future growth24 Experian Public24
Appendix25 Experian Public
AppendixModelling considerations for FY1826Net interest Expected to be in the range of US 80m to US 85mTax Benchmark tax rate between 26% and 27%.Foreign exchange Based on recent rates, expect foreign exchange to be neutral across FY18Capital expenditure Capital expenditure of 8-9% of revenueShare repurchases Full year WANOS expected to be in the region of 920m shares. Experian Public
AppendixRecent trendsOrganic revenue growth continues to be in our targetmid-single digit organic revenue growth range with high single-digit B2B 1527 Experian nic revenue growths for all prior periods are as reported and have not been restated for subsequent divestmentsB2B defined as Credit Services, Decision Analytics and Marketing ServicesQ3Q4Q1Q2FY16Q3Q4Q1Q2FY17Q3Q4Q1FY18
AppendixImpact of discontinued operationsYear ended 31 MarchRevenue (US m)CCM2017 includingCCM4,3353084,643Total revenue growth1 (%)66Organic revenue growth1 (%)54Continuing EBIT (US m)1,199EBIT margin (%)27.7Margin change vs FY161 30 bpsBenchmark EPS (US cents)88.41282017as reportedShown at constant currency Experian Public541,25327.04.092.4
AppendixBenchmark EBIT margin )%UK andIreland0.4%26.7%27.1%FY16 restatedBenchmarkEBIT marginEBIT margins calculated on an ongoing activities basis. Experian Public27.4%27.7%ForeignExchangeNorthAmericaFY16 CCMrestatementFY16 BenchmarkEBIT marginincluding CCM290.3%FY17 BenchmarkEBIT marginbefore FXFY17 reportedBenchmarkEBIT margin
AppendixRevenue and Benchmark EBIT by business activityTwelve months ended 31 MarchUS millionOrganicgrowthBenchmarkEBITmarginQ1 FY18OrganicgrowthRevenue20172016TotalgrowthCredit Services2,3892,2406%6%34.2%5%Decision Analytics5845669%9%20.5%13%Marketing Services4214078%8%22.6%12%Consumer Services9419512%(4)%25.8%(8)%Total revenue – ongoing activities4,3354,1646%5%Benchmark EBIT – ongoingactivities1,1991,1307%Benchmark EBIT margin27.7%27.1%30 Experian PublicAll results are Benchmark figures and are on an ongoing activities basis. Growth at constant exchange rates.The 2016 results have been restated to reflect the email/cross-channel marketing business ('CCM') reclassification as a discontinued operation.4%
AppendixRevenue and Benchmark EBIT by regionTwelve months ended 31 MarchUS millionRevenue20172016Totalgrowth%North America2,4572,2947531.8%4%Latin America7306319934.4%8%UK and Ireland8079241130.5%(3)%EMEA/Asia Pacific34131599(0.9)%7%Total revenue – ongoing activities4,3354,16465Benchmark EBIT – ongoing activities1,1991,1307Benchmark EBIT margin27.7%27.1%31 Experian PublicOrganicgrowth%BenchmarkEBITmarginQ1 FY18Organicgrowth %All results are Benchmark figures and are on an ongoing activities basis. Growth at constant exchange rates.The 2016 results have been restated to reflect the email/cross-channel marketing business ('CCM') reclassification as a discontinued operation.4%
AppendixNorth AmericaTwelve months ended 31 MarchUS millionOrganicgrowthQ1 FY18OrganicgrowthRevenue20172016TotalgrowthCredit Services1,3411,2378%8%6%Decision Analytics1621610%0%13%Marketing BusinessConsumer ServicesTotal revenueBenchmark EBIT – ongoingactivitiesBenchmark EBIT margin32 Experian PublicAll results are Benchmark figures and are on an ongoing activities basis.Growth at constant exchange rates
AppendixLatin AmericaTwelve months ended 31 MarchUS millionOrganicgrowthQ1 cision Analytics483634%34%44%Marketing Services241639%39%44%Total revenue7306319%9%8%Benchmark EBIT – ongoingactivities2512263%34.4%35.8%RevenueCredit ServicesBenchmark EBIT margin33 Experian PublicAll results are Benchmark figures and are on an ongoing activities basis.Growth at constant exchange rates
AppendixUK and IrelandTwelve months ended 31 MarchUS millionOrganicgrowthQ1 FY18Organicgrowth20172016TotalgrowthCredit Services2462753%3%3%Decision Analytics2142345%5%7%Marketing 4%Consumer Services202255(9)%(9)%(19)%Total revenue8079241%1%(3)%Benchmark EBIT – ark EBIT margin34 Experian PublicAll results are Benchmark figures and are on an ongoing activities basis.Growth at constant exchange rates
AppendixEMEA/Asia PacificTwelve months ended 31 MarchUS millionOrganicgrowthQ1 FY18Organicgrowth20172016TotalgrowthCredit Services144149(3)%(3)%0%Decision Analytics16013521%21%13%Marketing 4.8)%RevenueTotal revenueBenchmark EBIT – ongoingactivitiesBenchmark EBIT margin35 Experian PublicAll results are Benchmark figures and are on an ongoing activities basis.Growth at constant exchange rates
AppendixCredit ServicesTwelve months ended 31 MarchUS millionRevenue20172016TotalGrowthNorth America1,3411,2378%8%6%Latin America6585796%6%5%UK and Ireland2462753%3%3%EMEA/Asia 2%35.3%Total revenueBenchmark EBITBenchmark EBIT marginAll figures above on a ongoing activities basisGrowth at constant exchange rates36OrganicgrowthQ1 FY18Organicgrowth Experian Public
AppendixDecision AnalyticsTwelve months ended 31 MarchUS millionOrganicgrowthQ1 FY18Organicgrowth20172016TotalGrowthNorth America1621610%0%13%Latin America483634%34%44%UK and Ireland2142345%5%7%EMEA/Asia Pacific16013521%21%13%Total revenue5845669%9%13%Benchmark EBIT12010427%20.5%18.4%RevenueBenchmark EBIT margin37 Experian PublicAll figures above on a ongoing activities basisGrowth at constant exchange rates
AppendixMarketing ServicesTwelve months ended 31 MarchUS millionOrganicgrowthQ1 FY18Organicgrowth20172016TotalGrowthNorth America2152008%8%18%Latin America241639%39%44%UK and 2%22.6%18.7%RevenueEMEA/Asia PacificTotal revenueBenchmark EBITBenchmark EBIT margin38 Experian PublicAll figures above on a ongoing activities basisGrowth at constant exchange ratesThe 2016 results have been restated to reflect the email/cross-channel marketing business ('CCM') reclassification as a discontinued operation.
AppendixConsumer ServicesTwelve months ended 31 MarchUS million20172016TotalgrowthNorth America7396966%(2%)(5)%UK and Ireland202255(9)%(9)%(19)%Total revenue9419512%(4)%(8)%Benchmark EBIT2432414%25.8%25.3%RevenueBenchmark EBIT marginAll figures above on a ongoing activities basisGrowth at constant exchange rates39OrganicgrowthQ1 FY18Organicgrowth Experian Public
AppendixBenchmark cash flow performance1,19921(393)322Net capitalexpenditureBenchmarkEBIT40 Experian PublicWorkingcapital andother1,149(70)Net interestpaid(144)(2)Tax paid on Dividends eciation96%112%conversion of EBIT intooperating cash flowconversion of Benchmarkearnings into free cash flowBenchmarkoperating cashflow933Benchmark freecash flow
AppendixNet debt ree cash flowNet debt at1 April 2016Net debt /Benchmark EBITDA1.9x41 Experian PublicFX and other3,173Equitydividends paidNet sharepurchasesAcquisitionsand minorityinvestmentsNet debt at31 March 2017Net debt /Benchmark EBITDA2.1x
AppendixExperian American Depositary Receipt (ADR) programFor ADR shareholder enquiries,please contact:Shareholder RelationsBNY Mellon Depositary ReceiptsPO Box 30170College StationTX 77842-3170United StatesT: 1 201 680 6825(From the US: 1-888-BNY-ADRS, toll free)E: shrrelations@cpushareownerservices.comW: www.mybnymdr.com42 Experian PublicExperian ADR shares trade on theOTCQX under the ive DateUnderlying SEDOLUnderlying ISINU.S. ISINDepositaryEXPGY30215C1011 ADR : 1 ORDUnited KingdomOctober 11, 2006B19NLV4GB00B19NLV48US30215C1018BNY Mellon
AppendixContactsAppendixContactsExperianCardinal Place80 Victoria StreetLondonSW1E 5JLTel: 44 (0)203 042 4200Website: www.experianplc.comNadia Ridout-JamiesonPeg SmithChief Communications OfficerExecutive Vice-PresidentEmail: nadia.rjamieson@experian.com Email: peg.smith@experian.comSarah SchibliInvestor Relations and Communications ManagerEmail: sarah.schibli@experian.com43 Experian Public
AppendixEvent calendar44 Experian Public20 July 2017Annual General Meeting15 November 2017Half year financial report
AppendixDisclaimer This presentation is being made only to, and is only directed at, persons to whom this presentation may lawfully be communicated(“relevant persons”). Any person who is not a relevant person should not act or rely on this presentation or any of its contents. Information in this presentation relating to the price at which relevant investments have been bought or sold in the past or the yield onsuch investments cannot be relied upon as a guide to the future performance of such investments. This presentation does not constitute or form part of, and should not be construed as, an offering of securities or otherwise constitutean invitation, inducement or recommendation to any person to underwrite, subscribe for or otherwise acquire securities in anycompany within the Experian group(the “Group”). Certain statements made in this presentation are forward looking statements. Such statements are based on current expectationsand are subject to a number of risks and uncertainties that could cause actual events or results to differ materially from any expectedfuture events or results expressed or implied in these forward-looking statements. Forward-looking statements speak only as of thedate of this presentation. This presentation contains certain non-GAAP financial information. The Group’s management believes that these measures providevaluable additional information in understanding the performance of the Group or the Group’s businesses because they providemeasures used by the Group to assess performance. Although these measures are important in the management of the business,they should not be viewed as replacements for, but rather as complementary to, the GAAP measures.45 Experian Public
Largest markets: US, Brazil, UK Corporate headquarters: Dublin For the year ending 31 March 2017 * At 14 July 2017. Experian is the world's leading global information services company. Our roots lie in assessing credit risk; today we do much more.