Transcription
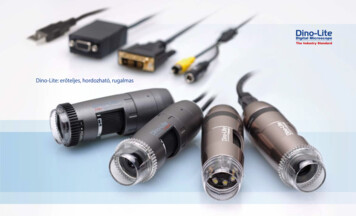
Test Report for Hermes Lite SDRJune 14-17, 2015by Adam Farson VA7OJ/AB4OJ (Iss. 3)Figure 1: The Hermes Lite.Introduction: The following are the results obtained from receiver and transmitter tests which theauthor conducted on a Hermes Lite direct-sampling/DUC SDR receiver-exciter, kindly loaned by DaveMiller VE7PKE. The DUT was connected via a dedicated Ethernet router to a 2.3 GHz Core i5 laptoprunning under Win7 Pro 64-bit. As the Hermes Lite does not have an on-board DAC, VAC (Virtual AudioCable) was enabled in PowerSDR.Software version: OpenHPSDR mRX PS V3.2.27.Firmware version: Hermes 3.1.Initial DUT rmes-Lite/wiki/Software#hpsdrNote that the Dither and Random checkboxes have been re-purposed. Dither OFF increases LNA gain by32 dB. Random ON enables a unique AGC function controlled by a clipping detector. For these tests,Enable Attenuator (Options tab) is ON, enabling S-ATT. In the HPSDR tab, Dither is ON and Random OFF(the latter to allow measurement of ADC clip level). S-ATT is set at 0 dB. This sets LNA gain at 19 dBwith Dither ON and 48 dB with Dither OFF. The 19 dB LNA gain value was selected because it yieldsMDS in the -120 dBm range, comparable to other direct-sampling SDR receivers.A. Receiver Tests:1. MDS (Minimum Discernible Signal). Marconi 2018A signal generator, 20 dB pad, DUT ANT1input. Ballantine 323 true RMS voltmeter at laptop PHONES jack.2. NPR (noise power ratio). Wandel & Goltermann RS-50 and RS-25 noise generators (fitted withfilters per Table 2), MCL 75/50Ω transformer, DUT ANT1 input. DUT set to LSB for all testfrequencies except 5340 kHz (USB). 2.4 kHz channel filter selected. NPR read directly fromspectrum scope. (Ref.2).1
3. RMDR (reciprocal mixing dynamic range). Marconi 2018A signal generator, 3 dB pad, 9.83 MHzbandstop filter, 0-110 dB step attenuator, DUT ANT1 port. Ballantine 323 true RMS voltmeter atlaptop PHONES jack.4. 2-Tone 3rd-Order IMD (IFSS). Marconi 2018A and 2019 signal generators, MCL ZHL-32A bufferamplifiers, MCL low-pass filters appropriate for band tested, 20 dB pads, MCL ZSC-2-1Wcombiner, 0-110 dB step attenuator, 10 dB fixed attenuator at DUT ANT1 input. IMD productlevels read from S-meter. Test results presented as curves of IMD level vs. test signal power,with ITU-R P.372-1 band noise levels as datum lines. (Ref.5, Slides 23-27.)5. DR2 (IMD2 dynamic range). As for IFSS.6. NR SINAD Improvement. As for MDS. HP 339A distortion meter at laptop PHONES jack.7. NB impulse response. HP 8011A pulse generator connected to DUT ANT1 input. Headphones atlaptop PHONES jack.8. ANF tone suppression. As for MDS, HP 3580A spectrum analyser at laptop PHONES jack.9. APF passband. As for MDS, HP 3580A spectrum analyser at laptop PHONES jack.1. MDS (Minimum Discernible Signal tested in CW mode (B 500 Hz), S-ATT 0 dB, LNA gain 19and 48 dB. The receiver is tuned to each test frequency f0 in turn and a test signal applied. Ateach frequency, the input power Pi required to raise audio output noise level by 3 dB is noted. Pi MDS.Test Conditions: NR/NB/ANF off, S-ATT 0 dB, AGC Slow, AGC Gain at max. AVG on, displayrefresh rate 60 fps. See Table 1.Table 1: Minimum Discernible Signal (MDS).f0 MHzLNA Gain dB3.614.128.1MDS dBm 19 48-119 -129-118 -128-116 -1262. NPR (Noise Power Ratio), tested in SSB mode (B 2.4 kHz. Receiver tuned to notch center in allcases. Noise loading set to the point where ADC just does not clip for 10 sec. (-1 dBFS). NPRread off spectrum scope (noise level in a channel outside notch minus noise level at bottom ofnotch.) See Table 2 and Figure 2.Test Conditions: Receiver tuned to bandstop filter centre freq. f0 1.5 kHz, SSB, B 2.4 kHz, SATT 0 dB, LNA gain 19 dB, NR off, NB off, ANF off, AGC slow, AGC Gain at max., AVG on,Display Refresh Rate 60 fps.Table 2: NPR Test Results.DUTDet BW kHz ModeLSBLSBHermes Lite2.4USBLSBBSF kHz1940388653407600BLF kHz Equiv. J3E chnls. PTOT dBmc NPR dBa Theor. NPR dBb48060 2044-285760.896060 4100-295957.7126060 5600-305756.31800316 8160-315654.82
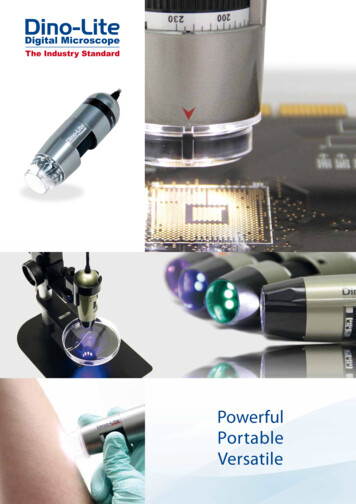
Notes on NPR test:a. NPR read directly off spectrum scope.b. Theoretical NPR is calculated for the 12-bit ADI AD9886 ADC using the method outlined in Ref.1,normalised to 12 bits. The theoretical NPR value assumes that BRF is not limited by any filteringin the DUT ahead of the ADC, and that the net gain between the antenna port and the ADC is 0dB.c. S-ATT 20 dB increases PTOT for same NPR reading by 20 dB.Figure 2: NPR at 5340 kHz.3. RMDR (Reciprocal mixing dynamic range). Marconi 2018A signal generator, 3 dB pad, 9.830MHz 4-pole bandstop filter ( 80 dB notch depth), 0-110 dB step attenuator, DUT (RX port).Noise floor read on S-meter in CW mode (500 Hz bandwidth) with DUT terminated in 50Ω. SATT 0 dB, LNA gain 19 dB, NB/NR/ANF OFF. Signal generator frequency (f0) tuned for max.null; DUT tuned to f0. Signal generator then tuned to f0 - offset and output Pi increased to raisedetected noise by 3 dB. RMDR Pi – (noise floor with generator off.) See Table 3. Note: Theresidual phase noise of the measuring system is the limiting factor in measurement accuracy.Table 3: Reciprocal Mixing Dynamic Range (RMDR) at 9830.28 kHz.Δf kHz123510Pi dBm RMDR dB Phase noise dBc/Hz 4.4116-143 2.4 117-144 2.4 117-144 2.4 117-144 2.4 117-144Noise Floor -120 dBm4. Two-Tone IMD (IFSS, Interference-Free Signal Strength) tested in CW mode (500 Hz), S-ATT 0dB, LNA gain 19 dB. Test frequencies per Table 4. Absolute IMD product level is read on Smeter in a 500 Hz CW detection bandwidth at various test-signal power levels with S-ATT 0 dB.The ITU-R P372.1 band noise levels for typical urban and rural environments are shown asdatum lines. Figure 2 is a typical screenshot of the IFSS test. The results are given in Figure 4.Table 4: IFSS Test Frequencies & IMD Products.Band f1 kHz f2 kHz Lower IMP kHz Upper IMP kHz20m 14100 1410214098141043
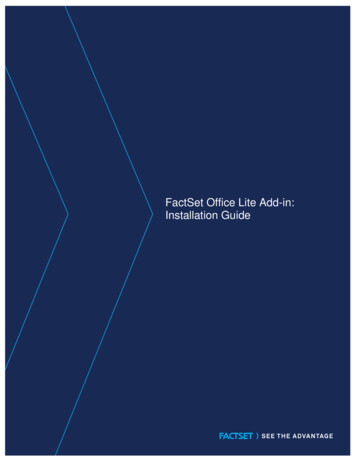
Figure 3. Typical IFSS spectrum scope display, showing IMD3 products.Figure 4: 20m IFSS (two-tone IMD) curve for S-ATT 0 dB.Note on IFSS (2-tone IMD3) test: This is a new data presentation format in which the amplituderelationship of the actual IMD products to typical band-noise levels (Ref.3) is shown, rather thanthe more traditional DR3 (3rd-order IMD dynamic range). The reason for this is that for an ADC,SFDR referred to input power rises with increasing input level, reaching a well-defined peak andthen falling off. In a conventional receiver, SFDR falls with increasing input power. See alsoRef.5, Slides 23 – 27.4
The SFDR (spurious-free dynamic range) behaviour of an ADC invalidates the traditional DR3test for a direct-sampling SDR receiver. Our goal here is to find an approach to SFDR testingwhich holds equally for SDR and legacy receiver architecture.It will be seen from the above chart that the IMD curve approximates 1st order until -10 dBFS (10dB below ADC clip level) is approached; in Figure 4, the curve in the range -10 dBFS to 0 dBFS iscloser to 3rd-order. This is due to non-linearity in the LNA.5.DR2 (IMD2 dynamic range) tested at 14.200 MHz, WIDE, in CW mode (500 Hz), S-ATT 0 dB,LNA gain 19 dB. Test frequencies: f1 6100 kHz, f2 8100 kHz. 2nd-order IMD2 product:14200 kHz. Test-signal level is adjusted for a 3 dB increase in audio output, and DR2 & IP2calculated.DR2 Pi – MDS.IP2 (2 * DR2) MDSTest Results: Refer to Table 5.Table 5: IMD2 Dynamic Range (DR2).S-ATT dB LNA Gain dB MDS dBm Pi dBm/tone DR2 dB IP2 dBm0 19-118-7543-326. Noise Reduction (NR) SINAD Improvement tested in USB mode (2.4 kHz), ), S-ATT 0 dB, LNAgain 19 dB. Receiver tuned to 14100 kHz. Test signal at 14101 kHz. The distortion meter isconnected to the PHONES jack and signal level adjusted for 6 dB SINAD with NR off. NR andNR2 are selected in turn, and SINAD read and noted for each setting. PowerSDR NR parametersare at default values.Test Results: Refer to Table 6.Table 6: NR Improvement.NR Setting SINAD dB SINAD Improvement dBOFF60NR137NR21812Note: With NR2 on, the recovered audio has a watery, burbling quality.7.Noise Blanker (NB) Impulse Suppression tested in USB mode (2.4 kHz), S-ATT 0 dB, LNA gain 19 dB. A pulse train is applied to DUT RX port. Receiver tuned to 3600 kHz. Pulse parameters:Vpk 32 mV, rise-time 10 ns, PRF 2 pps.Test Results: With NB on, PowerSDR NB parameters at default values, no audible pulse “ticks”with duration 225 ns. Noise floor decreases slightly with NB on.8. Auto-Notch Filter (ANF) Tone Suppression tested in USB mode (2.4 kHz), S-ATT 0 dB, LNA gain 19 dB, PowerSDR NB parameters at default values. The DUT is tuned to 14100 kHz, and a S9 20 dB (-50 dBm) test signal at 14101 kHz is applied. The test tone level at the PHONES jack ismeasured with the HP 8530A spectrum analyser.Test Results: ANF reduces the tone level by more than 70 dB.5
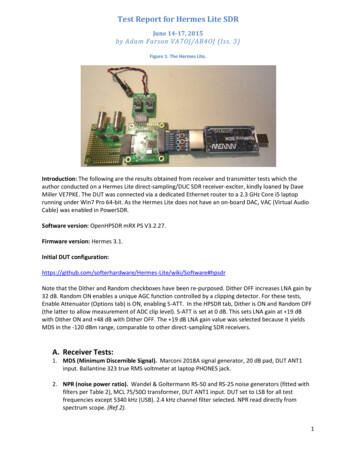
9. Audio Peak Filter (APF), tested in CW mode (B 500 Hz), S ATT 0 dB, LNA gain 19 dB. TheHP 3580A spectrum analyser is connected to the laptop PHONES jack. A test signal at 14.1 MHzand -90 dBm is applied to RX IN. The spectrum analyser is tuned to f0 600 Hz and screenshotstaken for various APF settings. See Figures 5, 6 and 7.HP 3580A settings: 10 Hz RBW, 50Hz/div span, 2s/div sweep time, ref. level 0 dBv.Figure 5: APF off.Figure 6: APF 75 Hz, 0 dB.6
Figure 7: APF 75 Hz, 10 dB.Figure 8: APF 30 Hz 10 dB7
B. Transmitter TestsAttenuators used in these tests should be rated at 2W or higher.1. Maximum RF output. HP 432A power meter with Harris N6284B sensor connected to DUT TXport via 20 dB attenuator. TUNE mode selected, Drive at 100%. Test Results: See Table 7.Table 7: Max. RF output PO.f0 MHz3.614.128.2Max. PO dBm 12 15 18.5Note: PO checked with SSB, Mode Radio, Level 0.0 dB, Freq. 1000 Hz selected in Transmit.P0 readings identical to TUNE mode.2. SSB 2-Tone Transmitter IMD. In PowerSDR Tests tab, Freq. 1 700 Hz, Freq. 2 1700 Hz, Level 0 dB, RF Power 100%. HP 8563E spectrum analyser connected to DUT TX port via 30 dBattenuator. IMD measured on 3.6, 14.1 and 28.1 MHz. Refer to Table 9, and Figures 9 - 11.Table 9: TX IMD in dBc (ref. 1 of 2 equal tones) at 100% RF Power.Freq. MHz3.614.128.1PEP dBm 12 15 18IMD3-54-48-52IMD5-72-65-66IMD7-84-77-75IMD9 -86 -86 -90Subtract 6 dB for IMD ref. 2-tone PEP.3. SSB TX Noise IMD. As for Test 2, except Mode Noise, Level 0.0 dB selected in Transmit. Testrun at 14.1 MHz, P0 100%. Power in noise bandwidth 5 dBm. See Figure 12.8
Figure 9.Figure 10.9
Figure 11.Figure 12.10
4. TX harmonics & spurs. HP 8563E spectrum analyzer with HP 85672A spurious response utility,connected to DUT ANT1 via 30 dB attenuator. Test run in SSB mode at PO 100% on 3.6, 14.1and 50.1 MHz.Test Results: Refer to Figures 13 – 15 (harmonic charts) and 16 – 18 (sweeps, showing harmonicsand non-harmonic spurs).Figure 13.11
Figure 14.Figure 15.12
Figure 16.Figure 17.13
Figure 18.5. TX harmonics & spurs with harmonic filters. At the suggestion of Steve Haynal KF7O, theauthor repeated Test 4 with a Mini-Circuits (MCL) LPF inserted between DUT TX OUT and theattenuator ahead of the spectrum analyser. The appropriate filter was selected for each band inturn.HP 8563E spectrum analyzer with HP 85672A spurious response utility, connected to DUT ANT1via 30 dB attenuator. Test run in SSB mode at PO 100% on 3.6, 14.1 and 50.1 MHz.Test Results: Refer to Figures 19 – 21 (harmonic charts) and 22 – 24 (sweeps, showingharmonics and non-harmonic spurs). Table 10 gives the LPF part number for each band tested.Table 10: MCL LPF Part NumbersBand m TX Freq. MHz MCL LPF Part No.803.6BLP-52014.1BLP-151028.1BLP-3014
Figure 19.Figure 20.15
Figure 21.Figure 21.16
Figure 22.Figure 23.17
C. Comments:1. The receiver’s DR2/IP2 (2nd-order IMD) performance is inadequate for use without a goodpreselector in Region 1 or in other areas where high-power HFBC transmitters are present.2. As the Hermes Lite FPGA code does not support CW generation, no CW tests were conducted.3. The default receiver front-end configuration (Dither ON, Random OFF, S-ATT 0 dB, yielding 19dB LNA gain) was used in all receiver tests unless otherwise specified, so as to ensure maximumusable dynamic range. In addition, the NPR and IFSS tests require that the onset of ADC clippingwill not alter RF gain.4.The transmitter’s excellent linearity makes it suitable as an exciter for a wide variety of PAchains. It should be noted though, that harmonic filters are required to meet regulatoryrequirements. This is especially true on 10m, where spurs at -10 and -20 dBc were observed.5. The additional tests with harmonic filters at the DUT TX OUT port show excellent harmonicsuppression, although on the 10m band a significant spur (-20 dBc) at 35 MHz is still visible.D. Acknowledgements:I would like to thank my friend Dave Miller VE7PKE for the loan of the Hermes Lite DUT, and also forguiding me through the on-line Hermes Lite literature.E. s/16bit npr.pdf (theoretical maximum NPR)http://www.ab4oj.com/test/docs/npr test.pdf (NPR testing)http://www.ab4oj.com/icom/nf.html (antenna & receiver NF)http://www.nsarc.ca/hf/arrl test.pdf (brief tutorial on radio testing)http://www.nsarc.ca/hf/rcvrtest.pdf (IFSS: Slides 23 – 27)Adam Farson VA7OJ/AB4OJ, June 17, 2015.Copyright 2015 A. Farson VA7OJ/AB4OJ. All rights reserved.18
As for MDS, HP 3580A spectrum analyser at laptop PHONES jack. 9. APF passband. As for MDS, HP 3580A spectrum analyser at laptop PHONES jack. 1. MDS (Minimum Discernible Signal tested in CW mode (B 500 Hz), S-ATT 0 dB, LNA gain 19 and 48 dB. The receiver is tuned to each test frequency f 0 in turn and a test signal applied. At