Transcription
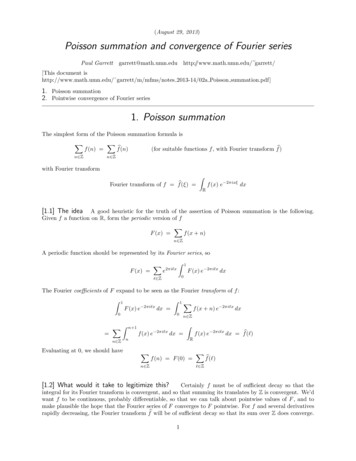
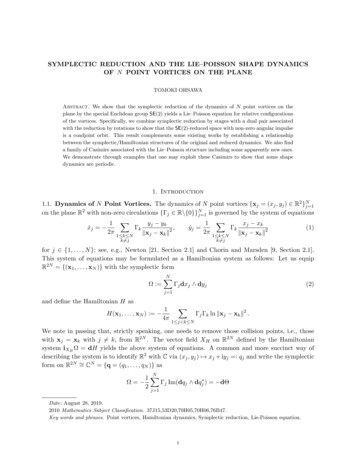
Journal of Polish Safety and Reliability AssociationSummer Safety and Reliability Seminars, Volume 8, Number1, 2017Grabski FranciszekORCID ID: 0000-0002-8274-3005Naval University, Gdynia, PolandNonhomogenous Poisson process application to modelling accidentsnumber at Baltic Sea waters and portsKeywordsPoisson process, safety characteristics.AbstractThe stochastic processes theory provides concepts and theorems that allow to build probabilistic modelsconcerning incidents or (and) accidents. Counting processes are applied for modelling accidents numberin Baltic Sea region in the given time interval. A crucial role in construction of the models plays a Poissonprocess and its extensions especially a nonhomogeneous Poisson process. The models of accidents numberin the sea and seaports are here presented. Moreover some procedures of the model parametersidentification are presented in the paper. Estimation of model parameters was made based on data fromreports of HELCOM (2014) and Interreg project Baltic LINes (2016-2019).1. Introduction2. Statistical analysisParameters of the constructed modelswereAnnual report on shipping accidents in the Balticestimated on the basis of the available data comingSea in 2013 HELCOM (2014) provides a lot offrom reports [9] , [10] and [11] . So, the main issuesimportant information relevant to our problem.of the work will be preceded by the background,From the date coming from report we can assesbased on these reports. To monitor shipping safetysome parameters in our models.and maintain the safety at sea HELCOM annuallycompiles a report on shipping accidents in the Baltic500000Sea. “The Interreg project Baltic LINes (2016-2019)450000seeks to increase transnational coherence of400000shipping routes and energy corridors in Maritimes for anticipation of the dangerous events number are presented in 350000the paper.Spatial Plans to prevent cross-border mismatches300000and secure transnational connectivity as well as250000efficient and sustainable use of Baltic Sea space”.200000The report [9] was developed under Work Package150000(WP) 2.1. Screen and analyse available information.100000This report contains the data and maps related toshipping in the Baltic Sea. It represents a first50000synthesis of available literature on the topic of02006 2007 2008 2009 2010 2011 2012 2013shipping in the Baltic Sea and related past, presentand future developments relevant for MSP. Weshould add that data mainly concern events in theFigure 1. Total number of ships crossing in theBaltic Sea and relatively little information onBaltic Sea during 2006-2013accidents in the ports.Table 1 and Figure 1 show a total number of shipscrossing in the Baltic Sea during 2006-2013. Theminimum number of ships crossing amounted39
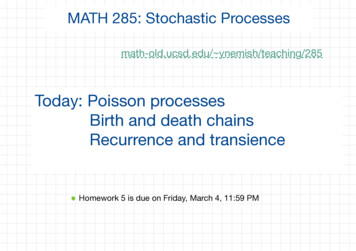
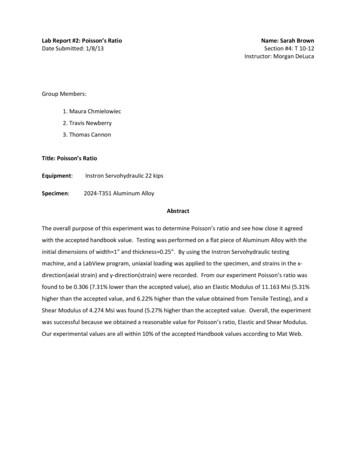
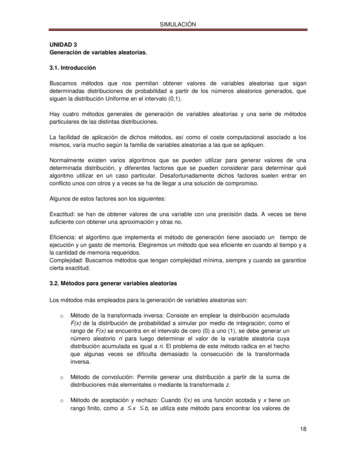
Grabski FranciszekNonhomogenous Poisson process application to modelling accidents number at Baltic Sea waters and ports376671 in 2006 and maximum was 430064 in 2008.From 2009 to 2013 the number of ships crossingwas in interval 342754 – 391699.146115 118Table 1. Total number of ships crossing all fixedHELCOM AIS lines in the Baltic Sea during 20062013143 148 1491381331271152004 2005 2006 2007 2008 2009 2010 2011 2012 2013Figure 3. Total number of reporting ship accidentsin the Baltic Sea during 2004-2013Using date form Table 1 and Figure 1 we cancompute theindicators of shipping accidentsintensity in relation to the ships crossing number.We define indicatorsand,wherenumber of ship crossing ,number of shipping accidents.Table 1 shows in detail the number and types ofships crossing in the years 2006 -2013 in the BalticSea.No info4%Table 2. Indicators of shipping accidents intensity inrelation to the ships crossing ,000306Figure 2 . Different types of cruises in shipscrossing in the Baltic Sea during ed on data coming from[10] we have drawn upFigure 3 that shows a total number of shippingaccidents in the Baltic Sea during nker16%Cargo54%From the Figure 4 it follows that the indicator α ofshipping accidents intensity with respect to theships crossing number in the Baltic Sea during2006-2013 has a growing trend over time.According to the reports 149 ship accidentsoccurred in the Baltic Sea area in 2013, which is thehighest recorded number in the last ten years(Figure 3) . The number of accidents in the BalticSea has shown a slight increase in the last threeyears. Compared to 2010 the total number ofaccidents increased by 17% in 2013.40
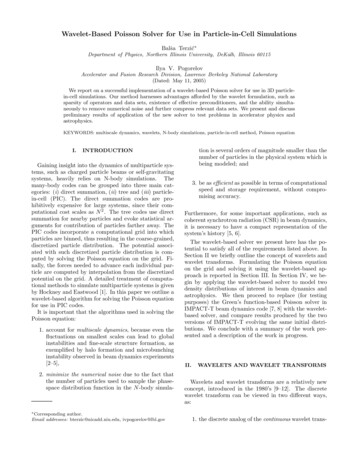
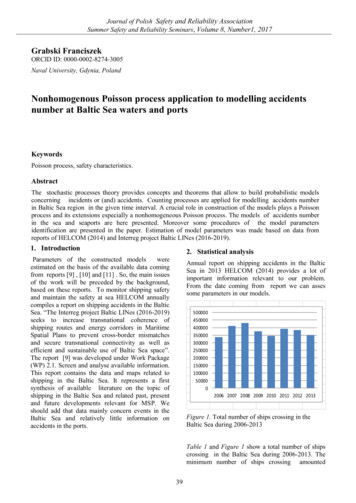
Journal of Polish Safety and Reliability AssociationSummer Safety and Reliability Seminars, Volume 8, Number1, 2017ample safety distances are assigned to allcomponents and additional space is reserved for therelated service traffic. The expected increase inleisure traffic will also demand more space whichshould be possible dedicated to an expansion ofsafety distances to keep the commercial shippingpossible dedicated to an expansion of safetydistances to keep the commercial shipping gure 4. Indicatorα of shipping accidentsintensity with respect to the ships crossing numberin the Baltic Sea during 2006-2013γ400035003000250020001500Figure 6. [10] Types of accidents in the Baltic Sea in10002004-201350002006 2007 2008 2009 2010 2011 2012 2013Figure 5. Indicator of ships crossing numberwith respect to the shipping accidents in the BalticSea during 2006-2013The indicatorrepresents the average number ofships crossing on one accident. From Figure 5 itfollows that the indicator has a decreasing trendover time. This number can be interpreted as theaverage number ofships crossingbetweenaccidents.The number of shipping accidents increased over thepast years, with cargo ships most frequentlyinvolved followed by passenger ships and tankers[9],[10],[11]. Human error is the main cause foraccidents and is mainly related to unintentionalaction. However, 17% of the accidents occurredafter intentional decisions against common rules andplans [9]. The number of collisions with othervessels and contacts to fixed or floating objects hassouth-western Baltic Sea is the main hotspot forthese types of accidents. The offshore wind energysector will have high spatial demands in the futureespecially when ample safety distances are assignedto all components and additional space is whenFigure 7. [11] Location of accidents in the BalticSea in 20123. Homogenuous Poisson processThe dangerous events and accidents number inBaltic Sea region during given time are therandomly changing quantities. The theory ofstochastic (random) processes allows the modellingof the random evolution of systems through thetime. A crucial role in construction of the modelsplays a Poisson process and its extensions. Theyallow to construct the models of the dengerousincidents and accidents number in the sea and41
Grabski FranciszekNonhomogenous Poisson process application to modelling accidents number at Baltic Sea waters and portsseaports of the Baltic region.instants of the state changes (jumps) in the Poissonprocess or another process withthe rightcontinuous, nondegreasing and picewise constanttrajectories. The random variablesdenote the sojourn times of the states. . Let us notice thatA random processis said to beprocess with independent increments if for allsuch thatthe random variablesaremutually independent. If the incrementsandfor allhave the identical probability distributionsthenis called a process with thestationary independent increments (SII). It isproved,that for the SII processes such thatan expectation and a variance are,A stochastic processformuladefined by theis called a counting process corresponding to arandom sequence.For the Poisson process with parametertherandom variablesaremutually independent and exponentially distributedwith the identical parameter .The Poisson process is a counting process which isgenereted by the random sequence,where.(1)whereand,.(2)An example of a SII random process is a Poissonprocess.A stochastic processtaking valueson, with the right continuoustrajectories is said to be a Poisson process withparameterif:4. Nonhomogeneous Poisson process1.2.Letbe a stochastic processtaking values on, value of whichrepresents the number of events in a time interval.3.A counting processis said to benonhomogeneous Poisson process (NPP) with anintensity functionsuch thatif1.Forwe get a first order distribution of thePoisson process:2. The processis thestochastic process with independentincrements andthe right continuoustrajectories;(4)Forwe obtain the Poisson distribution withparameter . HenceandTherefore, from (1) and (2), we obtain theexpectation and the variance of the Poisson process:3.From this definition it follows that the onedimensional distribution of NPP is given by the ruleFor a fixedthis formula determines the Poissondistribution with parameter:(6)Let(5)represent the consecutive42
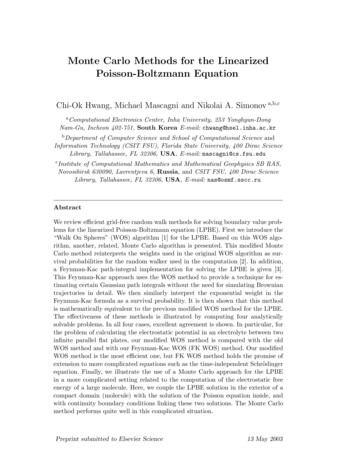
Journal of Polish Safety and Reliability AssociationSummer Safety and Reliability Seminars, Volume 8, Number1, 2017The expectation andfunctionsvariance of NPP are the,of the Poisson distribution.(7)The corresponding to it standard deviation is 10,46.The corresponding standard deviation isProbability that the number of dangerous eventsbetween May 1 and September 30 is not greater than100 isThe expected value of the incrementwhereApplying approximation by normal distribution weget(8)The corresponding standard deviation is5. Models of accidents number in the BalticSea and Seaports(9Letbe a stochastic process takingvalues on, value of which representsthe number of accidents in the Baltic Sea in a timeinterval. Due to the nature of these events,pre-assumption that it is a nonhomogeneous Poissonprocess with some parameter, seems tobe justified. The expected value of increment of thisprocess is given by (8) while its one dimensionaldistribution is determined by (6). We can usepractically these rules if will know the intensityfunction. To define this function weutilize information presented above in StatisticalAnalysis.)Annonhomogeneous Poisson process withfor each t 0, is a regularPoisson process.The increments of an nonhomogeneous Poissonprocess are independent, but not necessarilystationary.A nonhomogeneous Poisson process is a Markovprocess.4.1.Illustrative exampleThe number of accidents during one year can bedescribe by a nonhomogeneous Poisson processwith an intensity function given by5.1. Estimation of models parametersDividing the number of accidents in each year, thatare shown in figure 3, by 365 or 366 we get theintensity in units of [1 / day ]. The results are shownin Table 3. Figure 8 shows the empirical intensity ofaccidents in the Baltic Sea and Seaports.Using (7) we compute the expected value of theprocess. We obtainAs a parameters of the models we will approximatethe empirical intensity by a linear regressionfunctionthat satisfied conditionThe number of dangerous events between May 1and September 30 is a random variable havingPoisson distribution with parametergivenby (8),where[day] and[day].Recall that parametersrules(10)Hence, from (8 ) and ( 9) we obtain the parameter43andare given by the
Grabski FranciszekNonhomogenous Poisson process application to modelling accidents number at Baltic Sea waters and 50183731,5 913,5 1278,5 1644 2009,5 2374,5 2374,5 3105 3470,5Table 3. The empirical intensity of accidents in theBaltic Sea and SeaportsFigure 8. The empirical intensity of accidents in theBaltic Sea and SeaportsYearFrom (6) and (7) we obtain one dimensionaldistribution of NPPIntervalCenter ofintervalNumberofaccidentsIntensity[1/day]2004[0, 731, 1096)913,51150,315062007[1096, 1461)1278,51180,323282008[1461, 1827)16441380,377042009[1827, 2192)2009,51150,315062010[2192, 2557)2374,51270,347942011[2557, 2922)2374,51430,391782012[2922, 3288)31051480,404372013[3288, 3653)3470,51490,40821(13),whereis given by (9).Finnally we can say that the model of the accidentnumber in the Baltic Sea and Seaport is thenonhomogeneous Poisson process with theparameterdetermines by (9).5.2. Anticipattion of the accident numberFrom ( 6) we get(14)It means that we can anticipate number of accidentsat any time interval with a length of h. The expectedvalue of the incrementis defined by (8).For the functiongiven by (9) we obtain theexpeted value of the accidents at time intervalApplaying the rules (10) for the data from Table 3and using Excel we obtain the linear intensity ofaccidents(11)(15 )From (7) we havewhereandb The corresponding standard deviation is(16)Hence we obtainExample 1We want to predict the number of accidents from44
Journal of Polish Safety and Reliability AssociationSummer Safety and Reliability Seminars, Volume 8, Number1, 2017June 1 of 2017 to September 30 of 2017. We alsowant to calculate the probability of a given numberof accidents.First we have to determine parametersTo do it we extent part of Table 9.andnonhomogenous Poisson. This process counts totalnumber of accidents in a Baltic Sea Region in a timeintervalwhile the processesdenote different kind ofaccidents due the partition of them according todifferent criteria.A first order distribution of this process is given bythe rule.Table 4. Extensions of part of Table 92013[3288, 3653)2014[3653, 4018)2015[4018, 4383)2016[4383, 4749)2017[4749, 5114)where.From January 1 of 2017 to June 1 of 2017 havepased 151 days. Hence.From June 1 to September 30 have passed 122days. For these parameters we obtainIt is also true to say that every nonhomogeneousPoisson process can be represented as a sum ofindependent Poisson processes with parameterssuch that.5.4. Models describing different kinds ofnumber of accidents in the Baltic See due tolocationThis means that the average predicted number ofaccidents between 1 June 2017 and 30 September2017 is about 50 with a standard deviation of about7.Due to the location of the accident, based on thedata presented in Figure 7, the nonhomogeneousPoisson process can be represented as a sumProbability that the number of accidents in theBaltic Sea and Seaports between June 1, 2017 andSeptember 30 , 2017 is not greater than d 60 andnot less that c 40 iswhere,Applying approximation by normal distribution wegetThe corresponding to these processes parametersare: 0,44,(17) 0,35 0,075.3. Models describing total sum of accidentsin the in the Baltic See Region.From the so-called theorem on adding of the randomvariables with Poisson distributions it follows thatthe sum ofindependent nonhomogeneousPoisson processeswithparametersisthenonhomogeneous Poisson process with parameter.Itmeans that the processisthe,5.5. Models describing number of accidentsin the Baltic See PortsAccording to (12) and (17) the expectation of theprocessdescribing number of accidents inthe Baltic Sea Ports is given by45
Grabski FranciszekNonhomogenous Poisson process application to modelling accidents number at Baltic Sea waters and portsnumber in Baltic Sea and Baltic Seaports inspecified period of time. A crucial role in themodels construction plays a nonhomogeneousPoisson process . Models of accidents number in theBaltic Sea and Seaports are constructed. Moreoversome procedures ofthe model parametersidentification are presented in the paper. Estimationof model parameters was made based on data fromreports of HELCOM (2014) and Interreg projectBaltic LINes (2016-2019). To select the mostappropriate model one should verify the modelsusing appropriate statistical tests. But it requires alarge number of data.(18)The expected value of the accidents at time intervalis(19)where,(21)(22)AcknowledgementsThe corresponding standard deviation is.(The paper presents theresults developed in the scope of the HAZARD projecttitled “Mitigating the Effects of Emergencies in BalticSea Region Ports” that has received funding from theInterreg Baltic Sea Region Programme 2014-2020 undergrant agreement No #R023. https://blogit.utu.fi/hazard/23)Example 2We want to anticipate the number of accidents in theBaltic Sea Ports from June 1 , 2017 to September30, 2017. We also want to calculate the probabilityof a given number of that kind of accidents.Parametersand are the same like in example l,parametersandare given by (21) and (22).Using the formula ( 19) we obtain the expectedvalue of the accidents in the Baltic Sea Ports intime interva-between June 1, 2017 toSeptember 30, 2017;"Scientific work granted by Poland’s Ministry of Scienceand High Education from financial resources for sciencein the years 2016-2019 awarded for the implementationof an international co-financed project."I would like to thank Professor Lauri Ojala for pointing tothe reports Baltic LINes (2016) [9] and HELCOM(2014) [10], from which the data allowed me to estimatethe models parameters.ReferencesApplying formula (23) we get the corresponding tothat one standard deviation[1] Barlow, R.E & Proshan, F. (1975). Statistical[2]Probability that the number of accidents in theBaltic Sea Ports in that interval of time is not greaterthan d 30 and not less that c 15 is approximatelyequal to[3][4][5][6]6. ConclusionsThe random processes theory deliver concepts andtheorems that enable to construct stochastic modelsconcerning the incidents or (and) accidents.Counting processes and processes with independentincreaments are the most appropriate for modellingnumber of the dangerous events and accidents[7]46theory of reliability and life testing. New York:Holt, Rinchart and Winston, Inc.Cinlar, E. (1969). Markov renewal theory. Adv.Appl. Probab. No 2,1; 1969: 123-187.Feller, W. (1964). On semi-Markov processes.Proc. Nat. Acad. Sci. USA 1964; 51; No 4:653-659.Fisz, M. (1969). Probability and MathematicalStatistics., Warsaw PWN; (in Polish).Grabski F. (2002). Semi-Markov models ofreliability and operation. Warsaw : IBS PAN;(in Polish).Grabski, F. (2015). Semi-Markov Processes:Applications in Systems Reliability andMaintenance. Elsevier; Amsterdam, Boston,Heidelberg, London, New York, Oxford, Paris,San Diego, San Francisco, Sydney.Limnios, N. & Oprisan, G. (2001). SemiMarkovProcesses and Reliability. Boston;Birkhauser.
Journal of Polish Safety and Reliability AssociationSummer Safety and Reliability Seminars, Volume 8, Number1, 2017[8] Shiryayev, A. N. (1984). Probability. SpringerVerlag, New York, Berlin, Heidelberg, Tokyo.[9] Baltic LINes (2016). Shipping in the Baltic Sea– Past, present and future developmentsrelevant for Maritime Spatial Planning. ProjectReport I. 35 p.[10] HELCOM (2014). Annual report on shippingaccidents in the Baltic Sea area during 2012.43 pp.[11] HELCOM (2014). Annual report on shippingaccidents in the Baltic Sea in 2013.47
Different types of cruises in ships crossing in the Baltic Sea during 2006-2013 Based on data coming from[10] we have drawn up Figure 3 that shows a total number of shipping accidents in the Baltic Sea during 2006-2013. According to the reports 149 ship accidents occurred in the Baltic Sea area in 2013, which is the