Transcription
Lab Report #2: Poisson’s RatioDate Submitted: 1/8/13Name: Sarah BrownSection #4: T 10-12Instructor: Morgan DeLucaGroup Members:1. Maura Chmielowiec2. Travis Newberry3. Thomas CannonTitle: Poisson’s RatioEquipment:Instron Servohydraulic 22 kipsSpecimen:2024-T351 Aluminum AlloyAbstractThe overall purpose of this experiment was to determine Poisson’s ratio and see how close it agreedwith the accepted handbook value. Testing was performed on a flat piece of Aluminum Alloy with theinitial dimensions of width 1” and thickness 0.25”. By using the Instron Servohydraulic testingmachine, and a LabView program, uniaxial loading was applied to the specimen, and strains in the xdirection(axial strain) and y-direction(strain) were recorded. From our experiment Poisson’s ratio wasfound to be 0.306 (7.31% lower than the accepted value), also an Elastic Modulus of 11.163 Msi (5.31%higher than the accepted value, and 6.22% higher than the value obtained from Tensile Testing), and aShear Modulus of 4.274 Msi was found (5.27% higher than the accepted value. Overall, the experimentwas successful because we obtained a reasonable value for Poisson’s ratio, Elastic and Shear Modulus.Our experimental values are all within 10% of the accepted Handbook values according to Mat Web.
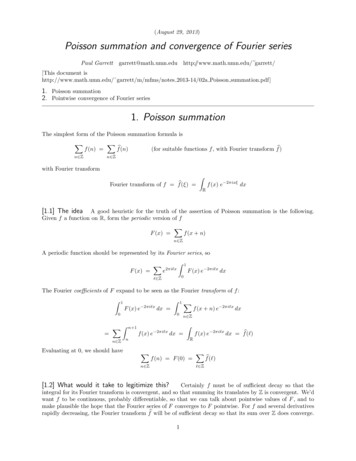
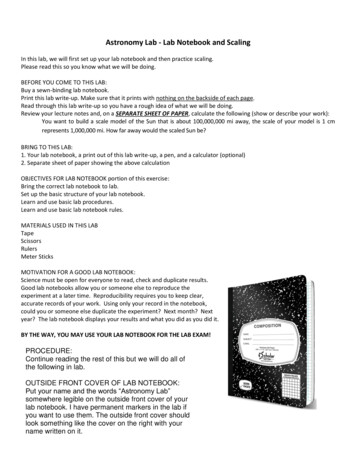
Elastic Modulus30000y 11.163xR² 0.999225000Stress (psi)20000150001000050000050010001500Axial Strain (μin/in)200025003000
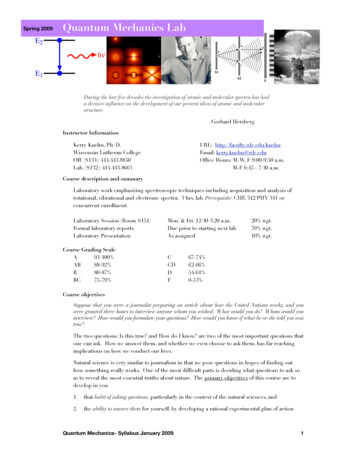
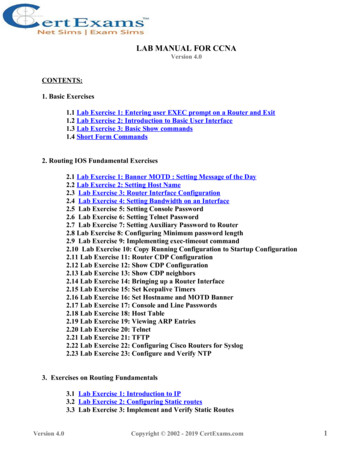
Strains vs. Load3000100y -0.1096xR² 0.99702500y 0.3583xR² 01000200030004000Load (lb)5000600070008000-800-900Lateral Strain (μin/in)Axial Strain (μin/in)-300Axial StrainLateral StrainLinear (Axial Strain)Linear (LateralStrain)
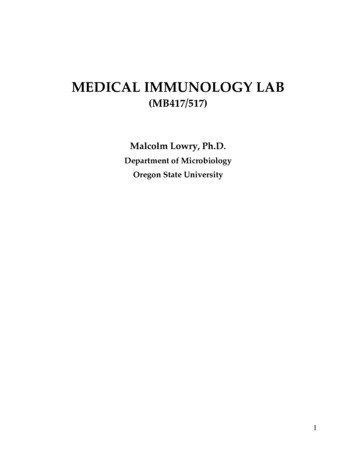
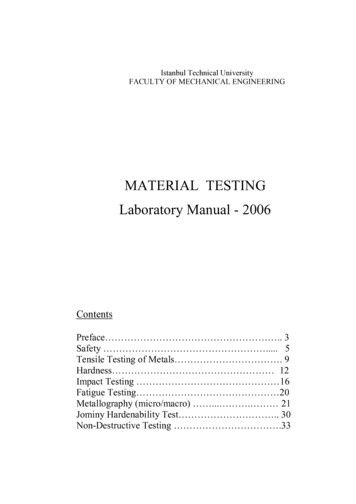
Materials Properties TableExperimental Handbook* % differencePoisson's Ratio0.3060.3307.31Elastic Modulus (Msi)11.16310.6005.31Shear Modulus (Msi)4.2744.0605.27*Mat Web for Aluminum 2024-T3Comparison to Tensile Testing Lab #1ExperimentalTension % differenceElastic Modulus (Msi)11.16310.496.22
Comments and Conclusions:1. Stress Calculation: In order to calculate the stress (in psi), the load (in lb) was divided by the area (inin2). There is a stress value for each applied load value, the stress is increasing as the loads increases.2. Elastic Modulus: The elastic modulus for this specimen of Aluminum was found by plotting the axialstrain (in μin/in) against the stress (in psi). After plotting these two values against one another a linearline of best fit is applied, the y-intercept is set to zero and the slope gives us the elastic modulus (in Msi).The R2 value displayed relates how well the trend line matches the data, an R2 value of .9992 shows thatthe data is very close to being linear. The experimental value for modulus of elasticity was 11.163 Msi,this value was 5.31% higher than the accepted handbook value.3. Axial Strain: The axial strain (in μin/in) was plotted against the applied load (in psi) by applying a lineartrend line a slope value can be obtained which will be used to calculate Poisson’s Ratio. The R2 valuedisplayed relates how well the trend line matches the data, an R2 value of .9992 shows that the data isvery close to being linear.4. Transverse Strain: On the same plot (adding a secondary y-axis) the transverse strain (in μin/in) wasplotted against the applied load (in psi). A linear best fit line was applied to the graph resulting in aslope value and an R2 value. The slope will be used to later calculate Poisson’s Ratio. The R2 valuedisplayed relates how well the trend line matches the data, an R2 value of .997 shows that the data isvery close to being linear.5. Poisson’s Ratio: The experimental value for Poisson’s Ratio was found by putting the slope of thetransverse strain plot over the slope of the axial strain plot and applying a negative ( –) Thevalue obtained from this experiment was 0.306 which was 7.31% lower than the handbook value, butoverall this value is acceptable and makes sense for this aluminum specimen.6. Shear Modulus: The shear modulus was also obtained for this experiment by dividing the ElasticModulus (in Msi) by 2 times the quantity 1 Poisson’s Ratio (). The value equated to 4.274Msi which was 5.27% higher than the accepted handbook value.7. Materials Properties Table: The Materials Property Table displays all the experimental values, theaccepted handbook values (from Mat Web) and how close the experimental values correspond to thehandbook values. This table show how well the experiment performed with accepted values as thebenchmark8. Material Properties Table Comparison: A second aspect to the Materials Properties table is thecomparison to the previous Tensile Testing experiment. We compared the experimental ElasticModulus value (11.163 Msi) to that found during the previous experiment (10.49 Msi). The valuesdiffered by 6.22%. This shows that both experiments were fairly accurate because both experimentsyielded a value under 10% difference of the accepted value, and only differed by 6.22%.
9. Conclusion: Overall, this experiment was successful because values for Poisson’s Ratio, ElasticModulus, and Shear Modulus were all calculated, and agree fairly well with the accepted value. Theultimate goal for this lab was to calculate Poisson’s Ratio for the Aluminum Alloy, and that wasaccomplished by obtaining a value that is sensible for this type of specimen.
From our experiment Poisson's ratio was found to be 0.306 (7.31% lower than the accepted value), also an Elastic Modulus of 11.163 Msi (5.31% higher than the accepted value, and 6.22% higher than the value obtained from Tensile Testing), and a Shear Modulus of 4.274 Msi was found (5.27% higher than the accepted value. Overall, the experiment