Transcription
RESEARCHSpatiotemporal Analyses of 2Co-Circulating SARS-CoV-2Variants, New York, USAAlexis Russell,1 Collin O’Connor,1 Erica Lasek-Nesselquist,1Jonathan Plitnick, John P. Kelly, Daryl M. Lamson, Kirsten St. GeorgeThe emergence of B.1.1.7 and additional novel SARSCoV-2 variants with competitive advantages has resulted in the localized dominance of single variants(E. Volz et al., unpub. data, https://doi.org/10.1101/2020.12.30.20249034) and raised concern for increasesin COVID-19 incidence (6).Novel variant B.1.526 (Iota) arose within NewYork State (NYS), USA, in late 2020 (E. Lasek-Nesselquist et al., unpub. data, https://doi.org/10.1101/2021.02.26.21251868) (7) and quickly increased inproportion throughout the state, leading to a noticeable shift in lineage distribution during early 2021 (E.Lasek-Nesselquist et al., unpub. data, https://doi.org/10.1101/2021.02.26.21251868) (31). The WorldHealth Organization designated B.1.526 as a variantof interest (VOI) because of its increase in prevalencecoupled with mutations associated with immuneevasion (8). Despite these concerns, an epidemiologicassessment of B.1.526 in NYC during January–April2021 found that the lineage did not cause more severedisease and was not associated with increased risk forreinfection or vaccine breakthrough (9). However, anepidemiologic study of NYS during late 2020–May2021 concluded that B.1.526 was 35% more transmissible than non-VOC and non-VOI lineages circulatingat the time (10).Genomic surveillance of COVID-19 is a crucial toolto monitor and assess the physiologic and epidemiologic characteristics of SARS-CoV-2 variants as theyemerge. The New York State Department of Health(NYSDOH) substantially expanded its genomic surveillance program in December 2020, with the aim ofsequencing a more representative subset of COVID-19cases across the state to track the spread and impact ofnovel variants. A robust genomic surveillance systemenables assessment of changes in variant distributionover precise temporal and spatial scales.The emergence of novel severe acute respiratory syndrome coronavirus 2 (SARS-CoV-2) variants in late 2020and early 2021 raised alarm worldwide because of theirpotential for increased transmissibility and immune evasion. Elucidating the evolutionary and epidemiologic dynamics among novel SARS-CoV-2 variants is essentialfor understanding the trajectory of the coronavirus diseasepandemic. We describe the interplay between B.1.1.7(Alpha) and B.1.526 (Iota) variants in New York State,USA, during December 2020–April 2021 through phylogeographic analyses, space-time scan statistics, and cartographic visualization. Our results indicate that B.1.526probably evolved in New York City, where it was displacedas the dominant lineage by B.1.1.7 months after its initialappearance. In contrast, B.1.1.7 became dominant earlier in regions with fewer B.1.526 infections. These resultssuggest that B.1.526 might have delayed the initial spreadof B.1.1.7 in New York City. Our combined spatiotemporalmethodologies can help disentangle the complexities ofshifting SARS-CoV-2 variant landscapes.The emergence of a novel severe acute respiratorysyndrome coronavirus 2 (SARS-CoV-2) variantB.1.1.7 (Alpha) in the United Kingdom in late 2020raised alarm worldwide and prompted major reassessment of the management, surveillance, and projected future of coronavirus disease (COVID-19) (1,2).Evidence of increased transmissibility and potentialimmune evasion prompted the World Health Organization to designate B.1.1.7 a variant of concern (VOC)in December 2020 (3–5; W.A. Haynes et al., unpub.data, r affiliations: New York State Department of Health, Albany,New York, USA (A. Russell, C. O’Connor, E. Lasek-Nesselquist,J. Plitnick, J.P. Kelly, K. St. George); State University of New Yorkat Buffalo, Buffalo, New York, USA (C. O’Connor); StateUniversity of New York at Albany, Albany (E. Lasek-Nesselquist,K. St. George)DOI: https://doi.org/10.3201/eid2803.2119726501These authors contributed equally to this article.Emerging Infectious Diseases www.cdc.gov/eid Vol. 28, No. 3, March 2022
Spatiotemporal Analyses of SARS-CoV-2 VariantsThis study employed spatial scan statistics pairedwith phylogeographic analyses to describe the shifting SARS-CoV-2 variant landscape in NYS duringDecember 2020–April 2021, specifically the interplaybetween co-circulating B.1.526 and B.1.1.7 lineages.Our findings elucidate the dynamics of competingSARS-CoV-2 variants at a time when the highly transmissible VOC Delta had overtaken B.1.1.7 worldwideand future variant displacements were likely to occur.MethodsSample Acquisition and RNA ExtractionThis study was approved by the NYSDOH Institutional Review Board, under study numbers 02-054and 07-022. The NYSDOH Wadsworth Center coordinated with 30 clinical laboratories throughoutNYS that routinely submitted respiratory swabs positive for SARS-CoV-2 for whole-genome sequencing(WGS). Specimens were required to have a real-timecycle threshold value 30. We performed nucleic acidextraction on a MagNAPure 96 with the Viral NASmall Volume Kit (Roche, https://www.roche.com)with 100 μL sample input and 100 μL eluate.Sequencing and Bioinformatics ProcessingWe processed extracted RNA for WGS with a modified ARTIC V3 protocol (https://artic.network/ncov-2019) in the Applied Genomics TechnologyCore at the Wadsworth Center as previously described (11) (Appendix, 1.pdf). We processedIllumina libraries with the ARTIC nextflow tic-nf)as previously described (14) (Appendix).Sample Inclusion CriteriaWe included specimens with collection dates duringDecember 2020–April 2021 with ZIP codes of patientaddresses. We removed specimens that were prescreened for specific mutations or for clinical or epidemiologic criteria. For persons with multiple specimenscollected, we included only the earliest specimen.COVID Incidence CalculationWe obtained monthly COVID-19 case counts by ZIPcode from online NYC COVID-19 data (https://github.com/nychealth/coronavirus-data) and fromthe NYSDOH Communicable Disease Electronic Surveillance System. We included reports with case status of confirmed or probable in the case count andassigned a month on the basis of diagnosis date. Weconverted ZIP code data to ZIP code tabulation area(ZCTA) and calculated incidence using populationdata from the 2019 1-year American Community Survey estimates (https://data.census.gov/cedsci).Retrospective Multinomial Space-Time Scan StatisticWe used the retrospective multinomial space-timescan statistic in SaTScan version 9.6 and applied thenonordinal method (12,13). We calculated estimatedSARS-CoV-2 variant data for each ZCTA-month aggregation by multiplying the proportion of eitherB.1.1.7, B.1.526, or other variants in our sample by thetotal number of COVID-19 cases.We set the maximum cluster size parameter apriori to 10% of the population at risk (14) . Spacetime cluster detection in SaTScan has a noted limitation where the size of clusters cannot change overtime (15,16). Given that our data are aggregated to thetemporal unit of months (December 2020–April 2021),we set the maximum temporal cluster size parameterto 1 month, to enable clusters to change their shapefrom month to month by being designated as newclusters (Appendix).Inverse-Distance Weighted Interpolation and SpatialAverage of SARS-CoV-2 Whole-Genome SequencingWe used inverse-distance weighted (IDW) interpolation to visualize the spatiotemporal variation in theproportion of COVID-19 cases attributable to eachSARS-CoV-2 variant in NYS and to provide estimatesfor these proportions in areas where we were missingdata (17). We assigned the percentage of COVID-19cases attributable to each variant per ZCTA to theZCTA’s centroid for the IDW calculation. IDW interpolation generated a continuous surface of valuesrepresenting the percentage of total COVID-19 casesattributed to B.1.1.7 and B.1.526, which we then averaged over each ZCTA geometry.We then multiplied the estimated percentage ofeach SARS-CoV-2 variant generated from IDW interpolation by the total number of COVID-19 cases foreach ZCTA and month to estimate the total numberof COVID-19 cases attributable to each variant. Estimated numbers of variant cases generated geographic mean centers for each month of the study period(18) (Appendix).Phylogeographic AnalysesWe incorporated into the analysis all NYS B.1.526 genomes generated by Wadsworth from the study period, barring a small fraction that did not pass qualitycontrol and those removed as redundant (Appendix).We downloaded all B.1.526 genomes from the United States and associated metadata (excluding NYSEmerging Infectious Diseases www.cdc.gov/eid Vol. 28, No. 3, March 2022651
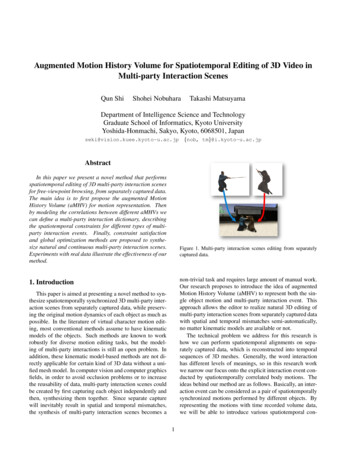
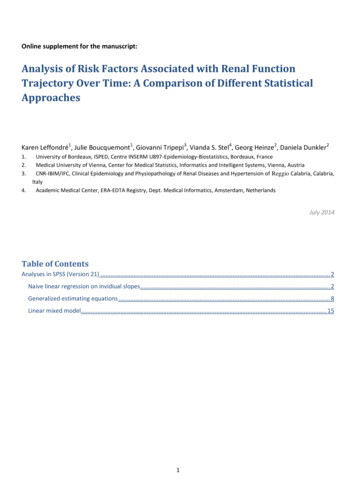
RESEARCHsequences) from GISAID (https://www.gisaid.org)and randomly subsampled them proportionally totheir overall frequency in the United States. The final dataset included B.1.526 genomes from domesticlocations (Massachusetts, New Jersey, Pennsylvania,Connecticut, California, Florida, Maryland, Michigan, Minnesota, and North Carolina), the 5 boroughsof NYC (Bronx, Brooklyn, Queens, Staten Island, andManhattan), Long Island, the Hudson Valley andupstate New York (Western NYS, the Finger Lakes,the Capital District, and Central NYS regions). Wealigned genomes in mafft 7.475 (19), masking problematic sites (https://github.com/W-L/ProblematicSites SARS-CoV2). We generated a maximumlikelihood phylogeny in IQTree 1.6.12 (20) with 1,000ultrafast bootstrap replicates (21) and time-calibratedit in TreeTime 0.7.6 (22). This tree served as the fixedtree for ancestral state reconstruction in Beast 2.6.2(23) to infer timing and source of B.1.526 introductions within NYS. We allowed the Bayesian analysisto run for 4 million generations and monitored it inTracer 1.7.1 (24) until the effective sample size of allparameters 200 and the Markov chain Monte Carloappeared to reach stationarity.We conducted a B.1.1.7 phylogeographic analysisin the same manner with the states inferred for a fixedtopology until all effective sample sizes reached 200.The final dataset included B.1.1.7 genomes from domestic locations (Massachusetts, New Jersey, Pennsylvania, Connecticut, California, and Florida) NYC,Long Island, Mid-Hudson, Finger Lakes, southwestern NYS (the Southern Tier and western regions ofNYS) and Northern NYS (Capital District, MohawkValley, Central NYS, and the North Country).We generated maximum clade credibility treesfor B.1.526 and B.1.1.7 in TreeAnnotator 2.6.2 (23) witha 10% burn-in. We summarized the number of introductions between locations by using Baltic (https://github.com/evogytis/baltic), adopting the explodedtree script for Python 3. We considered only introductions with a posterior probability 0.7. We visualizedand annotated trees in FigTree 1.5.5 (http://tree.bio.ed.ac.uk/software/figtree) and ggtree (25) for R 4.1.0(http://www.R-project.org) (Appendix).ResultsSummary StatisticsWe included in the study a total of 8,517 SARS-CoV-2specimens sequenced by Wadsworth with collectiondates during December 2020–April 2021. Among theincluded specimens, B.1.1.7 constituted 1,107 (13%)and B.1.526 constituted 904 (10.6%) of the samples.652The earliest B.1.1.7 samples sequenced by Wadsworth were collected on December 24, 2020, from a resident of Manhattan (Metro or NYC region) and a personin Saratoga County (Capital Region). B.1.1.7 remainedrelatively rare among all samples through the end ofJanuary. The Metro and Capital regions experienced theearliest increases in B.1.1.7, although the proportion ofB.1.1.7 did not exceed 15% through February. The proportion of B.1.1.7 increased in March across all regions,most notably in the western region, where it constituted 75% of all samples by the end of March and continuedto rise through April. The Metro Region experienced themost gradual increase in B.1.1.7; the proportion did notexceed 40% until the end of April.The earliest B.1.526 sample sequenced by Wadsworth was collected on December 9, 2020, from apatient in the Bronx (Metro or NYC region). Theproportion of B.1.526 increased in the Metro Regionthroughout December, reaching 10% of total samplesby the end of the month. The proportion of B.1.526 inthe Metro Region approached 40% by the end of January, peaked at 60% in mid-February to early March,and then plateaued at 50% through April. B.1.526was not consistently detected in the other regionsuntil February and its proportion generally remained 40%. The combined proportion of all lineages otherthan B.1.1.7 and B.1.526 dropped to 20% in all NYSregions by the end of April.Cartographic VisualizationMaps of interpolated proportion of B.1.1.7 relative toall other lineages by ZCTA (Appendix Figure 1, panelA) show a general trend of spread through the southern portion of NYS in January, statewide distributionby February, diffuse increase in proportion in March,and a sustained high proportion throughout the statein April, with strong dominance in the western region. In contrast, maps of interpolated proportion ofB.1.526 show more constricted initial spread focusedaround NYC and surrounding areas in January; statewide distribution was not achieved until March, anda moderate proportion was sustained mostly withinthe Metro Region (Appendix Figure 1, panel B).Maps of geographic mean centers of estimatedB.1.1.7 and B.1.526 cases (Figure 1) show that shifts in theSARS-CoV-2 variant landscape affected the spatial distribution of COVID-19 cases overall. In December 2020,the mean center of total COVID-19 cases and the meancenter of the population of NYS were nearly spatiallycoincident, implying that COVID-19 cases were distributed in accordance with NYS’s population. At the sametime, the mean center of B.1.526 cases occurred near theNYC area, then gradually moved slightly northwest asEmerging Infectious Diseases www.cdc.gov/eid Vol. 28, No. 3, March 2022
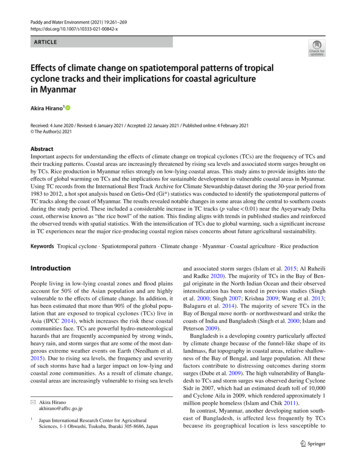
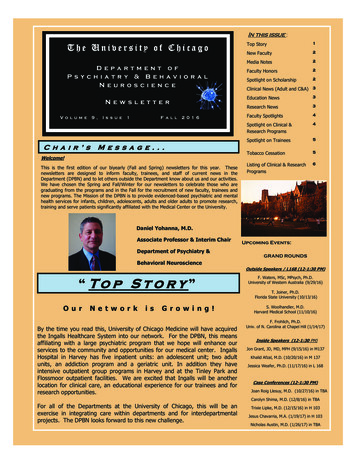
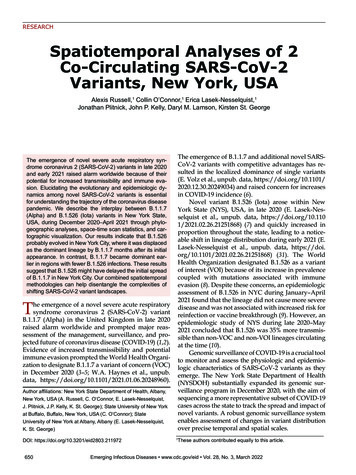
Spatiotemporal Analyses of SARS-CoV-2 VariantsFigure 1. Geographicallyweighted mean centers of totaland estimated coronavirusdisease cases attributable toB.1.526 and B.1.1.7 variants,New York State, USA,December 2020–April 2021.Cluster centroids refer to theresults of the multinomial spacetime scan analysis (Figure2). New York’s centroid andgeographic center of populationare added as reference points.B.1.526 expanded modestly into upstate regions. Similarly, the mean center of B.1.1.7 cases was located nearNYC in December 2020, then moved northwest during March and April to a much greater degree than forB.1.526 cases, probably because of the B.1.1.7 cluster occurring in the Finger Lakes region. Consequently, thespread of B.1.1.7 in upstate NYS, especially within thewestern region, resulted in a northwesterly shift of themean center of total COVID-19 cases by April 2021. Thespatial shift pushed the mean center of COVID-19 casesnorthwest of NYS’s population center, indicating thatthe April B.1.1.7 cluster had an outsized effect on theoverall distribution of COVID-19 cases.Retrospective Multinomial Space-Time Scan StatisticRetrospective multinomial space-time scan analysisindicated 6 statistically significant clusters with elevated relative risk (RR) of COVID-19 attributable tospecific variants (Figure 2; Appendix Table 1). Twoclusters of elevated RR of other lineages were foundin December, 2020 in the Metro and Capital regions aswell as Long Island, reflecting the nearly nonexistentrisk for B.1.1.7 and B.1.526 infection. Three clustersof elevated RR of multiple combinations of B.1.1.7,B.1.526, B.1.526.1, and B.1.526.2 were found in March2021 in the NYC and Long Island regions. The sixthcluster exhibited an elevated RR of 7.0 for B.1.1.7,with a radius of 114.38 km centered in the FingerLakes area (western and central regions) during April.In addition, the presence of B.1.1.7 and B.1.526 clustersin March and April coincide with a general statewidedecrease in incidence of COVID-19 (Figure 2).Phylogeographic AnalysesThe final B.1.526 dataset for phylogenetic reconstruction contained 980 genomes from all regions of NYSand various domestic locations (Bronx, 222; HudsonValley, 128; Brooklyn, 39; Long Island, 78; Manhattan,49; Queens, 81; Staten Island, 12; upstate NYS, 81; domestic, 290). The final B.1.1.7 dataset contained 1,195genomes from the NYC region (181), Finger Lakes(239), Hudson Valley (78), Long Island (130), Western NYS and the Southern Tier (southwestern NYS,56), Capital District, Mohawk Valley, Central NYS,and the north country (Northern NYS, 149), as wellas other states (domestic, 362). Results from the phylogeographic analysis indicated that B.1.526 emergedwithin the NYC area near the end of 2020 and that theBronx was a major source of spread to other regionsof NYS and the United States (domestic) (Figure 3).Although sampling biases could have influenced thenumber of introductions assigned to the Bronx, thedomestic category had greater representation in thedataset but led to substantially fewer introductions(Appendix Table 2). Domestic genomes represented29.5% of the dataset but this location was responsibleEmerging Infectious Diseases www.cdc.gov/eid Vol. 28, No. 3, March 2022653
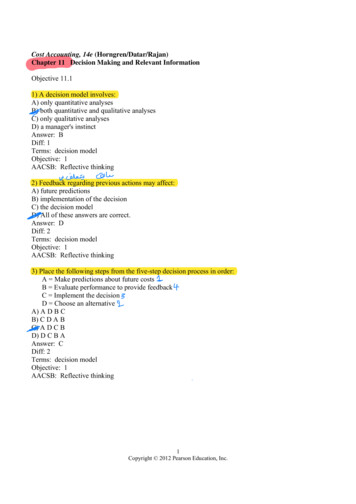
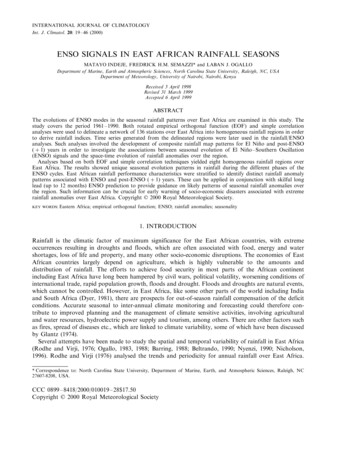
RESEARCHfor only 6.7% of all B.1.526 introductions, whereasthe Bronx represented 22.7% of the dataset and ledto 63.8% of all introductions (Appendix Table 2).Excluding the Bronx, B.1.526 transmission betweenboroughs and from these boroughs to other locationswas relatively infrequent. We used subsamplingstrategies to investigate the strength of our resultsfrom the full B.1.526 phylogeographic analysis. Thesestrategies included evenly sampling each region orborough, sampling evenly across time (except for December, which had very few B.1.526 cases comparedwith other months), sampling proportionally to thetotal incidence of SARS-CoV-2 per region or borough,and downsampling high-incidence regions or boroughs to the mean of B.1.526 cases per month. Weperformed each subsampling analysis in triplicate.Despite the different subsampling strategies, the rootof the tree consistently fell within NYC, and the Bronxcontinued to serve as a major source of B.1.526 (datanot shown).Multiple domestic introductions contributed tothe initial presence of B.1.1.7 in NYS (11) (Figure 4),with transmission occurring most frequently in theFinger Lakes and Northern NYS (Figure 4). The Finger Lakes and Northern NYS were well-representedin the dataset (32% of genomes) but contributedsubstantially less to the distribution of B.1.1.7 (accounting for 13% of the total number of introductions) than domestic sites, which represented 20% ofthe data and were responsible for the highest percentage of introductions ( 39%) (Appendix Table3). The Finger Lakes showed the lowest proportionof sequenced cases attributable to introductions butthe largest sample size in NYS, suggesting more sustained transmission of B.1.1.7 in this region.DiscussionThe repeated emergence of novel variants of SARSCoV-2 has largely defined the COVID-19 pandemicresponse in 2021. As vaccination rates, prior exposure levels, and behavioral public health measurescontinuously change, so too will selective pressures(26). Given that selective pressures likely vary acrossregions, it follows that the emergence and spread ofSARS-CoV-2 variants are also regionally dynamic.We combined spatial statistical, phylogeographic,and cartographic visualization techniques to examine the spatiotemporal dynamics of the VOC B.1.1.7(Alpha) and the VOI B.1.526 (Iota) in NYS during December 2020–April 2021.The concurrent spread of B.1.1.7 and B.1.526 offers a unique opportunity to compare the dynamics of competing variants of SARS-CoV-2 within apopulation during a period of substantial fluctuations in statewide COVID-19 incidence and the implementation of a vaccination campaign in January2021. Shortly after its appearance in the Bronx in late2020, B.1.526 quickly became the most common lineage in NYC and the surrounding region. The rapid dominance of B.1.526 in NYC is corroborated byour phylogeographic results (Figure 3), which depictwidespread initial transmission within the Bronx,periodic introductions to neighboring boroughs, andlater introductions to the greater Metro Region andFigure 2. Severe acute respiratory syndrome coronavirus 2 variant clusters identified from retrospective multinomial space-time scananalysis and coronavirus disease incidence by ZIP code tabulation area, New York State, USA, December 2020–April 2021. Circlesindicate clusters with relative risk 1. 1, variant includes B.1.526, B.1.526.1, and B.1.526.2; 2, variant includes B.1.526 and B.1.526.2.654Emerging Infectious Diseases www.cdc.gov/eid Vol. 28, No. 3, March 2022
Spatiotemporal Analyses of SARS-CoV-2 VariantsFigure 3. Time-calibrated phylogeny of severe acute respiratory syndrome coronavirus 2 variant B.1.526, New York and other states,USA, December 2020–April 2021. Left panel represents a maximum-likelihood phylogeny of 980 genomes from New York and otherUS states generated in IQTree 1.6.12 (20) with timescale inferred by TreeTime 0.7.6 (22) and ancestral state reconstruction performedin BEAST 2.6.2 (23). Faceted panels indicate the source of B.1.526 introductions into different regions of New York and other states(domestic). Only introductions supported by an ancestral state probability of 0.7 are shown. Bottom panel shows locations sampledand sample sizes. A, April; J, January; O, October.Emerging Infectious Diseases www.cdc.gov/eid Vol. 28, No. 3, March 2022655
RESEARCHother states. The spread of B.1.526 appears to havebeen spatially limited by the repeated introductionand transmission of B.1.1.7 outside NYC. However,behaviors such as differences in travel rates in NYCand between NYC and other regions probably contributed to the dynamics we observed. Similarly, theregional success of either variant may depend on theseroprevalence of the population. B.1.351 (Beta) waspredicted to dominate in populations with a high degree of naturally acquired immunity because of immune evasion conferred by the E484K mutation inSpike (C.L. Althaus et al., unpub. data, https://doi.org/10.1101/2021.06.10.21258468), a mutation alsoobserved in most NYS B.1.526 genomes. The spikemutations of B.1.526 (including the E484K mutation)were shown to reduce neutralization activity of convalescent-phase plasma and several antibodies (10).Thus, founder effects in an area of high transmissioncombined with high levels of prior exposure to SARSCoV-2 might have provided B.1.526 its initial growthadvantages in the NYC area, which was also the initial epicenter of the pandemic in the United States.Regions of NYS where B.1.526 had not yet establishedexperienced rapid dominance of B.1.1.7 during Marchand April. This trend is most clearly seen in the nearcomplete displacement of all other lineages by B.1.1.7in Western NYS (Appendix Figure 2, panel A), resulting in a large cluster of elevated RR for B.1.1.7 cases inthe Finger Lakes region during April (Figure 2). Thisfinding is consistent with the enhanced transmissibility of B.1.1.7 in comparison to non-VOCs and nonVOIs and the conclusion that B.1.1.7 will dominate inpopulations with lower seroprevalence (C.L. Althauset al., unpub. data, https://doi.org/10.1101/2021.06.10.21258468), such as those outside the NYC area.The multinomial spatial scan detected 3 uniqueclusters in March 2021, all with increased RR forB.1.1.7 and B.1.526. The values for RR in each NYCcluster detail a distinct pattern: clusters centeredwithin the Bronx, Brooklyn, and Manhattan hadhigher RR for B.1.526, whereas the cluster centeredin east Queens and Long Island had a higher RR forB.1.1.7 (Appendix Table 1). During the months after B.1.526’s initial advantage in NYC, B.1.1.7 trendstoward becoming the major variant in the MetroRegion. Given the elevated reproductive numberof B.1.1.7 and B.1.526 in comparison to other nonVOC/VOIs lineages (27) and the delayed dominanceof B.1.1.7 in the Bronx compared with Long Islandand Queens, we hypothesize that B.1.526 was moredifficult to displace than other lineages circulatingat the time. Almost no difference can be observed inthe average global reproductive number of B.1.526656compared with B.1.1.7, although differences exist ona country level (27). This finding supports the ideathat B.1.526 was generally more competitive againstB.1.1.7 than background lineages, but other factors,including the location examined, probably influenceour results.Similarly, maps of the geographic mean centers of the estimated number of COVID-19 cases attributable to each variant capture the rapid spreadof B.1.1.7 out of NYC and the relative inability ofB.1.526 to claim a foothold outside of the MetroRegion. The northwesterly shift in the trajectory ofoverall COVID-19 cases in April indicates that theexpansion of B.1.1.7, in particular clustering in western NYS, had a measurable influence on the spatialspread of COVID-19 cases overall.There are some limitations to our study. A degree of selection bias exists within the dataset, giventhat specimens were screened by cycle thresholdvalue and were submitted by a selected group ofclinical and commercial laboratories that cannotperfectly represent all COVID-19 cases in NYS. Wewere unable to assess the demographic and clinical representativeness of our dataset because thesedata were not available to us. In addition, the number of specimens sequenced varied over the spaceand time of the study period, which created smallsample sizes within many ZCTA-months. This limitation extended to the multinomial scan statistic,which was run with estimated values for COVID-19cases attributable to B.1.1.7 and B.1.526, giving allZCTAs with samples equal weight. However, thespatial scan assesses data according to their proximity to each other. In this context, ZCTAs areanalyzed together rather than individually, whichhas the potential to reduce bias. Another consequence of our limited sampling was that our dataexhibited zero samples from many ZCTAs for eachmonth, which we addressed by using IDW interpolation of the proportion of B.1.1.7 and B.1.526sequenced samples at the ZCTA-month level tovisualize general patterns of variant proportionsover geography. Phylogeographic analyses werehampered by similar limitations; uneven samplingamong regions and the lack of global representationin our datasets could lead to incorrect trait assignments. Smaller sample sizes for some regions mighthave caused an underestimation of their contributions to variant transmission in NYS, whereas largersample sizes might have inflated the number of introductions assigned. However, we believe our results largely capture the transmission dynamics ofB.1.526 and B.1.1.7 in NYS, given that larger sampleEmerging Infectious Diseases www.cdc.gov/eid Vol. 28, No. 3, March 2022
Spatiotemporal Analyses of SARS-CoV-2 VariantsFigure 4. Time-calibrated phylogeny of severe acute respiratory syndrome coronavirus 2 variant B.1.1.7, New York and other states,USA, December 2020–April 2021. Left panel represents a maximum-likelihood phylogeny of 1,195 genomes from New York and otherstates generated in IQTree 1.6.12 (20) with timescale inferred by TreeTime 0.7.6 (22) and ancestral state reconstruction performed inBEAST 2.6.2 (23). The tree was rooted with a P.1 genome (not shown). Faceted panels indicate the source of B.1.1.7 introductions intodifferent regions of New York and other states (domestic). Only introductions supported by an ancestral state probability of 0.7 areshown. Bottom panel shows locations sampled and sample sizes. A, April; J, January; O, October.Emerging Infectious Diseases www.cdc.gov/eid Vol. 28, No. 3, March 2022657
RESEARCHsizes did not always correspond to regions with outsized contributions to the spread of either variant, andsubsampling the B.1.526 dataset consistently showedNYC as the dominant source of introductions.Our phylogeographic and spatiotemporal analyses offer a method for evaluating the competitive advantages of co-circulating SARS-CoV-2 variants. Webelieve the emergence of VOI B.1.526 contributed tothe slower rise of VOC B.1.1.7 as the dominant lineagein NYC compared with regions devoid of B.1.526. Inthis way, our study describes important dynamic interactions between variants with unequal transmissibility and is potentially generalizable to interactionsbetween any known variants, including the highlytransmissible Delta and Omicron variants and othervariants to come.AcknowledgmentsThe authors gratefully acknowledge the AdvancedGenomic Technologies Core of the Wadsworth Center,where all next-generation sequencing was performed.We also graciously thank the New York State clinicallaboratories that submitted SARS-CoV-2–positivespecimens to Wadsworth for sequence analysis, alloriginating and submitting laboratories for theirSARS-CoV-2 sequence contributions to the GISAIDdatabase, Wadsworth Center’s Virology Laboratory forinitial processing of specimens, and the BioinformaticsCore for sequence processing and analysis.Initial funding for sequencing was generously providedby the New York Community Trust. The work for thispublication was also funded by the Centers for DiseaseControl and Prevention (cooperative agreement no.NU50CK000516). Its contents are solely the responsibilityof the authors and do not necessarily represent the officialviews of the Centers for Disease Control and Prevention orthe Department of Health and Human Services.A.R., C.O., E.L.-N., J.P., J.P.K., and D.M.L. declare no conflicts of interest. K.S.G. receives research supportfrom ThermoFisher for the evaluation of new assays forthe diagnosis and characterization of viruses, and hasa royalty-generating collaborative agreement withZeptometrix.Author contributions: A.R. and C.O. conceived of themanuscript. A.R., C.O., and E.L.-N. analyzed data,i
Long Island, Mid-Hudson, Finger Lakes, southwest-ern NYS (the Southern Tier and western regions of NYS) and Northern NYS (Capital District, Mohawk Valley, Central NYS, and the North Country). We generated maximum clade credibility trees for B.1.526 and B.1.1.7 in TreeAnnotator 2.6.2 (23) with a 10% burn-in. We summarized the number of intro-