Transcription
INTERNATIONAL JOURNAL OF CLIMATOLOGYInt. J. Climatol. 20: 19–46 (2000)ENSO SIGNALS IN EAST AFRICAN RAINFALL SEASONSMATAYO INDEJE, FREDRICK H.M. SEMAZZI* and LABAN J. OGALLODepartment of Marine, Earth and Atmospheric Sciences, North Carolina State Uni6ersity, Raleigh, NC, USADepartment of Meteorology, Uni6ersity of Nairobi, Nairobi, KenyaRecei6ed 3 April 1998Re6ised 31 March 1999Accepted 6 April 1999ABSTRACTThe evolutions of ENSO modes in the seasonal rainfall patterns over East Africa are examined in this study. Thestudy covers the period 1961–1990. Both rotated empirical orthogonal function (EOF) and simple correlationanalyses were used to delineate a network of 136 stations over East Africa into homogeneous rainfall regions in orderto derive rainfall indices. Time series generated from the delineated regions were later used in the rainfall/ENSOanalyses. Such analyses involved the development of composite rainfall map patterns for El Niño and post-ENSO( 1) years in order to investigate the associations between seasonal evolution of El Niño – Southern Oscillation(ENSO) signals and the space-time evolution of rainfall anomalies over the region.Analyses based on both EOF and simple correlation techniques yielded eight homogeneous rainfall regions overEast Africa. The results showed unique seasonal evolution patterns in rainfall during the different phases of theENSO cycles. East African rainfall performance characteristics were stratified to identify distinct rainfall anomalypatterns associated with ENSO and post-ENSO ( 1) years. These can be applied in conjunction with skilful longlead (up to 12 months) ENSO prediction to provide guidance on likely patterns of seasonal rainfall anomalies overthe region. Such information can be crucial for early warning of socio-economic disasters associated with extremerainfall anomalies over East Africa. Copyright 2000 Royal Meteorological Society.KEY WORDS: EasternAfrica; empirical orthogonal function; ENSO; rainfall anomalies; seasonality1. INTRODUCTIONRainfall is the climatic factor of maximum significance for the East African countries, with extremeoccurrences resulting in droughts and floods, which are often associated with food, energy and watershortages, loss of life and property, and many other socio-economic disruptions. The economies of EastAfrican countries largely depend on agriculture, which is highly vulnerable to the amounts anddistribution of rainfall. The efforts to achieve food security in most parts of the African continentincluding East Africa have long been hampered by civil wars, political volatility, worsening conditions ofinternational trade, rapid population growth, floods and drought. Floods and droughts are natural events,which cannot be controlled. However, in East Africa, like some other parts of the world including Indiaand South Africa (Dyer, 1981), there are prospects for out-of-season rainfall compensation of the deficitconditions. Accurate seasonal to inter-annual climate monitoring and forecasting could therefore contribute to improved planning and the management of climate sensitive activities, involving agriculturaland water resources, hydroelectric power supply and tourism, among others. There are other factors suchas fires, spread of diseases etc., which are linked to climate variability, some of which have been discussedby Glantz (1974).Several attempts have been made to study the spatial and temporal variability of rainfall in East Africa(Rodhe and Virji, 1976; Ogallo, 1983, 1988; Barring, 1988; Beltrando, 1990; Nyenzi, 1990; Nicholson,1996). Rodhe and Virji (1976) analysed the trends and periodicity for annual rainfall over East Africa.* Correspondence to: North Carolina State University, Department of Marine, Earth, and Atmospheric Sciences, Raleigh, NC27607-8208, USA.CCC 0899–8418/2000/010019 – 28 17.50Copyright 2000 Royal Meteorological Society
20M. INDEJE ET AL.Spectral analysis of the time series revealed major peaks centred on 2–2.5, 3.5 and 5.6 years. Ogallo(1980) and Ogallo et al. (1994) have shown the existence of three major peaks, centred on theQuasi-Biennial Oscillation (QBO) of 2.5 – 3.7 years, El Niño–Southern Oscillation (ENSO) of 4.8–6 yearsand the sunspot cycle of 10 – 12.5 years. Nicholson and Nyenzi (1990) and Nicholson (1996) observed astrong quasi-periodic fluctuation in the East African with a time scale of 5–6 years corresponding to theENSO and sea surface temperature (SST) fluctuations in the equatorial Indian and Atlantic Oceans.Several studies have used principal component analysis techniques to examine the temporal and spatialvariability of rainfall in East Africa (Atwoki, 1975; Ogallo, 1980, 1983, 1988, 1989; Barring, 1988; Nyenzi,1990; Semazzi et al., 1996). Ogallo (1989) investigated rainfall variability using the rotated principalcomponent analysis (RPCA) method, to characterize the seasonal rainfall over East Africa for the period1922–1983. The results showed seasonal shifts in the patterns of the dominant RPCA modes that weresimilar to the seasonal migration of the rainfall patterns associated with the Inter-tropical ConvergenceZone (ITCZ). The first two eigenvectors, which generally represent the dominant wet and dry episodes,accounted for a maximum of 58% of the variance. Recent singular value decomposition (SVD) work bySemazzi and Indeje (1999) has identified the bipolar nature of rainfall over southern and eastern Africa.There is at least the implication of a pattern with wave-like features that travel northwards from southernAfrica to eastern Africa and the migration of the ENSO-related rainfall anomalies across the entirecontinent of Africa during the annual cycle.The ENSO phenomena is known to be a fundamental and quasi-periodic feature of the oceanatmosphere system, with periodicities ranging from seasonal to about 8 years (Rasmusson and Carpenter,1983; Halpert and Ropelewski, 1992). Some extreme rainfall anomalies in East Africa have beenassociated with ENSO (Ropelewski and Halpert, 1987; Janowiak, 1988; Ogallo, 1988, among others).Ropelewski and Halpert (1987) in their study of the relationship between global rainfall and the SouthernOscillation Index (SOI), concluded that, although the statistical association between rainfall over EastAfrica and the SOI was weak, there was a high probability of abnormally wet conditions in the regionduring El Niño years. The 1997 – 1998 ENSO event associated with catastrophic disruption of socio-economic infrastructure and loss of life in East Africa appears to give further support to this notion. Ogallo(1988) observed significant teleconnections between the SOI and seasonal rainfall over parts of EastAfrica, especially during the northern hemisphere autumn and summer seasons, with the strongestrelationships being observed along the Kenyan coast in autumn. Janowiak (1988) showed evidence ofassociation between rainfall anomalies during the austral summer over eastern and southeastern Africaand both the warm (El Niño) and cold (La Niña) phases of ENSO events. The high skill in predictingENSO phases up to a year in advance (Cane et al., 1986) suggests high prospects of successful applicationsof ENSO forecasts to seasonal climate prediction in East Africa. ENSO explains about 50% of the EastAfrican rainfall variance (Ogallo, 1988), with other factors explaining the remaining variance. Sustainabledevelopment in East Africa could benefit significantly from these recent advances in the prediction ofshort-term climate variability.A considerable amount of research work has been done in the East African region to explorerainfall/ENSO relationships. Relatively less attention has been directed to the investigation of the effectsof ENSO on rainfall in different sub-regions of East Africa. The objective of this study is to identify forthe sub-regions of East Africa aspects of rainfall variability which are associated with ENSO. First, weperform cluster analysis on data for the East African rainfall stations network, using both the EOF andsimple correlation analysis to identify homogeneous regions of climate variability. Then we investigate theteleconnections between East African seasonal rainfall and ENSO to find seasons and regions that arewet/dry during the El Niño onset and post-ENSO ( 1) years. The analysis is based on performingcomposite rainfall map patterns corresponding to the timing of the ENSO onset and post-ENSO ( 1)years to delineate regions that are wet/dry during these episodes, thus providing geographically detailedinformation on the climatic risks to be expected when ENSO phenomena occur. The area of study coversthree countries (Kenya, Uganda and Tanzania) which are within the drought monitoring project for East,Central and Southern Africa. The region is enclosed by latitudes 5 N–12 S and longitudes 29 E–42 E(Figure 1(a)). The seasonal rainfall patterns in East Africa are controlled by the seasonal migration of theCopyright 2000 Royal Meteorological SocietyInt. J. Climatol. 20: 19 – 46 (2000)
EAST AFRICAN RAINFALL AND ENSO21ITCZ. The complex topographical patterns, the existence of large lakes, variations in vegetation type andland–ocean contrasts give rise to high spatial and temporal variation in precipitation over the region.Other factors known to influence precipitation over East Africa include tropical storms, easterly waves,jet streams, the continental low-level trough, and extra-tropical weather systems (Ogallo, 1989). The dataused in this study and methodology are presented in section 2. The results are discussed in section 3 andthe conclusions in the section 4.2. DATA AND METHODSThe data used in this study consist of rainfall records for 136 stations scattered over East Africa (Figure1(a)). Figure 1(b) shows the delineated homogeneous rainfall regions over East Africa described in thesub-section 3.1. The initial data consist of monthly rainfall totals for the period 1961–1990. The rainfallmonthly anomalies were computed by subtracting the monthly climatological means based on the1961–1990 climatology from the values, and normalized by dividing each record by the correspondingmonthly standard deviation. The rainfall data were initially subjected to statistical quality control. Usingboth the empirical orthogonal function (EOF) analysis method and simple correlation analysis, the 136rainfall stations were grouped into homogeneous regions. EOF and simple correlation analyses werefurther used to identify stations most representative of each region. These were then averaged to give arainfall index representative of each of the delineated regions. Linkages between the observed rainfallanomalies in East Africa and different phases of ENSO were investigated, and seasonal rainfall patternsassociated with the various ENSO evolution cycles identified. Analysis of the composite map patterns formonthly and seasonal rainfall for both ENSO onset and post-ENSO ( 1) years were based on theFigure 1. (a) Network of rainfall stations used in this study. (b) The eight homogeneous rainfall grouping over East Africa obtainedfrom combined EOF and simple correlation analysesCopyright 2000 Royal Meteorological SocietyInt. J. Climatol. 20: 19 – 46 (2000)
22M. INDEJE ET AL.delineated homogeneous rainfall regions. Composite rainfall map patterns for ENSO onset and postENSO ( 1) years were generated to delineate regions within East Africa that are wet/dry during theseepisodes. The November – December – January Niño3 Central Pacific Ocean sea-surface temperatureanomaly index was employed to identify the years coinciding/following warm ENSO events during theperiod 1961–1990. Based on this analysis, warm ENSO events occurred in 1963, 1965, 1968, 1969, 1972,1976, 1982, 1986, and 1987 (Figure 8). This classification in ENSO years is consistent with those identifiedearlier (Rasmusson and Carpenter, 1983; Wang, 1984; Nicholson, 1996). The years 1964, 1966, 1970,1973, 1977, 1983, and 1988 were stratified into the post-ENSO ( 1) /rainfall composites. The 1982 warmENSO stands out as the strongest event observed during the period of study. Further analyses werecarried out to determine possible shifts in the rainfall seasons in each of the homogeneous rainfallsub-regions of East Africa.2.1. Spatial clustering of the East African rainfall obser6ations networkSeasonal rainfall patterns over East Africa are very complex due to the existence of complextopography and large inland water bodies. Examples of seasonal rainfall variations for selected regionsare shown in Figure 3, for Mubende (central Uganda), Mondo (southwestern Tanzania), Majimazuri(central Kenya) and Mombasa (coastal Kenya). Significant geographical variations have also beenobserved in ENSO signals over East Africa (Ogallo, 1988), which suggest the need to adopt differentempirical models for seasonal climate predictions over different parts of East Africa. Reduction ofregional data and delineation of homogeneous regions is therefore necessary for future development ofempirical rainfall forecasting models for the region. Regionalization and averaging of rainfall over largebut homogeneous regions have the advantages of reducing meteorological noise in the data as well asminimizing the number of variables which describe the regional climate variability. The homogeneousrainfall regions could also be used in the verification of the numerical climate model runs over the EastAfrican region (Sun et al., 1999a,b). The statistical techniques employed in this study will not onlydelineate homogeneous rainfall regions over East Africa but will also identify stations most representativeof each sub-region.EOF analysis and simple correlation were used to delineate homogeneous climate regions in East Africausing annual rainfall data. The method used in this analysis is a modified version of the techniqueemployed by Ogallo (1988) and similar to the one adopted by Dyer (1977). EOF analysis enables fieldsof highly correlated data to be represented adequately by a small number of orthogonal functions andcorresponding orthogonal time coefficients, which account for much of the variance in their spatial andtemporal variability. Kutzbach (1967) provides a lucid outline of the mathematical procedure necessary todefine the functions and their time coefficients. There are a number of examples of applications of EOFanalysis to meteorological fields (Tremberth, 1974; Barnett and Davies, 1975; Weare et al., 1975; Dyer,1977; Richman, 1981; Semazzi et al., 1996). Rotation of EOF has the effect of redistributing the variancewithin the eigenvectors and therefore removing the ambiguities while conserving the variance extracted bythe selected subset of non-rotated eigenvectors. Various methods of determining the number of significantEOF modes to retain for rotation have been discussed (Kraiser, 1959; Anderson, 1963; North et al., 1982;Overland and Preisendorfer, 1982). North et al. (1982) have suggested the use of sampling errors indetermining the number of significant eigenvectors. The sampling error test is based on comparison ofsampling errors for the eigenvalues and the amount of separation from the neighbouring eigenvectors. Ifthe sampling errors in the eigenvalues are comparable to the distance from the nearby eigenvalue, then thesampling errors in the EOF will be comparable to the nearby EOF. In our analysis we adopted the criteriaof Kraiser (1959) and North et al. (1982) in determining the number of dominant EOF modes to beretained and rotated. Delineation of a homogeneous area was accomplished by identifying the stationswith the largest correlation with the principle component (PC) time series associated with the firsteigenvector of the annual rainfall anomaly. Each PC time series obtained from EOF analysis wascorrelated with the stations’ rainfall data and areas that correlated significantly exceeding 0.6 correlationcoefficient (at 5% level), were identified. These stations were retained and used to delineate theCopyright 2000 Royal Meteorological SocietyInt. J. Climatol. 20: 19 – 46 (2000)
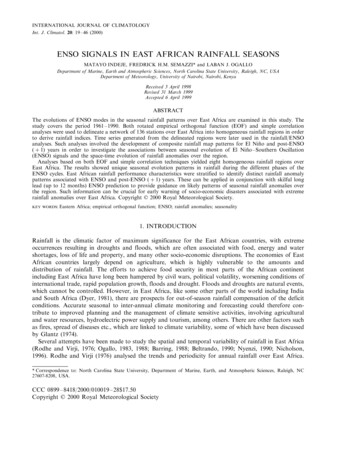
EAST AFRICAN RAINFALL AND ENSO23corresponding region. Stations were then annotated on the map according to the eigenvectors to whichthey were most strongly related. The procedure was repeated for the remaining stations until all therainfall stations were assigned to a region. For stations retained through this process in each subregion EOF analysis was performed again and the important PC time series were correlated with thestations within that region. The stations with correlation coefficients less than 0.6 with the dominantPC were rejected in this iterative process. This procedure was repeated until all the stations in eachsub-region had a correlation of 0.6 or more with the first PC at the last iteration. The remainingstations were then averaged to obtain a regionally representative rainfall time series for use in theENSO/rainfall analysis (section 3.4). This method has proved to be satisfactory with precipitationwhich is a difficult weather parameter to estimate and should therefore be of value when analysinganother parameter like wind (Dyer, 1977).3. RESULTSThe results obtained from this study are discussed in the following sub-sections. In the sub-section 3.1we discuss the mean rainfall patterns over East Africa. In the sub-section 3.2, clustering of EastAfrican rainfall into homogeneous regions and results obtained from the EOF analysis are discussed.In the sub-sections 3.3. and 3.4, we present the results obtained from the composite rainfall mappatterns for ENSO onset and post-ENSO ( 1) years, and the ENSO modulated seasonal shifts in theregional rainfall, respectively.3.1. Mean rainfall patternsFigure 2 shows long-term mean annual rainfall over East Africa based on 1961–1990 climatology.On average more than 800 mm of annual rainfall are observed over areas bordering Lake Victoria tothe west, and the Indian ocean to the east. The highlands of central Kenya and southern Tanzania,much of Uganda and western Tanzania also receive rainfall of more than 800 mm, with the northernand eastern parts of Kenya and east central Tanzania, which are semi-arid, receiving less. East Africaexhibits high seasonal rainfall variability ranging from unimodal, bimodal and trimodal rainfall distributions, as shown in Figure 3 which displays some examples of the annual cycle for rainfall over EastAfrica from four stations in four different homogeneous regions. Four rainfall seasons were chosen forthe further analyses; January – February (JF), the ‘long rains’ of March–May (MAM), June–September(JJAS) and, the ‘short rains’ of October – December (OND). Figure 4 displays the spatial patterns ofthe mean seasonal rainfall over East Africa based on the four chosen rainfall seasons. In the JFseason, the rainfall is concentrated over the lake regions and most parts of Tanzania. This seasonalrainfall is associated with the extreme southward location of the ITCZ and partly with moisture influxfrom the Indian ocean. About 42% of the total regional annual rainfall is observed during MAMrainfall season, with the highest intensity observed near the water bodies of the Indian ocean, LakeVictoria and the East African highlands. During this season only weak correlation has been foundbetween rainfall time series at different stations (Ogallo, 1980, 1983; Beltrando, 1990; Nyenzi 1990)because of the large spatial rainfall variability. The high rainfall variability suggests dominance oflocal factors rather than large-scale factors in the modulation of rainfall patterns during this season.The JJAS rainfall season which accounts for about 15% of the total regional annual rainfall isconfined to the western highlands of Kenya, the coastal areas and most parts of Uganda. The ONDrainfall season contributes about 25% of the total regional annual rainfall and is well distributed inthe whole of East African region. Earlier researchers (Ogallo, 1983; Beltrando, 1990; Nyenzi, 1990;Nicholson, 1996) have found significant station to station correlation and seasonal rainfall to annualrainfall correlations during this season. The dominance of large-scale weather systems may be responsible for the spatial homogeneity of rainfall during this season.Copyright 2000 Royal Meteorological SocietyInt. J. Climatol. 20: 19 – 46 (2000)
24M. INDEJE ET AL.Figure 2. Long-term mean annual climatological rainfall over East Africa (1961 – 1990). Units are mm3.2. Clustering East African rainfall stations into homogeneous regionsBased on the criteria used by North et al. (1982) a maximum of three EOF modes were found to bedistinctly above the noise level for the MAM and OND rainfall seasons. The Monte Carlo significancetest described by Overland and Preisendorfer (1982) suggested that two of the three modes are significantat the 5% level. Hence, the third mode may not be statistically significant. However, using Kraiser (1959)sampling techniques, up to four EOF modes had eigenvalues greater than unity and could hence beretained for rotation. The four EOF rainfall modes identified by Kraiser’s method explain more that 70%of the total variance and are more representative of the regional seasonal rainfall than the first two modesidentified using the North et al. criteria. Up to a maximum of 12 modes were above the noise level forthe annual rainfall and accounted for more than 75% of the total rainfall variance. Figures 5 and 6 displaythe contour patterns of the first and second rotated eigenvectors for the seasonal rainfall anomalies forthe MAM and OND seasons. Figure 7 shows the corresponding rotated EOF modes for annual rainfall.The spatial patterns of the first component of the rotated EOF modes for the MAM and OND rainfallseasons are shown in Figures 5(a) and 6(a). This pattern accounts for 24.6 and 52.7% of the total variancefor the two rainfall seasons respectively. The first EOF mode is in phase throughout the analysis and mostof the eigenvector coefficients are negative for the MAM season (Figure 5(a)) and positive for the ONDseason (Figure 6(a)). The highest values are concentrated over the East African highlands extending to theeast to cover the coastal areas of the Indian Ocean. The principal mode (in phase everywhere) iscomparable to the flow patterns over the region (Ogallo, 1989). The dominant mode is related to themigration of the ITCZ, which is mainly responsible for seasonal rainfall in the region. The low varianceexplained by the first EOF mode for the MAM rainfall as compared to that of OND rainfall season,suggests that factors other than global teleconnections play an important role in modulating the ITCZ.The first EOF mode of the OND rainfall season display an east/west dipole pattern with more weightCopyright 2000 Royal Meteorological SocietyInt. J. Climatol. 20: 19 – 46 (2000)
25EAST AFRICAN RAINFALL AND ENSOcentred over the East African highlands extending south to cover parts of Tanzania and the East Africancoast. The spatial pattern of the first EOF rainfall mode is well distributed over the domain and since thismode explains more that 50% of the rainfall variance, confirms the fact that rainfall during this seasonis spatially well correlated over East Africa. The east/west orientation of the first EOF mode during thisrainfall season also suggests that the short rains are more influenced by the east/west oscillatingmeridional component of the ITCZ. Similarly, the long rains (MAM) are more influenced by thenorth/south movement of the zonal arm of the ITCZ in the region and other weather systems such as themeso-scale systems, interactions between extra-tropical and tropical weather systems among others(Ogallo, 1989; Beltrando, 1990).The spatial patterns of the second EOF rainfall components are given in Figures 5(b) and 6(b). Theyare associated with the intra-seasonal rainfall variability. These patterns account for 10.8 and 6.1% of therainfall variance for the MAM and OND rainfall seasons, respectively. The MAM coefficients over theeastern parts of the East African highlands and western parts of the Lake Victoria regions, and those ofthe western parts of the East African highlands, are of opposite signs (Figure 5(b)). This componentrepresents a compensatory system. In those years where the intra-seasonal rainfall exhibits large positiveanomalies over the western highlands, below normal rainfall anomalies are observed over the easternhighlands and the western parts of the Lake Victoria basin. The converse is also true since the referencefor signs of the coefficients are arbitrary. These conditions may be linked to the intra-seasonal variabilityof rainfall over the region which is controlled by the interactions between the large-scale easterly flow andthe coupling between the Lake Victoria land/lake breeze and the eastern Africa highlands-inducedupslope/downslope diurnal mesoscale circulation systems. Both observational studies (Alusa, 1976;Asnani and Kinuthia, 1979) and numerical studies (Okeyo, 1986; Mukabana and Pielke, 1996; Indeje andAnyamba, 1998) have associated the observed afternoon hail and thunderstorm activities over the westernparts of the Kenya highlands to the interactions between the prevailing easterly flow and the diurnalmeso-scale circulations in the region. The eastern parts of the Kenya highlands and the western parts ofthe Lake Victoria basin are observed to receive most of the rainfall during the morning hours. Theinfluence of a westerly moist unstable airmass is also responsible for the intense convection over theKenya highlands (Vincent et al., 1979).Figure 3. Examples of mean seasonal patterns of rainfall for some selected stations over East AfricaCopyright 2000 Royal Meteorological SocietyInt. J. Climatol. 20: 19 – 46 (2000)
26M. INDEJE ET AL.Figure 4. The spatial patterns of the mean seasonal rainfall East Africa. Units are mmCopyright 2000 Royal Meteorological SocietyInt. J. Climatol. 20: 19 – 46 (2000)
EAST AFRICAN RAINFALL AND ENSO27Figure 5. The spatial patterns of the rotated EOF modes for the March – May seasonal rainfall anomalies: (a) first EOF mode and(b) second EOF mode (loading 100). Values less than 10 are shadedCopyright 2000 Royal Meteorological SocietyInt. J. Climatol. 20: 19 – 46 (2000)
28M. INDEJE ET AL.Figure 6. Same as in Figure 5, but for October – December rainfall seasonCopyright 2000 Royal Meteorological SocietyInt. J. Climatol. 20: 19 – 46 (2000)
EAST AFRICAN RAINFALL AND ENSO29Figure 7. The contour patterns of the rotated eigenvectors for annual rainfall anomalies: (a) first EOF mode and (b) second EOFmode (loading 100). Values less than 5 are shadedCopyright 2000 Royal Meteorological SocietyInt. J. Climatol. 20: 19 – 46 (2000)
30M. INDEJE ET AL.During the OND rainfall season, the second rainfall EOF mode displays a north/south dipole pattern.This pattern shows that whenever negative rainfall anomalies occur over the southern parts of EastAfrica, positive rainfall anomalies are experienced over the northern parts the region and vice versa. Thisconfiguration may be linked to an ENSO/rainfall dipole pattern (Semazzi and Indeje, 1999) which ishighly significant during the OND rainfall season.The spatial patterns of the first rotated EOF mode for annual rainfall (Figure 7(a)) indicate someconcentration of high positive scores over the coastal hinterland of Kenya. The second mode (Figure7(b)), shows a shift in the high positive scores from the coastal region to the central areas of Kenya. Thesepatterns indicate some likelihood of homogeneous rainfall regions over the coastal areas of East Africaand central Kenya. The principle component score time series provide insight concerning the strength ofthe EOF patterns over time. Strong amplitudes greater than one standard deviation are observed mainlyin the first mode during OND and MAM rainfall seasons (Figures not shown). An extreme score ofgreater than five standard deviations was observed during the OND season of 1961. This rainfall anomalyevent, as indicated by earlier researchers, was associated with the anomalous flow patterns emanatingfrom an unusually warm pool of air over the Indian Ocean (Anyamba, 1984; Reverdin et al., 1986). Highpositive scores in the first EOF mode were also observed during the years 1963, 1967, 1972, 1977, 1978,1982 and 1989 during the OND rainfall season. Similarly, during the MAM season, the years 1963, 1967,1968, 1970, 1977, 1978, 1981, 1985, 1986, 1988 and 1990 displayed low negative scores of less than minusone of the standard deviation, while the years 1961, 1965, 1969, 1971–1973, 1976, 1983–1984 and 1986displayed high positive scores.In this study we use annual rainfall anomalies obtained from the mean monthly anomalies in the clusteranalysis. Thus, we eliminate the seasonal dependence of the obtained homogeneous rainfall regions overEast Africa. It should be noted that Lake Victoria, and southern and western Tanzania, would have morecomplex spatial rainfall modes during the main rainfall season of March–May (see Figure 5(a)) due to theinfluence of the complex regional physical features. A further objective was to compare evolutions ofENSO in space and time over homogeneous rainfall regions over East Africa. Hence, the clustered rainfallregions were retained throughout the remaining analyses to enable equal weights to be given to arealrainfall over the different sub-regions of East Africa. The derived EOF rainfall patterns from the annualrainfall anomaly fields (Figure 7) do not give a complete picture of the homogeneous rainfall stations inthe region. After correlating the principal components time series and station rainfall time series, eighthomogeneous regions were delineated over East Africa: (I) coastal areas of Kenya and Tanzania; (II)eastern highlands of Kenya and Tanzania; (III) central Rift Valley of Kenya; (IV) western highlands ofKenya, northwestern Kenya and northeastern Uganda; (V)
analyses were used to delineate a network of 136 stations over East Africa into homogeneous rainfall regions in order to derive rainfall indices. Time series generated from the delineated regions were later used in the rainfall:ENSO analyses. Such analyses involved the development of composite rainfall map patterns for El Nin o and post-ENSO