Transcription
Tracing: Fast & SlowDigging into and improving your webservice’s performanceOffline viewers: full write up @ rogue.ly/tracingLynn Root SRE @roguelynn
whoami
—
agenda—
agenda— Overview and problem space
agenda— Overview and problem spaceApproaches to tracing
agenda— Overview and problem spaceApproaches to tracingTracing at scale
agenda— Overview and problem spaceApproaches to tracingTracing at scaleDiagnosing performance issues
agenda— Overview and problem spaceApproaches to tracingTracing at scaleDiagnosing performance issuesTracing services & systems
Tracing Overview—
machine-centric— Focus on a single machine
machine-centric— Focus on a single machineNo view into a service’s dependencies
workflow-centric— Understand causal relationships
workflow-centric— Understand causal relationshipsEnd-to-end tracing
why trace?—
why trace?— Performance analysis
why trace?— Performance analysisAnomaly detection
why trace?— Performance analysisAnomaly detectionProfiling
why trace?— Performance analysisAnomaly detectionProfilingResource attribution
why trace?— Performance analysisAnomaly detectionProfilingResource attributionWorkload modeling
Tracing Approaches—
manual
def request id(f):@wraps(f)def decorated(*args, **kwargs):req id request.headers.get("X-Request-Id", uuid.uuid4())return f(req id, *args, **kwargs)return decorated@app.route("/")@request iddef list services(req id):# log w/ ID for wherever you want to trace# app logic
upstream appserver {10.0.0.0:80;}server {listen 80;# Return to clientadd header X-Request-ID request id;location / {proxy pass http://appserver;# Pass to app serverproxy set header X-Request-ID request id;}}
log format trace ' remote addr request id';server {listen 80;add header X-Request-ID request id;location / {proxy pass http://app server;proxy set header X-Request-ID request id;# Log request idaccess log /var/log/nginx/access trace.log trace;}}
blackbox
metadata propagation
Tracing at Scale—
four things to think about—
four things to think about— What relationships to track
four things to think about— What relationships to trackHow to track them
four things to think about— What relationships to trackHow to track themWhich sampling approach to take
four things to think about— What relationships to trackHow to track themWhich sampling approach to takeHow to visualize
what to track
Request OneRequest TwoSubmitter Flow PoV
Request OneRequest TwoTrigger Flow PoV
how to track
request ID
request ID logical clock
request ID logical clock previous trace points
tradeoffs—
tradeoffs— Payload size
tradeoffs— Payload sizeExplicit relationships
tradeoffs— Payload sizeExplicit relationshipsCollate despite lost data
tradeoffs— Payload sizeExplicit relationshipsCollate despite lost dataImmediate availability
how to sample
sampling approaches— Head-based
sampling approaches— Head-basedTail-based
sampling approaches— Head-basedTail-basedUnitary
what to visualize
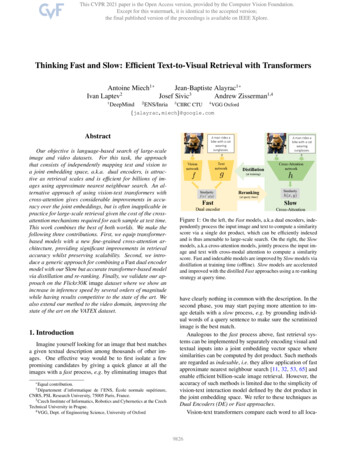
gantt chart—Trace ID: de4db33fGET /homeGET /feedGET /profileGET /messagesGET /friends
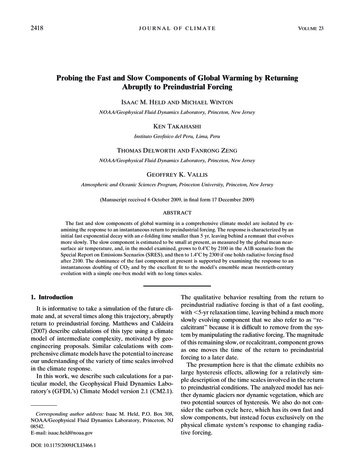
request flow graph—2200µsB call500µs400µsA call500µsD call500µsC callD reply400µsC reply800µsE call1500µs600µs700µs600µsC call300µsB replyE replyA reply500µs100µsC reply
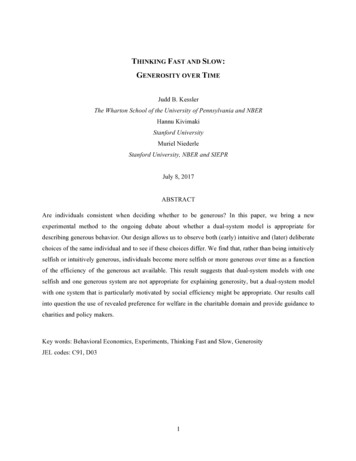
context calling tree—CBADCE
keep in mind— What do I want to know?
keep in mind— What do I want to know?How much can I instrument?
keep in mind— What do I want to know?How much can I instrument?How much do I want to know?
suggested for performance—
suggested for performance— Trigger PoV
suggested for performance— Trigger PoVHead-based sampling
suggested for performance— Trigger PoVHead-based samplingFlow graphs
Diagnosing—
questions to ask— Batch requests?
questions to ask— Batch requests?Any parallelization opportunities?
questions to ask— Batch requests?Any parallelization opportunities?Useful to add/fix caching?
questions to ask— Batch requests?Any parallelization opportunities?Useful to add/fix caching?Frontend resource loading?
questions to ask— Batch requests?Any parallelization opportunities?Useful to add/fix caching?Frontend resource loading?Chunked or JIT responses?
Frameworks,Systems & Services—
Frameworks
OpenTracing
OpenCensus
self-hosted
Zipkin (Twitter)—
Zipkin (Twitter)— Out-of-band reporting to remote collector
Zipkin (Twitter)— Out-of-band reporting to remote collectorReport via HTTP, Kafka, and Scribe
Zipkin (Twitter)— Out-of-band reporting to remote collectorReport via HTTP, Kafka, and ScribeVarying propagation support across differentlanguages
Zipkin (Twitter)— Out-of-band reporting to remote collectorReport via HTTP, Kafka, and ScribeVarying propagation support across differentlanguagesLimited web UI
def http transport(span v1/spans",data span data,headers {"Content-type": "application/x-thrift"})@app.route("/")def index():with zipkin span(service name "myawesomeapp",span name "index",# need to write own transport functransport handler http transport,port app port,# 0-100 percentsample rate 100):# do something
Jaeger (Uber)—
Jaeger (Uber)— Local daemon to collect & report
Jaeger (Uber)— Local daemon to collect & reportStorage support for only Cassandra
Jaeger (Uber)— Local daemon to collect & reportStorage support for only CassandraLimited Web UI
Jaeger (Uber)— Local daemon to collect & reportStorage support for only CassandraLimited Web UIVarying language support in client libraries
config Config( )tracer config.initialize tracer()@app.route("/")def index():with tracer.start span("ASpan") as span:span.log kv({"event": "the answer to", "life": 42})with tracer.start span("ChildSpan", child of span) as cspan:cspan.log kv({"event": "don't forget", "towel": True})
honorable mentions— AppDash
services
Stackdriver Trace (Google)—
Stackdriver Trace (Google)— OpenCensus with gRPC support
Stackdriver Trace (Google)— OpenCensus with gRPC supportForward traces from Zipkin
Stackdriver Trace (Google)— OpenCensus with gRPC supportForward traces from ZipkinStorage limitation of 30 days
Stackdriver Trace (Google)— OpenCensus with gRPC supportForward traces from ZipkinStorage limitation of 30 daysRecreate graphs per time period
X-Ray (AWS)—
X-Ray (AWS)— Supports OpenCensus, not OpenTracing
X-Ray (AWS)— Supports OpenCensus, not OpenTracingGrowing SDK support across languages
X-Ray (AWS)— Supports OpenCensus, not OpenTracingGrowing SDK support across languagesLots of flexibility with configuring sampling
X-Ray (AWS)— Supports OpenCensus, not OpenTracingGrowing SDK support across languagesLots of flexibility with configuring samplingSend metrics from outside AWS environment
X-Ray (AWS)— Supports OpenCensus, not OpenTracingGrowing SDK support across languagesLots of flexibility with configuring samplingSend metrics from outside AWS environmentFlow graphs with latency, response %, sample %
honorable mentions— LightStepSignalFXNew RelicDatadogAzure Monitor
TL;DR—
tl;dr— You need this
tl;dr— You need this – but it’s hard
tl;dr— You need this – but it’s hardSupport is improving
tl;dr— You need this – but it’s hardSupport is improvingOne size fits all approaches
tl;dr— You need this – but it’s hardSupport is improvingOne size fits all approachesIt’s in the open
Thanks!—Write up: rogue.ly/tracingVisit our booth – we’re hiring!Lynn Root SRE @roguelynn
Tracing: Fast & Slow Digging into and improving your web service’s performance O!ine viewers: full write up @ rogue.l