Transcription
Pavement Management SystemsPMSPAVEMENT MANAGEMENT SYSTEMSOVERVIEWDr. Nick Vitillo
PMS CONCEPTSDISCUSSION TOPICS DEFINITION OF PM AND PMS PMS SUBSYSTEMS NETWORK & PROJECT LEVEL PMS PAVEMENT EVALUATION PERFORMANCE AND ECONOMIC ANALYSES DATA BASES/DATA MANAGEMENT
Pavement EngineeringPavement MaterialsClassification, quality assurance testing(specifications), material designPavement DesignDesign of Structural layers for New Pavements andPavement RehabilitationAssess in-situ pavement material properties and layerthicknessPavementConstructionConstruction practices of New Pavements andPavement Rehabilitation including specificationdevelopment and quality assurancePavementManagementMonitoring Post-construction condition, timingpreventive maintenance and rehabilitationtreatments, and economic analysis ofalternativesPavement ResearchResearch to improve all of the above
PAVEMENT MANAGEMENT SYSTEMOverview
DEFINITIONSPAVEMENT MANAGEMENT"Pavement Management is a program for improvingthe quality and performance of pavements andminimizing costs through good managementpractices"
DEFINITIONSPAVEMENT MANAGEMENT SYSTEMS"A Pavement Management System is a set of definedprocedures for collecting, analyzing, maintaining, andreporting pavement data, to assist the decisionmakers in finding optimum strategies for maintainingpavements in serviceable condition over a givenperiod of time for the least cost."
PAVEMENT MANAGEMENT SYSTEMOverviewA Pavement Management System (PMS) is designed toprovide objective information and useful data foranalysis so that road managers can make moreconsistent, cost-effective, and defensible decisionsrelated to the preservation of a pavement network.While a PMS cannot make final decisions, it can providethe basis for an informed understanding of the possibleconsequences of alternative decisions.A PMS does NOT make decisions, Managers DO!
PMS LEVELSNETWORKBIRD’S EYE VIEW OF NETWORK PAVEMENTS AS A WHOLE. STATEWIDE PAVEMENT CONDITION SUMMARY BUDGET ESTIMATE PERFORMANCE PREDICTIONPROJECTASSIST DESIGNERS IN CONSTRUCTING, MAINTAINING, ORREHABILITATING A SECTION OF ROADWAY. PREVENTIVE MAINTENANCE RESURFACING OR RECONSTRUCTION TREATMENTS OPTIONS ALONG THE PROJECT
PMS SUBSYSTEMS-PMS DATA Inventory Condition - Pavement Evaluation History – Initial, PM, RM, Rehab, Reconstruction Traffic Costs-MODELING - ANALYSIS Serviceability Rating Performance Predictions Economic Analyses-Budgeting / Programming-DATA MANAGEMENT Relational Databases Report Generation
REFERENCE SYSTEMSMILE POSTSMP3.0MP7.0MP 5.0MP 1.0START MP 0.00.0MilePosts02.5124.5345.7557.2567
REFERENCE SYSTEMSMILE POSTSSouth & WestSecondary DirectionMP3.0MP7.0MP 5.0MP 1.0START MP 0.0Primary DirectionNorth & EastLength of Route in Primary Direction may be different than that in theSecondary Direction.
DATA COLLECTION
PMS DATA COLLECTIONDATA TYPES INVENTORY, PAVEMENT CONDITION TRAFFIC/LOADS, COSTS - Construction, PM, RM, Rehab, Reconstruction HISTORY – Initial Const, PM, RM, Rehab, Reconstruction(Last Treatment)
Example Inventory Data Route NumberRoute Type (Interstate, US, NJ)Functional ClassLengthDivided/Undivided Route SectionPavement TypeNumber of Lanes and WidthsShoulder Type and WidthCountyLegislative District
PMS DATA COLLECTIONPAVEMENT CONDITION EVALUATION PAVEMENT ROUGHNESS or RIDE QUALITY SURFACE DISTRESS RUTTING SKID RESISTANCE STRUCTURAL CAPACITY
Need for Annual Condition SurveysRide Quality, Surface Distress, Rutting, Friction Evaluating current condition ofpavement Determining rates of deterioration Project future conditions to determecurrent and future maintenance &rehabilitation needs Determining future cost of repairs
Pavement Condition Survey EquipmentProfilerSkid Trailerroughness, distress,rutting, noise,pavement ent DemoStructuralCapacityLast Day
PAVEMENT CONDITION EVALUATIONROAD ROUGHNESS"ROAD ROUGHNESS IS THE IRREGULARITIES INTHE PAVEMENT SURFACE AFFECTING USERCOMFORT AND SAFETY”DUE TO VARIATIONS IN HORIZONTAL,VERITICAL, AND TRANSVERSE PROFILESRIDE QUALITY - USER PERCEPTION OFPAVEMENT ROUGHNESS
PAVEMENT CONDITION EVALUATIONSURFACE DISTRESSDESCRIPTIONTYPE OF DISTRESS (Cracking, Patching, Rutting)SEVERITY (Crack Width, Condition Assessment)EXTENT (Percentage of the Pavement Length)DATA COLLECTIONCONTINUOUS - WINDSHIELD SURVEY(COMPUTER RATER KEYBOARD, and VIDEO)
PAVEMENT CONDITION EVALUATIONSURFACE DISTRESS1.75 ft2.5 ft3.5 ft2.5 ft1.75 ftWheel pathWheel path12 ftLOAD ASSOCIATED vs. Non-LOAD ASSOCIATED LOCATIONNetwork Level PMS “Slow” lane in each direction – 4600directional miles
PAVEMENT CONDITION EVALUATIONSURFACE DISTRESSBITUMINOUS/COMPOSITE VERSE*LDICRACKINGMULTIPLESURFACE DEFORMATIONRUTTINGMISCELLANEOUSSHOULDER CONDITIONPATCH CONDITIONObservation of condition in the other lanes
RUT DEPTH MEASUREMENT3-5 Point MeasurementD2DWPL1WPRD3RD DDRut Depth 232 D1
PAVEMENT CONDITION EVALUATIONSURFACE DISTRESSCONCRETE PAVEMENTS**CRACKING*****JOINT DEFECTSJOINT SEAL DAMAGEJOINT CONDITIONMISCELLANEOUSPATCH CONDITION
PAVEMENT CONDITION EVALUATIONSKID RESISTANCESAFETYDESCRIPTIONASSESSMENT OF THE COEFFICIENT OF FRICTIONOF THE PAVEMENT SURFACE (BASED ON SPEED)DATA COLLECTIONCONTINUOUS - ASTM E274 (LOCK WHEEL) SKIDTRAILER
PAVEMENT CONDITION EVALUATIONSTRUCTURAL LOAD CAPACITYProject Level PMSDESCRIPTIONASSESSMENT OF THE LOAD CARRYING CAPACITY OFTHE PAVEMENT STRUCTUREDATA COLLECTIONDESTRUCTIVE - CORING/BORINGS/LAB TESTSNON-DESTRUCTIVE TEST – FALLING WEIGHT DEFLECTOMETER (FWD) CONCRETE JOINT LOAD TRANSFER EFFICIENCY GROUND PENETRATING RADAR
QUESTIONS ?
PMSPerformanceAnalyses
Condition SurveysRide Quality, Surface Distress, RuttingPavement IndicesPavement Wheel PathRide Quality IndexProfileIRIPavement SurfaceDistressesSurface Distress IndexRuttingAverage Pavement RutDepthStructural CapacityDeflectionsStructural CapacityIndexConverts collected data to single value
Need for Condition SurveysRide Quality Index Measure Pavement Wheel Path Profile(s) toassess Pavement Ride Quality Convert Pavement Wheel Path Profile (L&R) toPavement Ride Quality Indices (IRI)0.1 mileIRI
Pavement Distress Survey Type of distress (Cracking, Patching, etc) Severity (width of cracks, condition of thepatch, etc.) Extent - Quantity of distress present on thepavement (percentage of length)
Distress Identification Manualfor the Long-Term Pavement Performance 03031/index.htmNJDOT Version
Pavement Models
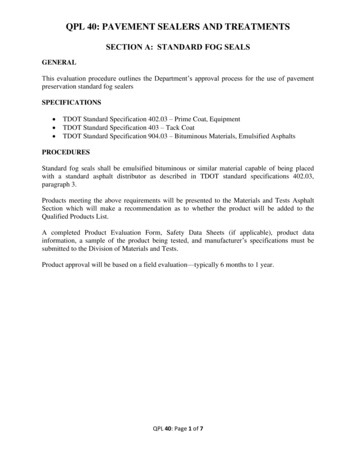
Pavement Performance ExamplePrediction ModelCurrent TimeD is t re s s In d e x54Measured3Site SpecificDistress Model2102000Default DistressIndex ModelTriggerPredicted20052010Years20152020
PMSEconomicsAnalysesReporting
ANALYSESECONOMIC ANALYSESMulti-Year Prioritization (MYP)A method of allocating limited resources in anefficient and cost-effective way over a multi-yearperiod (2-10 year’s needs), through an evaluation oflong-term impacts.A PMS process or tool used to objectivelyidentify the best combination of projects over amulti-year program.
ANALYSESECONOMIC ANALYSESMulti-Year Prioritization (MYP)Prioritization techniques use mathematical modeling toolsto achieve the best combination of projects over thespecified analysis period: Pavement performance Models predict futurecondition and suggest timing of needed rehab Projects are identified with need for PM, Minor Rehab,Major Rehab or Reconstruction The most effective timing for the applying theappropriate treatment are identified
ANALYSESECONOMIC ANALYSESBenefits Provided By MYP Forecast future conditionsAnalyze timing optionsEvaluate effectiveness of alternative strategyPerform economic analysesUse of objective measures for prioritizing needsProject future budgetsPredict the impact of each combination ofprojects on the network over the given analysisperiod
Effect of Treatment Timing on Costs
You never have enough fish!
Homogeneous Analysis Sections Change in pavement typeChange in pavement structureChange in traffic VolumePolitical boundaries Change in pavement condition (Dynamic) Construction Project limitsDecide the overall condition, timing, costs,and treatment type
Pavement Condition IndexTreatment Options in MYPPerformance Prediction ModelBenefit or EffectivenessTreatment(Area under the curve)PredictedPerformanceConditionIncreaseTrigger LimitLifeExtensionMarginal Cost EffectivenessIncremental Benefit/Cost RatioAge or Traffic Loads
Pavement Condition IndexTreatment Options in MYPExisting PerformanceTrigger Point forTreatment 1Treatment 1 in Years Xand Z at CostTreatment 2 in Year Yat S CostTrigger Point forTreatment 2Age or Traffic Loads
ANALYSESECONOMIC ANALYSESDecision Benefits Provided By MYPProvide answers for the questions:1. What condition will be reached for a givenlevel of funding?2. What budget is needed to reach ormaintained a given level of condition?
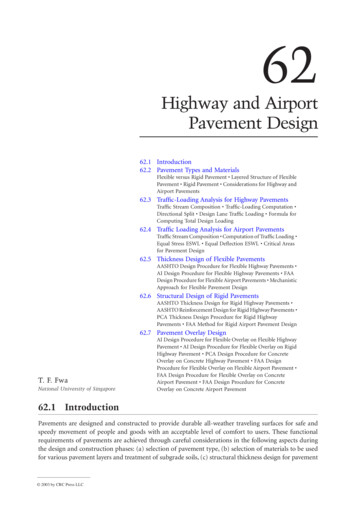
Example Network PerformanceIllustrates Policy DecisionsWhat are the average projected IRI for the given BudgetLevels?IRI % above trigger50% a b o v e trig g e r45Budget Scenarios403530252015 225 300105 275 375 290 01620172018
Example Network PerformanceIllustrates Policy DecisionsWhat will it cost to maintain the current IRI? 300,000,000B udget 250,000,000 200,000,000 150,000,000 100,000,000Budget Scenarios 50,000,000 020082009201020112012201320142015201620172018
Pavement Strategy DevelopmentPavement StrategyPlan of actionComprised of the application of one or moremaintenance or rehabilitation techniquesDesigned to improve or maintain the condition ofa pavement segment above some predeterminedminimum requirement
Requirements for Developing aStrategy List of strategy guidelines and treatment options Treatment Costs Pavement performance models for treatmentOptions in Strategy Development Project Selection/Treatment Selection simultaneous or not Single treatments or multiple treatments
Single Treatment Strategy Most common approach Several feasible alternatives may be identified foreach section Each treatment considered independently Most cost-effective treatment generally selectedMultiple Treatment Strategy Combination of treatments considered for eachsection Effectiveness of all treatments is representativeof effectiveness of entire strategy Subsequent treatments affect selection ofstrategy Repeated treatments
Treatment SelectionDecision TreesPavementCondition IndexPreventive Maintenance 4AsphaltPavementCondition 4 or ural DeteriorationNot PresentFunctionalOverlay
PMS DATABASESCOMPUTERIZED DATABASEMANAGEMENT SYSTEMS (DBMS)INTEGRATED RELATIONAL DATABASES
PMS COORDINATED DATABASESCOMPUTERIZED DATABASE MANAGEMENT SYSTEMS (DBMS)INTEGRATED RELATIONAL DATABASES INVENTORY - RT NUMBER, FUNCTIONAL CLASS, PAVEMENT TYPE, etc. CONDITION - RIDE QUALITY, DISTRESS, FRICTION, DEFLECTION COSTS HISTORY TRAFFIC / LOADS
PAVEMENT HISTORYInitial Construction DataDate, Cost, Material, Structure, etc.Preventive MaintenanceDate, Treatment, Cost, Material, Structure, etc.RehabilitationDate, Treatment, Cost, Material, Structure, etc.ReconstructionDate, Treatment, Cost, Material, Structure, etc.
COSTSAGENCY COSTS P&E DESIGN CONSTRUCTION PREVENTIVE AND ROUTINE MAINTENANCE REHABILITATION / RESURFACING / RECONSTRUCTION SALVAGE
PMS DATABASESDATABASE PRODUCTS/REPORTSDEFICIENCY REPORTS –SECTIONS WITH UNACCEPTABLE RQ OR DISTRESSPERFORMANCE HISTORIESDISPLAY GIVEN CONDITION PARAMETER OVER TIME ORLOADSCONSTRUCTION, MAINTENANCE, REHAB HISTORIESLIST OF BUDGET NEEDS - STATE, MPO, COUNTY, TOLLAUTHORITIES
PMS DATABASESDATABASE PRODUCTS/REPORTS[TABULAR, BUSINESS GRAPHICS, GIS MAP, Video]90Section32Year2006Cost 100,000807060EastWestNorth5040472008 237,99930201001st Qtr2nd Qtr3rd Qtr4th Qtr
Data StorageTerabyteMountain1 Terabyte 1,024 Gigabytes
QUESTIONS ?
THANK YOU
A Pavement Management System (PMS) is designed to provide objective information and useful data for analysis so that road managers can make more consistent, cost-effective, and defensible decisions related to the preservation of a pavement network. PAVEMENT MANAGEMENT SYSTEM Overview While a PMS cannot make final decisions, it can provide