Transcription
Flash Reliability in Production:The Expected and the UnexpectedBianca Schroeder, University of Toronto; Raghav Lagisetty and Arif Merchant, Google ical-sessions/presentation/schroederThis paper is included in the Proceedings of the14th USENIX Conference onFile and Storage Technologies (FAST ’16).February 22–25, 2016 Santa Clara, CA, USAISBN 978-1-931971-28-7Open access to the Proceedings of the14th USENIX Conference onFile and Storage Technologiesis sponsored by USENIX
Flash Reliability in Production: The Expected and the UnexpectedBianca SchroederUniversity of TorontoToronto, CanadaRaghav LagisettyGoogle Inc.Mountain View, CAAbstractAs solid state drives based on flash technology are becoming a staple for persistent data storage in data centers,it is important to understand their reliability characteristics. While there is a large body of work based on experiments with individual flash chips in a controlled labenvironment under synthetic workloads, there is a dearthof information on their behavior in the field. This paperprovides a large-scale field study covering many millionsof drive days, ten different drive models, different flashtechnologies (MLC, eMLC, SLC) over 6 years of production use in Google’s data centers. We study a widerange of reliability characteristics and come to a numberof unexpected conclusions. For example, raw bit errorrates (RBER) grow at a much slower rate with wear-outthan the exponential rate commonly assumed and, moreimportantly, they are not predictive of uncorrectable errors or other error modes. The widely used metric UBER(uncorrectable bit error rate) is not a meaningful metric,since we see no correlation between the number of readsand the number of uncorrectable errors. We see no evidence that higher-end SLC drives are more reliable thanMLC drives within typical drive lifetimes. Comparingwith traditional hard disk drives, flash drives have a significantly lower replacement rate in the field, however,they have a higher rate of uncorrectable errors.1IntroductionThe use of solid state drives based on NAND flashtechnology in data center servers is continuously growing. As more data lives on flash, data durability andavailability critically depend on flash reliability. Whileit is widely understood that flash drives offer substantial performance improvements relative to hard diskdrives, their failure characteristics are not well understood. The datasheets that manufacturers provide onlycontain vague guarantees, such as the number of times aflash chip can be erased before wearing out. Our currentunderstanding is based on work that studies flash relia-USENIX AssociationArif MerchantGoogle Inc.Mountain View, CAbility in controlled lab experiments (such as acceleratedlife tests), using a small population of raw flash chips under synthetic workloads. There is a dearth of studies thatreport on the reliability of flash drives and their failurecharacteristics in large-scale production use in the field.This paper provides a detailed field study of flash reliability based on data collected over 6 years of productionuse in Google’s data centers. The data spans many millions of drive days 1 , ten different drive models, differentflash technologies (MLC, eMLC and SLC) and featuresizes (ranging from 24nm to 50nm). We use this datato provide a better understanding of flash reliability inproduction. In particular, our contributions include a detailed analysis of the following aspects of flash reliabilityin the field:1. The different types of errors experienced by flashdrives and their frequency in the field (Section 3).2. Raw bit error rates (RBER), how they are affectedby factors such as wear-out, age and workload, andtheir relationship with other types of errors (Section 4).3. Uncorrectable errors, their frequency and how theyare affected by various factors (Section 5).4. The field characteristics of different types of hardware failure, including block failures, chip failures and the rates of repair and replacement ofdrives (Section 6).5. A comparison of the reliability of different flashtechnologies (MLC, eMLC, SLC drives) in Sections 7, and between flash drives and hard diskdrives in Section 8.As we will see, our analysis uncovers a number of aspects of flash reliability in the field that are different fromcommon assumptions and reports in prior work, and willhopefully motivate further work in this area.1 The size of their fleet and the number of devices in it is consideredconfidential at Google, so we can not provide precise numbers. Weare making sure throughout this work that the reported numbers arestatistically significant.14th USENIX Conference on File and Storage Technologies (FAST ’16) 67
Model nameGenerationVendorFlash typeLithography (nm)CapacityPE cycle limitAvg. PE IVeMLC322TB10,000377Table 1: Overview of drive models22.1Background on data and systemsRead error: A read operation experiences a (non-ECC)error, but after retrying it succeeds.Write error: A write operation experiences an error, butafter retrying the operation succeeds.Erase error: An erase operation on a block fails.The flash drivesThe drives in our study are custom designed high performance solid state drives, which are based on commodityflash chips, but use a custom PCIe interface, firmwareand driver. We focus on two generations of drives, whereall drives of the same generation use the same devicedriver and firmware. That means that they also use thesame error correcting codes (ECC) to detect and correct corrupted bits and the same algorithms for wearlevelling. The main difference between different drivemodels of the same generation is the type of flash chipsthey comprise.Our study focuses on the 10 drive models, whose keyfeatures are summarized in Table 1. Those models werechosen as they each span millions of drive days, comprisechips from four different flash vendors, and cover thethree most common types of flash (MLC, SLC, eMLC).2.2The devices report the following types of nontransparent errors:Uncorrectable error: A read operation encounters morecorrupted bits than the ECC can correct.Final read error: A read operation experiences an error,and even after retries the error persists.Final write error: A write operation experiences an errorthat persists even after retries.Meta error: An error accessing drive-internal metadata.Timeout error: An operation timed out after 3 seconds.Uncorrectable errors include errors that were detectedeither during user-initiated operations or internal operations due to garbage collection, while final read errorsinclude only errors encountered during user operations.Note that errors vary in the severity of their possibleimpact. Besides the distinction between transparent andnon-transparent errors, the severity of non-transparent errors varies. In particular, some of these errors (final readerror, uncorrectable error, meta error) lead to data loss,unless there is redundancy at higher levels in the system,as the drive is not able to deliver data that it had previously stored.We consider only drives that were put into productionat least 4 years ago (for eMLC drives 3 years ago, as theyare more recent drives), and include any errors that theyexperienced during their first 4 years in the field. Table 2reports for each error type the fraction of drives for eachmodel that experienced at least one error of that type (tophalf of table) and the fraction of drives days that had anerror of that type (bottom half of table).The dataThe data was collected over a 6-year period and containsfor each drive aggregated monitoring data for each daythe drive was in the field. Besides daily counts for a variety of different types of errors, the data also includesdaily workload statistics, including the number of read,write, and erase operations, and the number of bad blocksdeveloped during that day. The number of read, write,and erase operations includes user-issued operations, aswell as internal operations due to garbage collection. Another log records when a chip was declared failed andwhen a drive was being swapped to be repaired.3Prevalence of different error typesWe begin with some baseline statistics on the frequencyof different types of errors in the field. We distinguishtransparent errors, which the drive can mask from theuser, and non-transparent errors, which will lead to afailed user operation. The device driver of the flashdrives reports the following transparent types of errors:3.1Non-transparent errorsWe find that the most common non-transparent errorsare final read errors, i.e. read errors that cannot be resolved even after retrying the operation. Depending onthe model, between 20-63% of drives experience at leastone such error and between 2-6 out of 1,000 drive daysare affected. We find that the count of final read errorsCorrectable error: During a read operation an error isdetected and corrected by the drive internal ECC (errorcorrecting code).268 14th USENIX Conference on File and Storage Technologies (FAST ’16)USENIX Association
Model nameMLC-Afinal read erroruncorrectable errorfinal write errormeta errortimeout errorresponse errorcorrectable errorread errorwrite errorerase -049.89e-018.64e-036.37e-021.30e-01final read erroruncorrectable errorfinal write errormeta errortimeout errorresponse errorcorrectable errorread errorwrite errorerase SLC-ASLC-BSLC-CFraction of drives affected by different types of errors5.64e-013.25e-013.17e-015.08e-012.66e-01 1.91e-015.75e-013.24e-013.24e-015.03e-012.84e-01 2.03e-012.11e-021.28e-021.85e-022.39e-022.33e-02 9.69e-037.97e-039.89e-031.93e-021.33e-023.68e-02 2.06e-029.17e-035.70e-038.21e-031.64e-021.15e-02 8.47e-033.90e-031.29e-031.88e-034.97e-032.08e-03 0.00e 009.98e-019.96e-019.91e-019.99e-019.61e-01 9.72e-011.46e-029.67e-031.12e-021.29e-021.77e-02 6.05e-035.61e-016.11e-026.40e-021.30e-011.11e-01 4.21e-013.91e-019.70e-021.26e-016.27e-023.91e-01 6.84e-01Fraction of drive days affected by different types of errors1.54e-031.78e-031.39e-031.06e-039.90e-04 7.99e-041.99e-032.51e-032.28e-031.35e-032.06e-03 2.96e-032.13e-051.70e-053.23e-052.63e-054.21e-05 1.21e-051.18e-051.16e-053.44e-051.28e-055.05e-05 3.62e-059.45e-067.38e-061.31e-051.73e-051.56e-05 1.06e-053.45e-062.77e-062.08e-064.45e-063.61e-06 0.00e 007.53e-018.49e-017.33e-017.75e-016.13e-01 6.48e-012.75e-053.83e-057.19e-053.07e-055.85e-05 1.36e-051.40e-031.28e-041.52e-042.40e-042.93e-04 1.21e-035.34e-041.67e-043.79e-041.12e-041.30e-03 1e-021.09e-018.63e-015.20e-020.00e 000.00e 9.05e-013.16e-020.00e 000.00e e 000.00e 7.82e-036.40e-050.00e 000.00e 001.11e-069.24e-015.10e-034.78e-044.36e-04Table 2: The prevalence of different types of errors. The top half of the table shows the fraction of drives affected byeach type of error, and the bottom half the fraction of drive days affected.errors. We discuss correctable errors, including a studyof raw bit error rates (RBER), in more detail in Section 4.The next most common transparent types of error arewrite errors and erase errors. They typically affect 6-10%of drives, but for some models as many as 40-68% ofdrives. Generally less than 5 in 10,000 days experiencethose errors. The drives in our study view write and eraseerrors as an indication of a block failure, a failure typethat we will study more closely in Section 6.Errors encountered during a read operations are rarelytransparent, likely because they are due to bit corruptionbeyond what ECC can correct, a problem that is not fixable through retries. Non-final read errors, i.e. read errors that can be recovered by retries, affect less than 2%of drives and less than 2-8 in 100,000 drive days.In summary, besides correctable errors, which affectthe majority of drive days, transparent errors are rare incomparison to all types of non-transparent errors. Themost common type of non-transparent errors are uncorrectable errors, which affect 2–6 out of 1,000 drive days.and that of uncorrectable errors is strongly correlated andconclude that these final read errors are almost exclusively due to bit corruptions beyond what the ECC cancorrect. For all drive models, final read errors are aroundtwo orders of magnitude more frequent (in terms of thenumber of drive days they affect) than any of the othernon-transparent types of errors.In contrast to read errors, write errors rarely turn intonon-transparent errors. Depending on the model, 1.52.5% of drives and 1-4 out of 10,000 drive days experience a final write error, i.e. a failed write operation thatdid not succeed even after retries. The difference in thefrequency of final read and final write errors is likely dueto the fact that a failed write will be retried at other drivelocations. So while a failed read might be caused by onlya few unreliable cells on the page to be read, a final writeerror indicates a larger scale hardware problem.Meta errors happen at a frequency comparable to writeerrors, but again at a much lower frequency than finalread errors. This might not be surprising given that adrive contains much less meta-data than real data, whichlowers the chance of encountering an error accessingmeta data. Other non-transparent errors (timeout and response errors) are rare, typically affecting less than 1%of drives and less than 1 in 100,000 drive days.3.24Raw bit error rates (RBER)The standard metric to evaluate flash reliability is the rawbit error rate (RBER) of a drive, defined as the numberof corrupted bits per number of total bits read (includingcorrectable as well as uncorrectable corruption events).The second generation of drives (i.e. models eMLC-Aand eMLC-B) produce precise counts of the number ofcorrupted bits and the number of bits read, allowing usto accurately determine RBER. The first generation ofTransparent errorsMaybe not surprisingly, we find that correctable errorsare the most common type of transparent error. Virtuallyall drives have at least some correctable errors, and themajority of drive days (61-90%) experience correctable3USENIX Association14th USENIX Conference on File and Storage Technologies (FAST ’16) 69
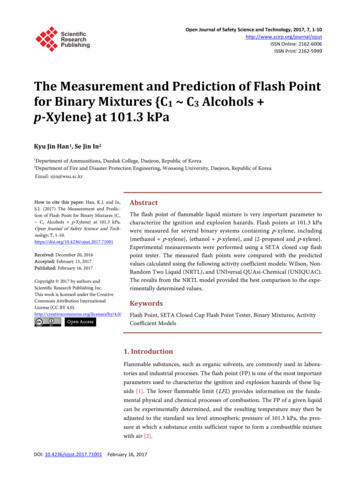
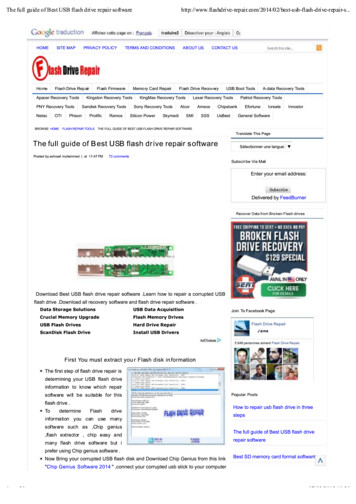
Model nameMedian RBER95%ile RBER99%ile 62.7e-05SLC-A5.4e-092.8e-076.2e-06SLC-B6.0 e-101.3e-082.2e-08SLC-C5.8 e-103.4e-083.5e-08SLC-D8.5 -093.3e-085.3e-08eMLC-A1.0 e-055.1e-051.2e-04eMLC-B2.9 e-062.6e-054.1e-05Table 3: Summary of raw bit error rates (RBER) for different models4.10.8MLC AMLC BA high-level view of RBERMLC CMLC DSLC ASLC B0.60.40.2prior UEsprior RBERerase countwrite countread count0.0prior pe cycleSpearman corr coeff1.0Age (months)drives report accurate counts for the number of bits read,but for each page, consisting of 16 data chunks, only report the number of corrupted bits in the data chunk thathad the largest number of corrupted bits. As a result,in the (unlikely) absolute worst case, where all chunkshave errors and they all have the same number of errorsas the worst chunk, the RBER rates could be 16X higherthan the drives record. While irrelevant when comparingdrives within the same generation, this subtlety must bekept in mind when comparing across generations.Figure 1: The Spearman rank correlation coefficient between the RBER observed in a drive month and otherfactors.Table 3 shows for each drive model the median RBERacross all drives for that model, as well as the 95th and99th percentile. We decided to work with medians andpercentiles since we find averages to be heavily biasedby a few outliers, making it hard to identify any trends.We observe large differences in the RBER across different drive models, ranging from as little as 5.8e-10 tomore than 3e-08 for drives of the first generation. Thedifferences are even larger when considering the 95th or99th percentile RBER, rather than the median. For example, the 99th percentiles of RBER ranges from 2.2e08 for model SLC-B to 2.7e-05 for MLC-D. Even withindrives of the same model, there are large differences: theRBER of a drive in the 99th percentile tends to be at leastan order of magnitude higher than the RBER of the median drive of the same model.The difference in RBER between models can be partially explained by differences in the underlying flashtechnology. RBER rates for the MLC models are ordersof magnitudes higher than for the SLC models, so thehigher price point for the SLC models pays off with respect to RBER. We will see in Section 5 whether thesedifferences will translate to differences in user-visible,non-transparent errors.The eMLC models report RBER that are several orders of magnitude larger than for the other drives. Eventaking into account that the RBER for the first generationdrives are a lower bound and might in the worst case be16X higher, there is still more than an order of magnitude difference. We speculate that feature size might bea factor, as the two eMLC models have the chips with thesmallest lithography of all models.Finally, there is not one vendor that consistently outperforms the others. Within the group of SLC and eMLCdrives, respectively, the same vendor is responsible forone of the worst and the best models in the group.In summary, RBER varies greatly across drive models and also across drives within the same model. Thismotivates us to further study what factors affect RBER.4.2What factors impact RBERIn this section, we consider the effect of a number offactors on RBER: wear-out from program erase (PE) cycles; physical age, i.e. the number of months a device hasbeen in the field, independently of PE cycles; workload,measured by the number of read, write, and erase operations, as an operation to a page can potentially disturbsurrounding cells; and the presence of other errors.We study the effect of each factor on RBER in twodifferent ways. We use visual inspection by plotting thefactor against RBER and we quantify the relationship using correlation coefficients. We use the Spearman rankcorrelation coefficient as it can also capture non-linearrelationships, as long as they are monotonic (in contrast,for example, to the Pearson correlation coefficient).Before analyzing individual factors in detail, wepresent a summary plot in Figure 1. The plot showsthe Spearman rank correlation coefficient between theRBER observed in a given drive month, and other factorsthat were present, including the device age in months,the number of previous PE cycles, the number of read,write or erase operations in that month, the RBER observed in the previous month and the number of uncorrectable errors (UEs) in the previous month. Values forthe Spearman correlation coefficient can range from -1470 14th USENIX Conference on File and Storage Technologies (FAST ’16)USENIX Association
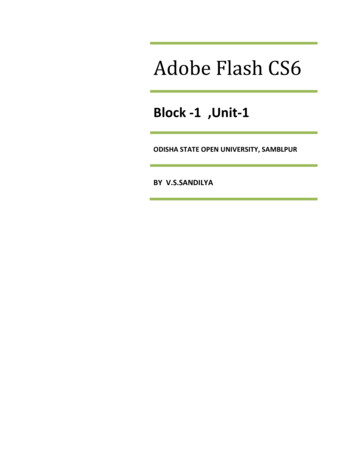
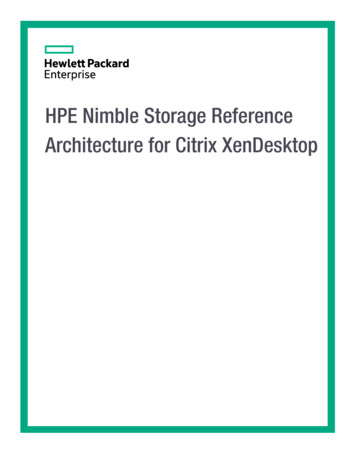
01000200030004000PE cycleMLC AMLC BMLC C2e 070e 0095th %ile RBER8e 08MLC DSLC ASLC B4e 080e 00Median RBERMLC AMLC BMLC C0MLC DSLC ASLC B1000200030004000PE cycle(a)(b)Figure 2: The figures show the median and the 95th percentile RBER as a function of the program erase (PE) cycles.(strong negative correlation) to 1 (strong positive correlation). Each group of bars shows the correlation coefficients between RBER and one particular factor (seelabel on X-axis) and the different bars in each group correspond to the different drive models. All correlation coefficients are significant at more than 95% confidence.We observe that all of the factors, except the prior occurrence of uncorrectable errors, show a clear correlation with RBER for at least some of the models. We alsonote that some of these correlations might be spurious,as some factors might be correlated with each other. Wewill therefore investigate each factor in more detail in thefollowing subsections.but by the time they reach their PE cycle limit (3,000 forall MLC models) there is a 4X difference between themodel with the highest and the lowest RBER.Finally, we find that the increase in RBER is surprisingly smooth, even when a drive goes past its expectedend of life (see for example model MLC-D with a PE cycle limit of 3,000). We note that accelerated life tests forthe devices showed a rapid increase in RBER at around3X the vendor’s PE cycle limit, so vendors PE cycle limits seem to be chosen very conservatively.4.2.2 RBER and age (beyond PE cycles)Figure 1 shows a significant correlation between age,measured by the number of months a drive has been inthe field, and RBER. However, this might be a spuriouscorrelation, since older drives are more likely to havehigher PE cycles and RBER is correlated with PE cycles.To isolate the effect of age from that of PE cycle wearout we group all drive months into bins using decilesof the PE cycle distribution as the cut-off between bins,e.g. the first bin contains all drive months up to the firstdecile of the PE cycle distribution, and so on. We verifythat within each bin the correlation between PE cyclesand RBER is negligible (as each bin only spans a smallPE cycle range). We then compute the correlation coefficient between RBER and age separately for each bin.We perform this analysis separately for each model, sothat any observed correlations are not due to differencesbetween younger and older drive models, but purely dueto younger versus older drives within the same model.We observe that even after controlling for the effectof PE cycles in the way described above, there is still asignificant correlation between the number of months adevice has been in the field and its RBER (correlationcoefficients between 0.2 and 0.4) for all drive models.We also visualize the effect of drive age, by separatingout drive days that were observed at a young drive age(less than one year) and drive days that were observedwhen a drive was older (4 years or more) and then plotting each group’s RBER as a function of PE cycles. Theresults for one drive model (MLC-D) are shown in Fig-4.2.1 RBER and wear-outAs the endurance of flash cells is limited, RBER ratesare expected to grow with the number of program erase(PE) cycles, with rates that have previously been reportedas exponential [5, 8, 18, 22]. The high correlation coefficients between RBER and PE cycles in Figure 1 confirmthat there is a correlation.To study the effect of PE cycles on RBER in moredetail, the two graphs in Figure 2 plot the median andthe 95th percentile RBER against the number of PE cycles. We obtain these graphs by dividing all drive daysin our data into different bins, based on their PE cyclecount, and then determine the median and 95th percentileRBER across all days in a bin.We observe that, as expected, RBER grows with thenumber of PE cycles, both in terms of median and 95thpercentile RBER. However, the growth rate is slowerthan the commonly assumed exponential growth, andmore closely resembles a linear increase. We verified thisobservation through curve fitting: we fit a linear modeland an exponential model to the data and find that thelinear model has a better fit than the exponential model.The second interesting observation is that the RBERrates under wear-out vary greatly across drive models,even for models that have very similar RBER rates forlow PE cycles. For example, the four MLC models startout with nearly identical RBER at very low PE cycles,5USENIX Association14th USENIX Conference on File and Storage Technologies (FAST ’16) 71
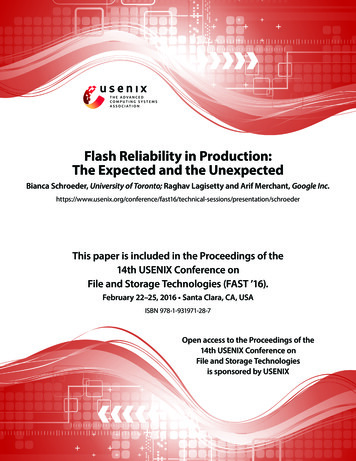
6e 083e 080e 00Median RBERerase operations, and find that for model SLC-B the correlation between RBER and read counts persists.Figure 1 also showed a correlation between RBER andwrite and erase operations. We therefore repeat the sameanalysis we performed for read operations, for write anderase operations. We find that the correlation betweenRBER and write and erase operations is not significant,when controlling for PE cycles and read operations.We conclude that there are drive models, where the effect of read disturb is significant enough to affect RBER.On the other hand there is no evidence for a significantimpact of write disturb and incomplete erase operationson RBER.Old drivesYoung drives01000200030004000PE cyclesFigure 3: RBER rates as a function of P/E cycles foryoung and old drives, showing that age has an effect onRBER, independently of P/E cycle induced wear-out.ure 3. We see a marked difference in the RBER ratesbetween the two groups, across all PE cycles.We conclude that age, as measured by days in the field,has a significant effect on RBER, independently of cellwear-out due to PE cycles. That means there must beother aging mechanisms at play, such as silicon aging.4.2.4 RBER and lithographyDifferences in feature size might partially explain the differences in RBER across models using the same technology, i.e. MLC or SLC. (Recall Table 1 for an overviewof the lithography of different models in our study.) Forexample, the two SLC models with a 34nm lithography (models SLC-A and SLC-D) have RBER that arean order of magnitude higher than the two 50nm models(models SLC-B and SLC-C). For the MLC models, theonly 43nm model (MLC-B) has a median RBER that is50% higher than that of the other three models, which areall 50nm. Moreover, this difference in RBER increasesto 4X with wear-out, as shown in Figure 2. Finally, theirsmaller lithography might explain the higher RBER forthe eMLC drives compared to the MLC drives.In summary, there is clear evidence that lithographyaffects RBER.4.2.3 RBER and workloadBit errors are thought to be caused by one of four different mechanisms: retention errors, where a cell losescharge over time; read disturb errors, where a read operation disturbs the charge in a nearby cell; write disturberrors, where a write disturbs the charge in a nearby cell;or an incomplete erase errors, where an erase operationdid not fully reset the cells in an erase block.Errors that are of the latter three types (read disturb, write disturb, incomplete erase) will be correlatedwith workload, so understanding the correlation betweenRBER and workload helps us understand the prevalenceof different error mechanisms. A recent field study [16]concludes that errors in the field are dominated by retention errors, while read disturb errors are negligible.Figure 1 shows a significant correlation between theRBER in a given drive month and the number of read,write, and erase operations in the same month for somemodels (e.g. a correlation coefficient above 0.2 for modelMLC-B and above 0.6 for model SLC-B). However, thismight be a spurious correlation, as the per-month workload might be correlated with the total number of PE cycles seen so far. We use the same technique as describedin Section 4.2.2 to isolate the effects of workload fromthat of PE cycles, by binning the drive months based onthe prior PE cycles, and then determining correlation coefficients separately for each bin.We find that the correlation between the number ofread operations in a given drive month and the RBERin the same month does persist for models MLC-B andSLC-B, even when controlling for the PE cycles. We alsorepeat a similar analysis, where we isolate the effect ofread operations from the count of concurrent write and4.2.5 Presence of other errorsWe investigate the relationship between RBER and othererrors (such as uncorrectable errors, timeout errors, etc.),in particular whether RBER is higher in a month that alsoexperiences other types of errors.Figure 1 shows that while RBER experienced in theprevious month is very predictive of future RBER (correlation coefficient above 0.8), there is no significant correlation between uncorrectable errors and RBER (see theright-most group of bars in Figure 1). Correlation coefficients are even lower for other error types (not shownin plot). We will further investigate the relationship between RBER and uncorrectable errors in Section 5.2.4.2.6 Effect of other factorsWe find evidence that there are factors with significantimpact on RBER that our data does not directly accountfor. In particular, we observe that the RBER for a particular drive model varies depending on the cluster wherethe drive is deployed. One illustrative example is Figure 4, which shows RBER against PE cycles for drives of672 14th USENIX Conference on File and Storage Technologies (FAST ’16)USENIX Association
321Read/write ratioCluster 1Cluster 2Cluster 3Average06e 080e 00Median RBERCluster 1Cluster 2Cluster 3Average01000200030000PE cycles1000200030004000PE cycles(a)(b)Figure 4: Figure (a) shows the median RBER rates as a function of PE cycles for model MLC-D for three differentclusters. Figure (b) shows for the same model and clusters the read/write ratio of the workload.bad blocks until the drives reached more than 3X of theirPE cycle limit. For the eMLC models, more than 80%develop uncorrectable errors in the field, while in accelerated tests no device developed uncorrectable errors before 15,000 PE cycles.We also looked at RBER reported in previous work,which relied on experiments in controlled environments.We find that previously reported numbers span a verylarge range. For example, Grupp et al. [10, 11] reportRBER rates for drives that are close to reaching their PEcycle limit. For SLC and MLC devices with feature sizessimilar to the ones in our work (25-50nm) the RBERin [11] ranges from 1e-08 to 1e-03, with most drive models experiencing RBER close to 1e-06. The three drivemodels in our study that reach their PE cycle limit experienced
14th USENIX Conference on File and Storage Technologies (FAST 16). February 2–25, 01 Santa Clara, CA, USA ISBN 78--931971-28-7 Open access to the Proceedings of the 14th USENIX Conference on File and Storage Technologies is sponsored by USENIX Flash Reliability in Pro