Transcription
Monitoring VoIP Call Quality Using ImprovedSimplified E-modelHaytham Assem, David MaloneJonathan Dunne, Pat O’SullivanHamilton Institute, National University of Ireland,MaynoothHitham.Salama.2012, David.Malone@nuim.ieSystems and Performance Engineering, IBM Dublin,Software LabJonathan dunne, patosullivan@ie.ibm.comAbstract—ITU-T recommendation G.107 introduced the Emodel, a repeatable way to assess if a network is prepared tocarry a VoIP call or not. Various studies show that the Emodel is complex with many factors to be used in monitoringpurposes. Consequently, simplified versions of the E-modelhave been proposed to simplify the calculations and focus onthe most important factors required for monitoring the callquality. In this paper, we propose simple correction to asimplified E-model; we show how to calculate the correctioncoefficients for 4 common codecs (G.711, G.723.1, G.726 andG.729A) and then we show that its predictions better matchPESQ scores by implementing it in a monitoring application.of the listeners are considered an important factor inestimating accurate scores. Thus, subjective testing usingMOS is time consuming, expensive and does not allow realtime measurement. Consequently, in recent years newmethods were developed for measuring MOS scores in anobjective way (without human perception): PESQ [4], Emodel [5] and several others.PESQ, Perceptual Evaluation of Speech Quality, isconsidered an objective method for predicting the speechquality. It is an intrusive testing method which takes intoaccount two signals; one is the reference signal while theother one is the actual degraded signal. Both signals are sentthrough the test that uses a PESQ algorithm and the result isa PESQ score. Consequently, this approach cannot be used tomonitor real time calls.Nowadays, a new objective method proposed by TU-TG.107 [5] defines the E-model, a mathematical model thatcombines all the impairment factors that affect the voicequality in a single metric called R value that is mapped toMOS scale. The E-model was designed to provide estimatednetwork quality and has shown to be reasonably accurate forthis purpose. It has not been accepted as a valid measurementtool for live networks. The ITU-T G.107 Recommendation[5] states at the beginning of the document that “it isconsidered only estimates for the transmission planningpurposes and not for actual customer opinion prediction”unlike the PESQ [4] which is developed to model subjectivetests commonly used in telecommunications to assess thevoice quality by human beings.Increasingly and against ITU recommendations, the Emodel is being used nowadays by industry and research as alive voice quality measurement tool. Thus, simple versionsof E-model [1, 6] have been proposed to simplify thecomplexity of the original E-model [5] and focus on mostimportant part that affect the VoIP call quality.The objective of our work is to provide a monitoringsystem using a simplified version of the E-model correctedfor 4 common codecs to better predict PESQ MOS scores asPESQ is generally considered to provide more accuratepredictions of user experience than the E-model.This paper is organized as follows: Section 2 describesthe proposed improved simplified E-model. In Section 3 weshow how we derived the correction coefficients used in theimproved simplified E-model. In Section 4 we propose ourresults using the derived model by implementing it in amonitoring application. Finally, we conclude and summarizethe paper in Section 5.Keywords-VoIP; E-model; PESQ; MonitoringI. INTRODUCTIONThe evaluation of data networks depends on severalfactors. Thus, it is argued that it is not appropriate to use asingle metric to evaluate the quality of data networks. Yet inthe telephony world, a single number is typically given torate call quality. Such value is used as a basis of monitoringand tuning the network. Voice over Internet Protocol (VoIP)is an example of such data network application [1].In previous years, VoIP has become an importantapplication and is expected to carry more and more voicetraffic over TCP/IP networks. In real-time voice applications,the speech quality is impaired by the packet loss, jitter, delayand bandwidth. Consequently, VoIP applications require lowdelay, low packet loss rates, low jitter and sufficientbandwidth in order not to affect the interaction between callparticipants.VoIP is based on IP network; however IP networksfrequently provide best effort services, and may notguarantee delay, packet loss, and jitter [2]. So, the predictionof voice quality in different environments and traffic loadsmay be as important part of network monitoring in order tomeasure voice quality and prevent critical problems beforethey occur.As measuring voice quality is important to the serviceproviders and end users, ITU-T provides two test methodssubjective and objective testing. Subjective testing wasconsidered the earliest attempts on this issue to evaluate thespeech quality by giving Mean Opinion Scores (MOS). TheMOS test is one of the widely known accepted tests that givea speech quality rating. ITU-T Rec. P.800 [3] presents theMOS test procedures as users can rate the speech qualityfrom 1(Poor) to 5 (Excellent) scale. Of course, the numbers
II. IMPROVED SIMPLIFIED E-MODELIn this section, we will first give a brief description of thesimplified E-model [6] and then we will describe ourproposed improvements to the simplified E-model with themethod of calculation of the various parameters used in themodel in order to be applicable in monitoring purposes.A. Simplified E-ModelThe original E-model is very complex [7] and involvedwith many factors. Moreover, the voice processing is notrelated significantly to the instantaneous judgment of QoS.Thus, a simplified version of the E-model [6] has beenintroduced to focus on the most important parts andafterwards it was used in a monitoring system [2]. Thismodel takes in to account the codec and the present networkconditions which are the main two factors that affect thevoice quality. The simplified E-model is expressed byequation (1) by calculating the evaluation value R.R R0 – Icodec – Ipacketloss – Idelay(1)Where R0 represents the basic signal to noise ratio, Idelayrepresents the delays introduced from end to end, Icodec isthe codec factor and the Ipacketloss is the packet loss ratewithin a particular time. Finally the R value is mapped toMOS score.B. Improved simplified E-ModelThe objective of this model is to determine the voicequality MOS rating by a simplified modified version of theprevious E-model described above. The computationalmodel consists of a mathematical function of parameters ofthe transmission system. The computation itself can be splitinto several elements and can be expressed by the followingequation (2).(2)Where is a second order function corrected using curvesfitted to PESQ scores which is the standard objective methoddefined by ITU-T recommendation P.862 [4],is theaverage delay time within specified period and A is theexpectation factor due to the communication system. Thedescription and method of calculating the previousparameters ( , and A) in (2) are as follows:1):as mentioned above is a second order function modelcorrected with PESQ scores to obtain more accurate resultsin our monitoring system. Ry can be expressed by thefollowing equation (3).(3)Whereis a part of the simplified E-model (1) which iscorrected with PESQ scores,can be obtained by thefollowing expression (4) and a, b, c are codecs coefficients asshown in Table I and derived in section III.(4)TABLE I.CODECS SPECIAL COEFFICIENTSCodecabcG.7110.18-27.901126.62G.723.1 311.7224kG.729A1.1)is the basic signal to noise ratio, including noisesources such as circuit and room noise. However, currently itis really difficult to calculatedirectly. Thus, ITU-TG.113 [8] provides the common value of . Since, theinherent degradation that occurs when converting actualspoken conversation to a network signal and back reducesthe theoretical maximum R-value (94.2) with noimpairments to 93.2 [5]. So, we set the R0 value to 93.2.1.2)is the equipment impairment (codec quality) factors asdefined in [8] and [9]. It represents the codec distortionwhich leads to voice distortion and impairments arisingbecause of signal conversions. Nowadays, its value isdetermined by looking up the codec in the ITU-TRecommendation G.113 literature [8] as Table II is part of it.TABLE II.SOME CODING teIe value(Kbit/s):is the packet loss percentage within a particularperiod measured by certain number of packets. Thepercentage measured is the loss of packets occurred when thesender’s packets is not received by the receiver. It can beexpressed by the following formula (5).(5)Where DS is the difference between the largest and smallestsequence number of N packets. Statistics and calculation ofthe Real-time Transport Protocol (RTP) packets can be usedto calculate this percentage by the following expression (6).DS LS-SS 1(6)
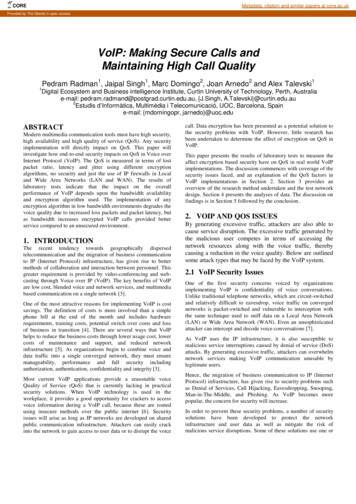
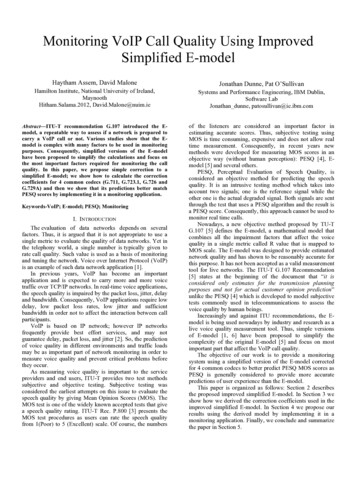
Where LS and SS are the largest and smallest sequencenumbers respectively. They are extracted from the RTPheader of the sequence number field from the packetsreceived.2):The delay components contributing toprovided inITU-T G.107 [5] are, the average absolute one waymouth to ear delay. T, the average one way delay from thereceive side to the point in the end to end path where asignal coupling occurs as a source of echo. , the averagetrip delay in the 4 wire loop. G.107 [5] gives a fullyanalytical expression for the function , interms of , T,and parameters associated with a general referenceconnection describing various circuit switched and packetswitch inter-working scenarios. Assuming perfect echocancellation, all the factors incan be collapsed in asingle points as shown in (7) and(d) is now function onlyof the one way delay d. (d) can be calculated by a seriesof complex equations in ITU-T G.107 [5] as shown with theplotted curve ofvs one way delay in Fig.1 (labeled“G.107”).(7)The one way delay (d) is the time it takes to get dataacross the network. The one-way delay measured from oneend of the network to the other end is mainly composed offour components that can be expressed in equation (8).d t0 t1 t2 t3(8)Where t0 is the propagation delay, t1 is the transport delay,t2 is the packetization delay and t3 is the jitter buffer delay.In this paper we approximate these four components bymeasuring the response time (round-trip delay) as in mostmodern devices t1, t2 shall be small. Thus, ping should bereasonable.In our model we used a simplified version of (9) asprovided in [10]. This model shows accuracy for one waydelay less than 400ms as shown in Figure 1 (labeled “AT&Tsimplified model”). We found this model reasonable as ITUT recommend that one-way delay should not be more than150 ms for good speech quality[11].Figure 1.versus one-way delay3) A:The advantage factor, A represents an “advantage ofaccess”, introduced into transmission planning for the Emodel (ITU-T G.107) [5]. This value can be used directly asan input parameter to the E-model. Provisional A values arelisted in [5] as show in Table III. Assuming ourcommunication system is conventional then we neglect Avalue.TABLE III. EXAMPLES FOR THE ADVATAGE FACTOR ACommunication SystemConventional (wire bound)Mobility by cellular networks in abuildingMobility in a geographical area ormoving in a vehicleAccess to hard-to-reach locations, e.g.,via multi-hop satellite connectionsMaximum valueof A051020The R value of the E-model is finally transformed toMOS score that will reflect the user level of satisfaction asshown in Table IV, theoretical range of transmissionperformance rating factor R from 0 to 100. R 0 represents ofthe worst quality and R 100 represents the best quality. TheR factor value for estimated average score of MOS can beexpressed by equation (10).For R 0: MOS 1ForFor R 100: MOS 4.5(10)TABLE IV.RELATIONSHIP BETWEEN R-VALUE AND USER’S SATISFACTION(9)H(x) 0,if x 0WhereH(x) 1,if x 0R-Value90-10080-9070-8060-7050-600-50Satisfaction LevelVery satisfiedSatisfiedSome users dissatisfiedMany users dissatisfiedNearly all users dissatisfiedNot recommendedMOS4.3 4.0-4.33.6-4.03.1-3.62.6-3.11.0-2.6
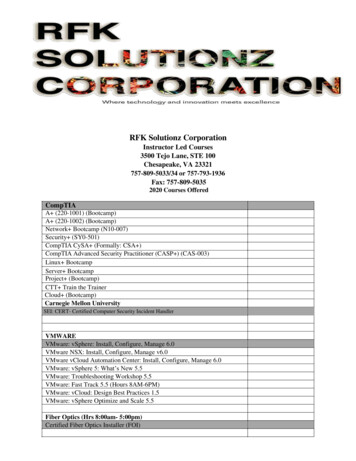
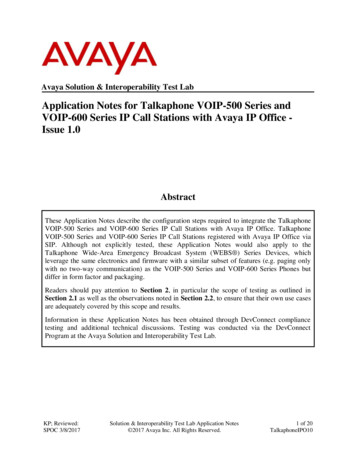
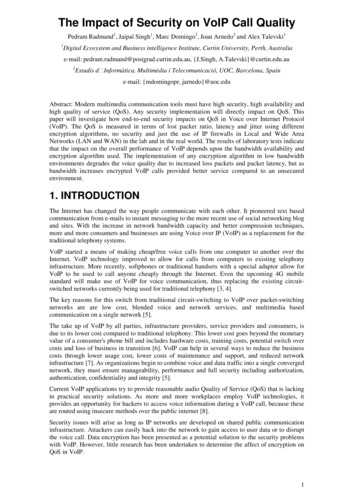
III. CORRECTION OF THE SIMPLIFIED E-MODELIn this section we show how we derived the values of a, band c (Table I) used in our improved simplified E-modeldescribed in the previous section.In our experiment shown in Figure 2 we have developeda java program that stream RTP packets using 4 main audiocodecs (G.711, G.726, G.723.1 and G.729A). We recordedthe voice at both ends and measured the PESQ scores underdifferent random packet loss rate ranges from 0-20%. Foreach packet loss rate, we repeated the experiment 10 timestaking the average MOS PESQ score in order to increase theaccuracy of the results as much as possible.Figure 4. Relationship betweenFigure 2. Deriving codecs coefficients a,b and cThe PESQ scores are converted from MOS to R valueand this can be conducted by a complicated Candono’sFormula as in [12] or by the simplified 3rd-order polynomialfitting [13] as shown in (11).(11)The converted PESQ scores from (11) will represent thevalues shown in the below graphs (Fig.3-Fig.4) on the yaxis. Since PESQ does not take the delay factor in itsaccount, so we correct the rest part of the model which wename it(see equation 3) represented on x axis.We found that it is well matched second order relationfunction and then we derived the coefficients a, b and c as inTable I using least-squares fitting method. The graphs below(Figure 3-Figure 4) show the correlation between theconverted values from PESQ and the R values from thesimplified E-model for individual codecs in different lossranges.Figure 3. Relationship betweenand(G723.1 and G711)and(G726 and G729A)IV. MONITORING SYSTEM DESIGN AND RESULTSThe monitoring system could target specific number ofRTP packets to capture and perform an effective MOS valuecalculation. The system will use a coefficient database forthe codec used in the call. This monitoring system isdeveloped for monitoring VoIP quality at the networkterminals, and the environment could be a personal or familynetwork with voice quality monitoring.The whole system works as follows: The system usesnetwork capturing module to capture a certain number ofpackets passed to specific IP and port. Non RTP packets willbe filtered. When this process completes the packet capture,the system will analyze the data, delay and packet loss rate asdescribed previously in section II. The MOS score iscalculated to assess voice call quality in this period of thecall. We took our results online with introducing randompacket loss rate in the network using Dummynet [14].We compared our monitoring system using MOS scoresbased on the codec’s coefficients (see Table I) derived for 4main codecs with the simplified version of the E-model thatis used in monitoring purposes [1, 6] and the PESQ scores.The graphs (Figure 5-Figure 8) show our results for the 4codecs. It can be observed that the MOS scores of ourimproved simplified E-model based on the coefficientdatabase (Table I) are very close to the PESQ scores unlikethe simplified E-model which gives an advantage for thecorrected model in monitoring purposes for the VoIP callquality.Figure 5. Comparative Analysis (G.723.1)
Figure 6. Comparative Analysis (G.711)Consequently, we have proposed an improved simplifiedE-model and show how we derived the coefficients used inthe model for 4 common codecs (G.711, G.723.1, G.726 andG.729A). We demonstrate its results by implementing it in amonitoring system; our system analyzes the impact of voicequality encoding factors under various network conditionsand uses our simplified improved E-model to assess voicequality. The main advantage of our improved simplifiedversion that, it is less complex than the original E-modelmodel and it is more accurate than the simplified versionsused.We stress three benefits of our work. The first asconfirmed by the experiment, the simplified version of Emodel does not provide accurate results compared to PESQscores. The second, the correction coefficients derivedenhance the simplified E-model to monitor/predict the callquality. The third, proposing a complete design ofmonitoring system using our improved simplified E-modelfor 4 common codecs. Another output of our work is a javaapplication that stream RTP packets using number of codecs.ACKNOWLEDGMENTThe authors were supported by Science Foundation Ireland(SFI) grants 07/SK/I1216a and 08/SRC/I1403.REFERENCES[1][2][3]Figure 7. Comparative Analysis (G.726)[4][5][6][7][8][9][10]Figure 8. Comparative Analysis (G.729A)V.DISCUSSION AND CONCLUSIONThe E-model brings a new approach to the computationof estimated voice quality. The main advantage of using Emodel that it is classified as an objective non intrusivemethod that can be applied in real time. On contrary to theITU-Recommendation, simplified versions of E-model havebeen introduced by researchers and industry to be used formonitoring purposes and predicting the VoIP call quality.[11][12][13][14]John Q. Walker, “Assessing VoIP Call Quality Using the E-model”,NetIQ Corporation.Junsheng Zhang and Xiaohua Sun, “The VoIP phone QoS protectionin the wide-are network”, Computer learning .2006 No.6 .17-18.ITU-T Recommendation P.800, “Methods for subjectivedetermination of transmission quality”, Geneva, 08/1996.ITU-T Recommendation P.862, “Perceptual evaluation of speechquality(PESQ): An objective method for end-to-end speech qualityassessment of narrow-band telephone networks and speech codecs”,Febrauary 2001.ITU-T Recommendation G.107, “The E-model: A computationalmodel for use in transmission planning”, Geneva, 04/2009.Chunlei Jiang and Peng Huang, “Research of Monitoring VoIP VoiceQoS”, International Conference on Internet Computing andInformation Services, 2011.Pystechnics Limited, “The E-Model, R Factor and MOS”, 23Museum street Ipswitch, Suffolk United Kingdom. December 2003.10-41.ITU-T Recommendation G.113, “Transmission impairments due tospeech processing”, 2001.ITU-T Recommendation P.833, “Methodology for derivation ofequpment impairment factors from subjective listening-only tests”,2001.R.G.Cole and J.Rosenbluth, “Voice over IP performance monitoring”,ACM comput. Commun. Rev., vol. 31, no. 2,pp. 9-24, April 2001.S.Pracht and D.Hardman: “Voice Quality in Converging Telephonyand IP Networks, Agilent Technologies”, White 0-0989E.pdfC. Hoene, H. Karl, and A. Wolisz, “A perceptual quality model foradaptive VoIP applications”, Int. Symp. Performance Evaluation ofComputer and Telecommunication Systems(SPECTS’04), SanJose,CA.L. Sun, “Speech Quality Prediction for voice Over Internet ProtocolNetworks”, Ph.D dissertation, Univ. Plymouth, UK., Jan 2004.Marta Carbona and Luigi Rizzo, “Dummynet Revisited”, ACMSIGCOMM Computer Communication ReviewVolume 40 Issue 2,April 2010, 12-20.
of voice quality in different environments and traffic loads may be as important part of network monitoring in order to measure voice quality and prevent critical problems before they occur. As measuring voice quality is important to the service providers and end users, ITU-T provides two test methods subjective and objective testing.